
- Contact Us:
-

-

-

-


Daily Market Updates
27 Dec 2022
USDJPY
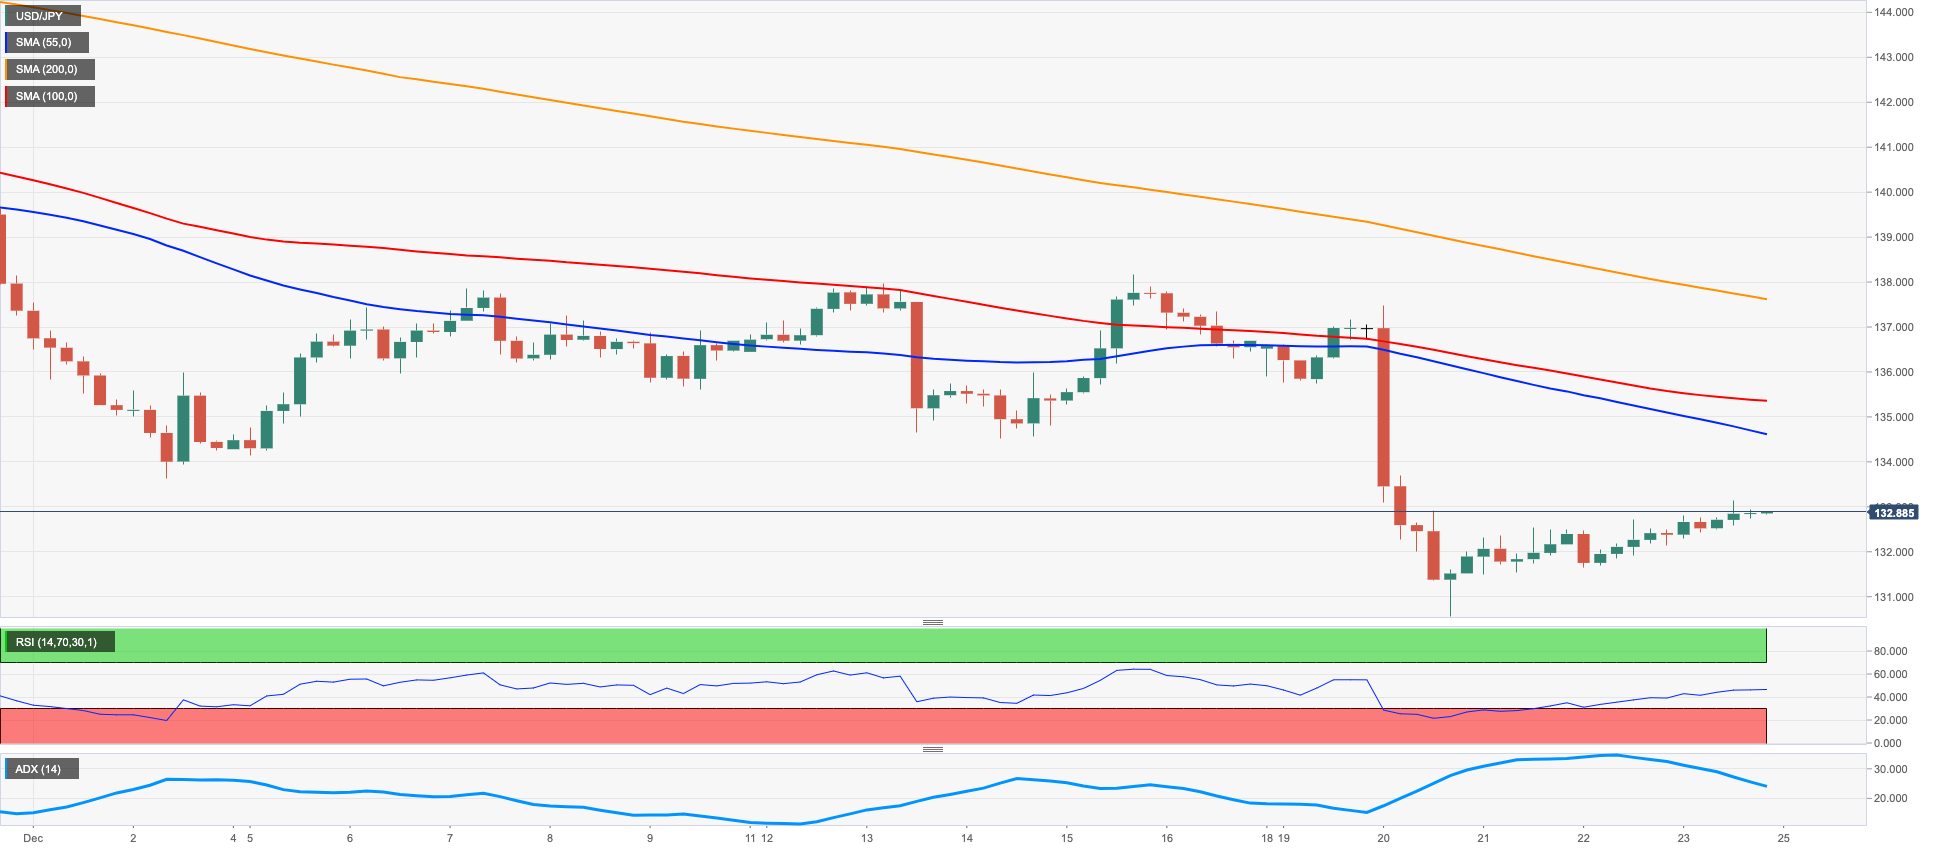
USD/JPY resumed the upside and surpassed the 133.00 mark at the end of the week, just to give away part of those gains afterwards and close the session around 132.75.
The small downtick in the greenback somewhat limited the upside in the pair, although another firm session in US yields across the curve maintained the daily upside well and sound in spot.
In the meantime, market participants continued to digest the recent hawkish tweak from the BoJ and seem to have started to price in a potential exit move from the current ultra-accommodative monetary stance at some point in H1 2023, or even Q1 2023.
In the domestic calendar, Inflation Rate rose at an annualized 3.8% in November, while Core Inflation Rate increased 3.7% YoY and the Inflation Rate Ex-Food and Energy advanced 2.8% YoY.
Further data saw the publication of the BoJ Minutes of the December event, where some members suggested it is premature to predict that inflation will remain stable near the 2% area amidst the ongoing uncertainty overseas.
Despite Friday’s uptick, USD/JPY risks further downside in the short term. That said, the loss of the December low at 130.56 (December 20) should put the August low at 130.39 (August 2) back to the investors’ radar prior to the key round level at 130.00. Just the opposite, there is an initial barrier at the 200-day SMA at 135.91 ahead of the weekly high at 138.17 (December 15) and another weekly top at 139.89 (November 30). Above the latter appears the round level at 140.00 followed by the interim 100- and 55-day SMAs at 141.13 and 141.69, respectively before the weekly top at 142.25 (November 21). The daily RSI edged higher and surpassed the 35 level.
Resistance levels: 132.71 137.47 138.17 (4H chart)
Support levels: 130.56 129.51 127.08 (4H chart)
GBPUSD
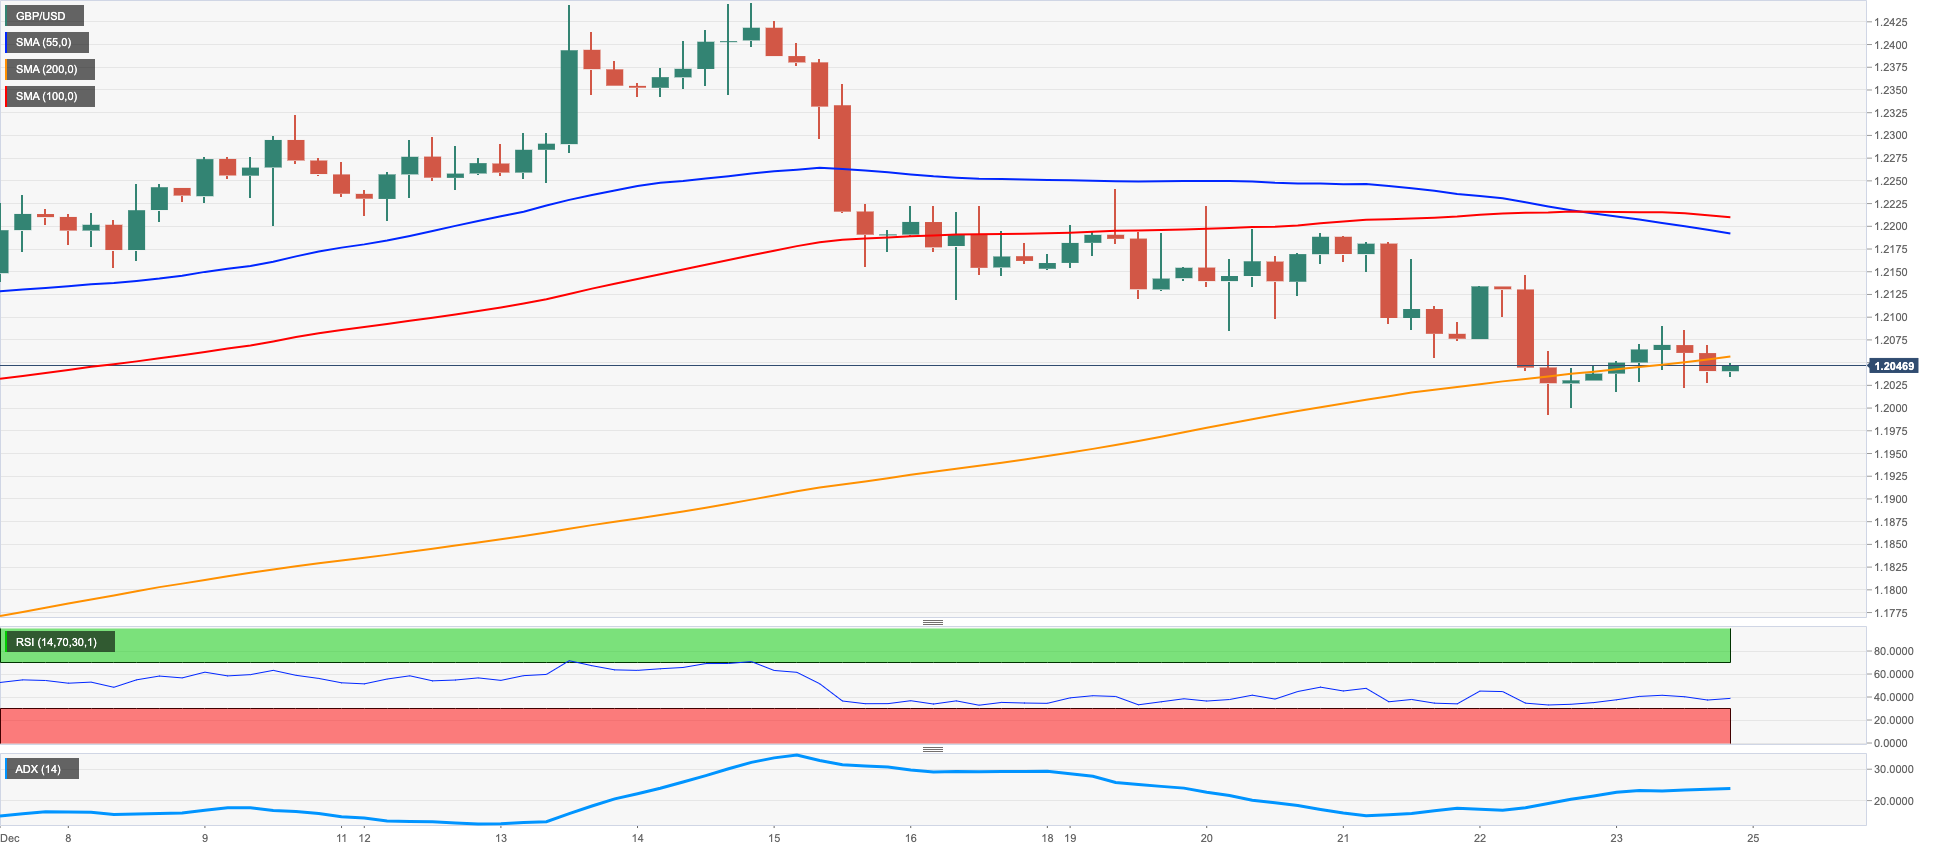
GBP/USD ended the session in the positive territory after two straight daily losses, returning to the area beyond the key 1.2000 mark following Thursday’s pullback to the 1.1990 region.
The knee-jerk in the US dollar allowed the British pound and the rest of its risk-linked peers to regain the smile at the beginning of the week, although it did not prevent Cable from printing the third weekly pullback in a row.
Moving forward the Sterling is expected to remain under scrutiny pari passu with markets’ expectations of further tightening by the Bank of England and the current scenario of recession in the domestic economy.
There were no data releases in the UK docket other than Car Production for the month of November, which expanded 5.7% from a year earlier.
GBP/USD remains under pressure. Against this, a convincing breakdown of the critical 200-day SMA, today at 1.2072, should pave the way for extra losses to, initially, the weekly low at 1.1991 (December 23) ahead of another weekly low at 1.1900 (November 30) and the temporary 55- and 100-day SMAs at 1.1763 and 1.1669, respectively. A deeper drop could retest the November low at 1.1142 (November 4) seconded by the weekly low at 1.1059 (October 21). Inversely, there is no changes to the topside, as the December top at 1.2446 (December 14) turns up as the immediate resistance level ahead of the May peak at 1.2666 (May 27). Up from here comes the 200-week SMA at 1.2929 just before the psychological 1.3000 mark. The daily RSI advanced marginally to the area past 49.
Resistance levels: 1.2090 1.2147 1.2223 (4H chart)
Support levels: 1.1991 1.1900 1.1778 (4H chart)
AUDUSD
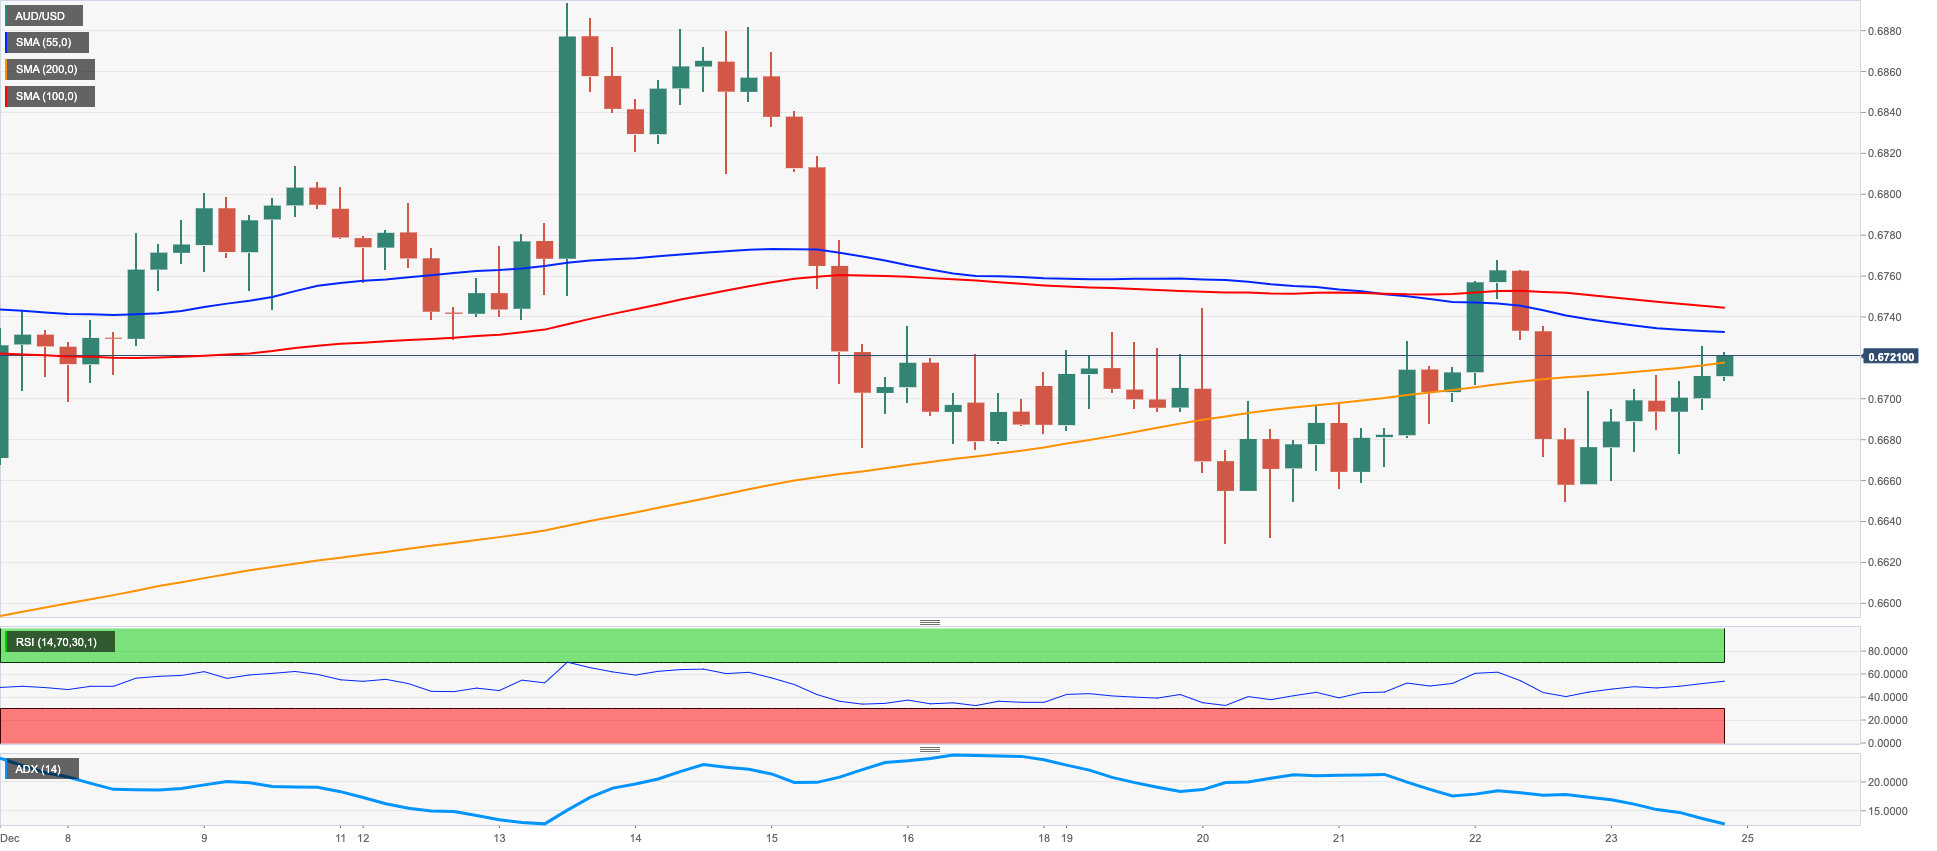
AUD/USD faded the previous day’s pullback and closed the week with a smile above the 0.6700 mark on Friday, at the same time resuming the upside when we look at the weekly chart.
In fact, the pair printed strong gains on the back of the daily retracement in the greenback and the prevailing upbeat sentiment in the risk complex. In addition, the generalized positive performance in the commodity space also lent legs to the Aussie dollar, with copper prices ending the week with decent gains and the iron ore extending the consolidation around the $110.00 region per tonne.
In Oz, Housing Credit expanded at a monthly 0.4% in November, while Private Sector Credit rose 0.5% MoM in the same month and 8.9% YoY.
In case AUD/USD breaks above the ongoing side-lined theme, the next up barrier aligns at the weekly top at 0.6767 (December 22) ahead of the 200-day SMA at 0.6879, all ahead of the December peak at 0.6893 (December 13). North from here emerges the September high at 0.6916 (September 13) followed by the psychological 0.7000 mark and the weekly top at 0.7008 (August 26). On the flip side, there is an initial contention area at the December low at 0.6629 (December 20) prior to the weekly low at 0.6584 (November 21) and the 55-day SMA at 0.6569. The loss of the latter could retest another weekly low at 0.6386 (November 10) and the November low at 0.6272 (November 3). The daily RSI rose past the 51 zone.
Resistance levels: 0.6724 0.6767 0.6893 (4H chart)
Support levels: 0.6650 0.6629 0.6584 (4H chart)
GOLD
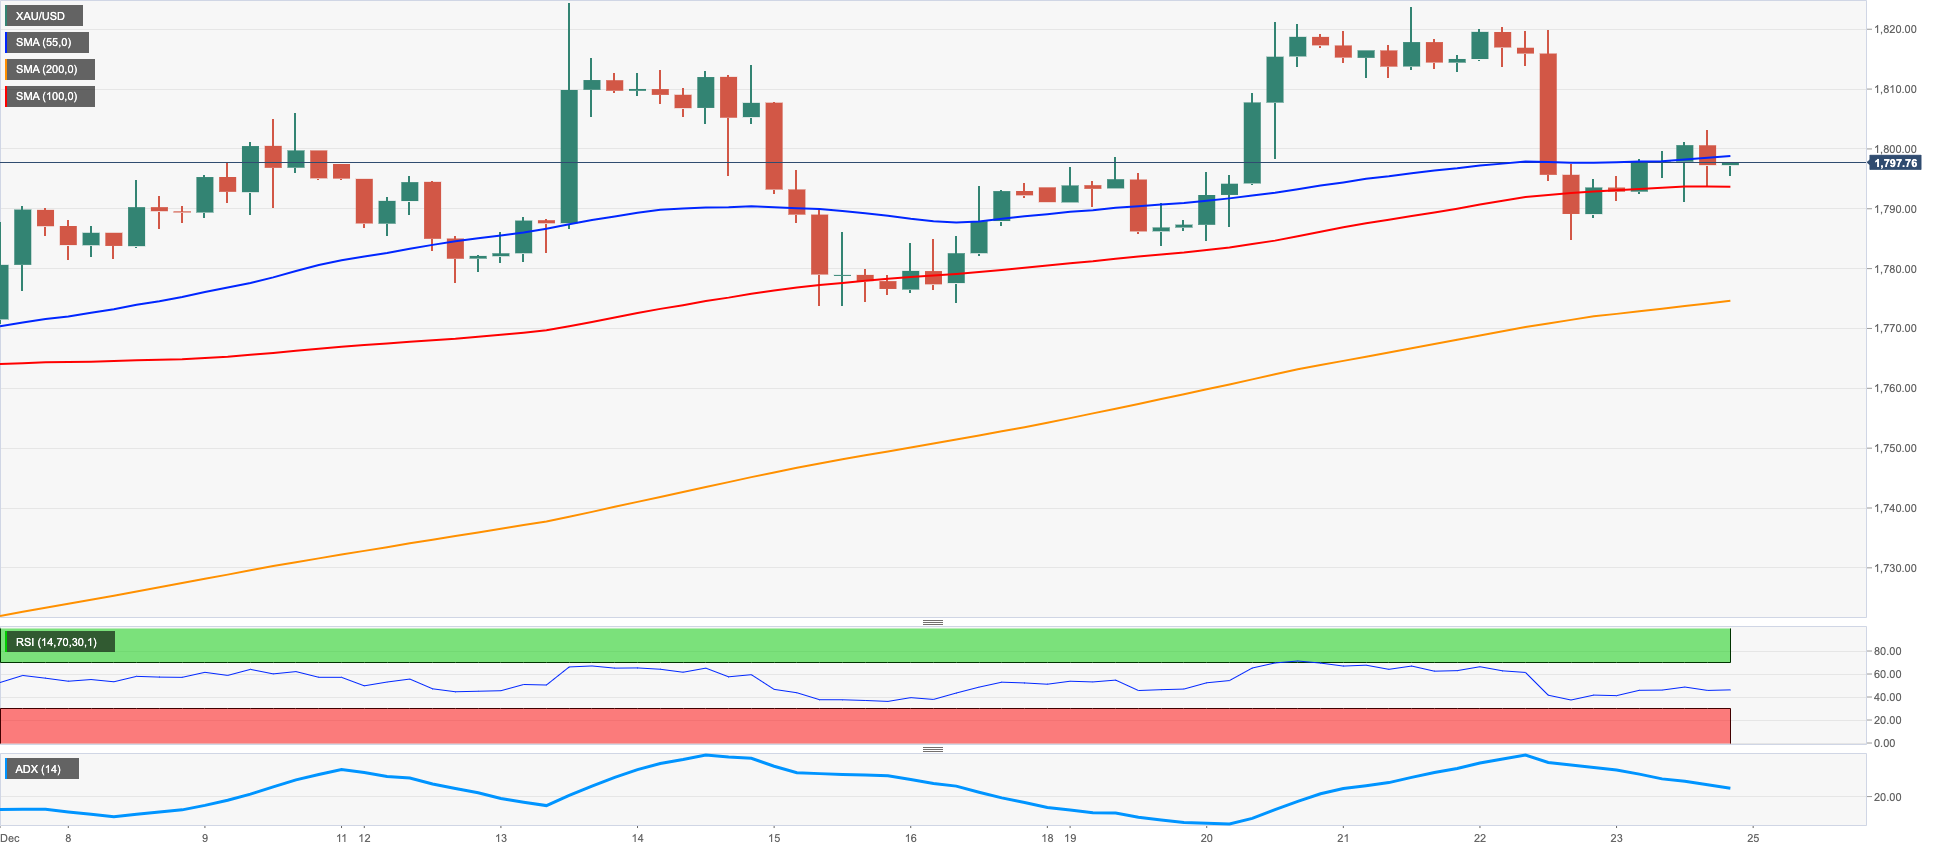
The soft note in the dollar at the end of the week lent legs to the yellow metal and pushed it back above the critical $1800 mark per ounce troy, although closing a bit lower eventually.
So far, the precious metal appears to have met quite a tough barrier in the $1820 region and is expected to continue to closely follow the potential next steps of the Fed’s normalization process.
Friday’s uptick in bullion came in tandem with the corrective decline in the dollar, although the march north in US yields limited the upside in the commodity.
Further upside in gold is expected to initially face the December top at $1824 (December 13) ahead of the June peak at $1879 (June 13) and seconded by the May high at $1909 (May 5). Contrastingly, the breach of the key 200-day SMA at $1783 could prompt the weekly low at $1773 (December 15) to emerge on the horizon prior to the December low at $1765 (December 5) and the weekly low at $1727 (November 23). Down from here comes the temporary 100- and 55-day SMAs in the $1720 region before the 2022 low at $1614 (September 28)., occasional bullish attempts should target
Resistance levels: $1823 $1833 $1841 (4H chart)
Support levels: $1784 $1772 $1764 (4H chart)
CRUDE WTI
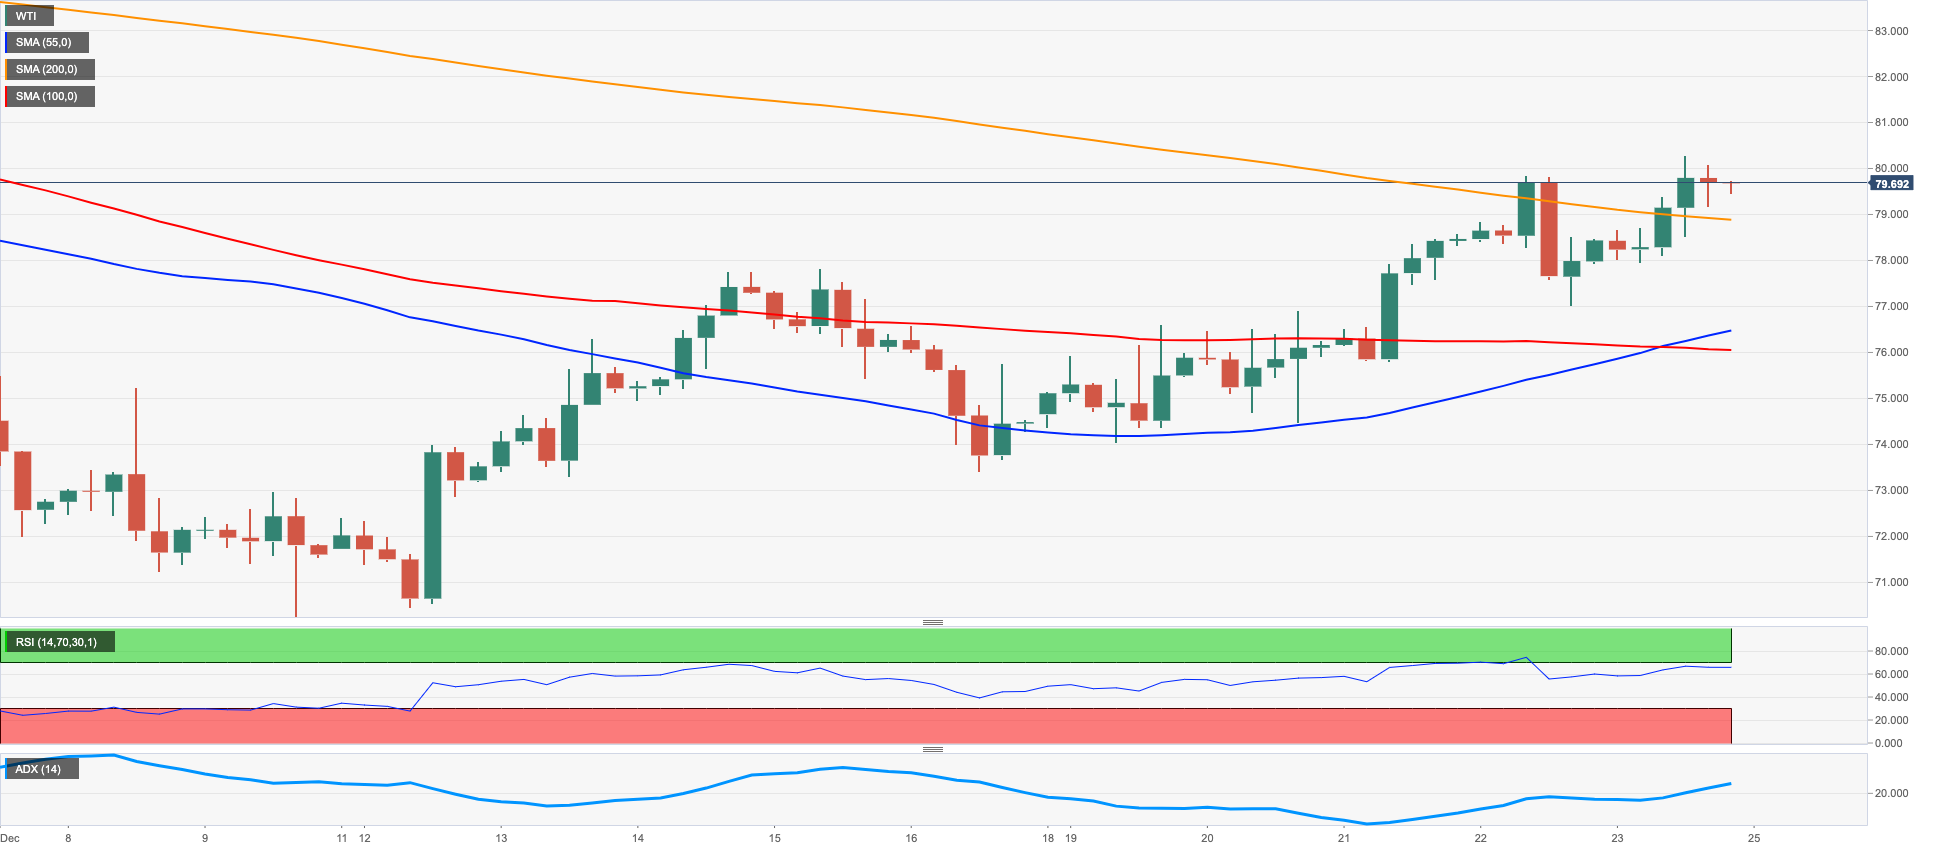
Prices of the barrel of the West Texas Intermediate (WTI) closed the second consecutive week with gains on Friday.
Indeed, WTI prices managed to briefly surpass the key $80.00 mark per barrel on Friday just to settle a tad lower on the back of news citing that Russia could trim its oil output (between 5%-7% as soon as early 2023) in response to the G7/EU price cap, all reigniting supply concerns.
If we take into account the potential reopening of the Chinese economy – the second world oil importer – the prospects for a tight supply scenario – and a probable move higher in prices - appear to be on the rise.
The softer tone in the dollar also bolstered the daily gains in the commodity, as the USD Index (DXY) traded on the defensive after two daily advances in a row.
In the docket, driller Baker Hughes said the US oil rig count increased by 2 to 622 active oil rigs in the week to December 23.
An advance past the weekly high at $80.30 (December 23) could motivate the WTI to challenge the December high at $83.32 (December 1) ahead of the 100-day SMA at $84.61 and the $90.08 level (November 11). Beyond the latter aligns the November peak at $93.73 ahead of the key 200-day SMA at $95.24. Inversely, the next contention of relevance emerges at the 2022 low at $70.10 (December 9) just ahead of the round level at $70.00 and the weekly low at $66.15 (December 20 2021). South from here comes the 200-week SMA at $65.18 seconded by the December 2021 low at $62.46 (December 2).
Resistance levels: $80.30 $82.70 $83.32 (4H chart)
Support levels: $77.01 $74.42 $73.31 (4H chart)
GER40
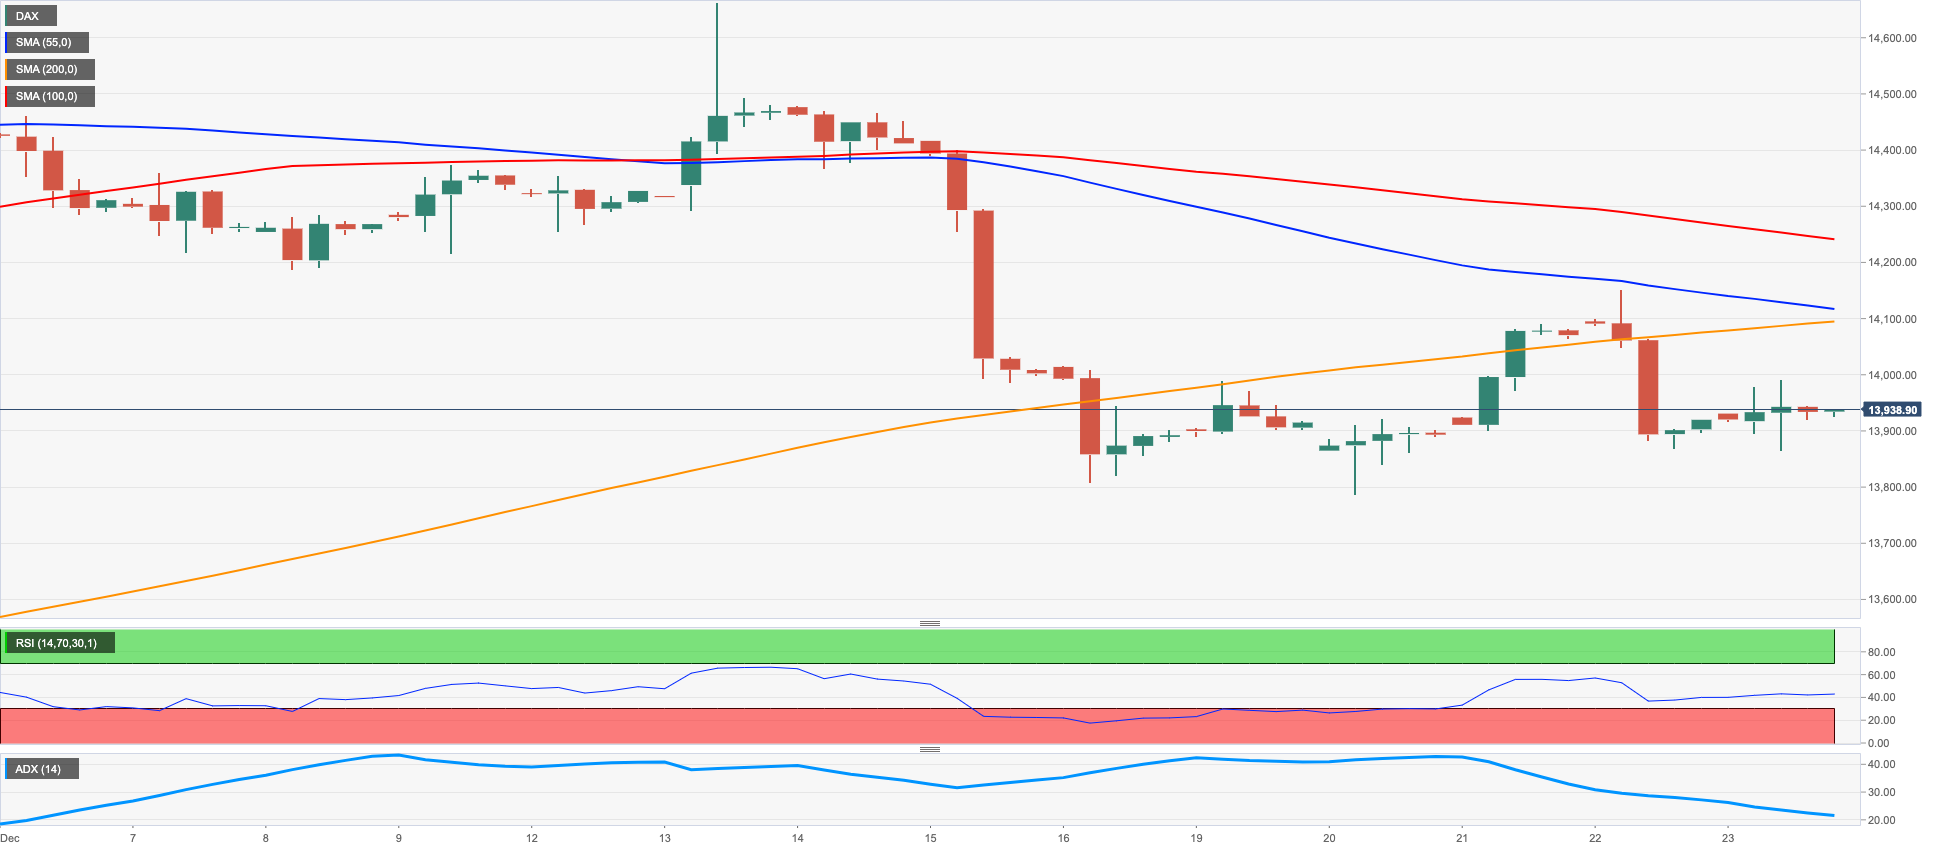
The German stock benchmark DAX 40 charted an inconclusive session and ended the week just below the 14000 mark on Friday.
In fact, German equities printed marginal gains following Thursday’s sharp sell-off on the back of the improved sentiment in the risk-associated universe at the end of the week.
In the German debt market, the persistent selling pressure remained unchanged around bonds, lifting yields of the 10-year bund reference to new multi-week highs past the 2.40% level.
Next on the upside for the DAX appears the weekly peak at 14160 (December 22) ahead of the December high at 14675 (December 13) and the June top at 14709 (June 6). The break above the latter could open the door to the March peak at 14925 (March 29) seconded by the 2022 high at 16285 (January 5). Contrarily, the December low at 13791 (December 20) emerges as the next support of note prior to the key 200-day SMA at 13567 and the 100-day SMA at 13381. If the DAX breaks below this level it could then dispute the November low at 13022 (November 3) before the minor support at 12548 (October 21). The daily RSI looked stable near 45.
Best Performers: Fresenius Medical Care AG, Zalando SE, HeidelbergCement AG
Worst Performers: RWE AG, Infineon Technologies AG, Covestro AG
Resistance levels: 14160 14675 14709 (4H chart)
Support levels: 13791 13472 13022 (4H chart)
NASDAQ
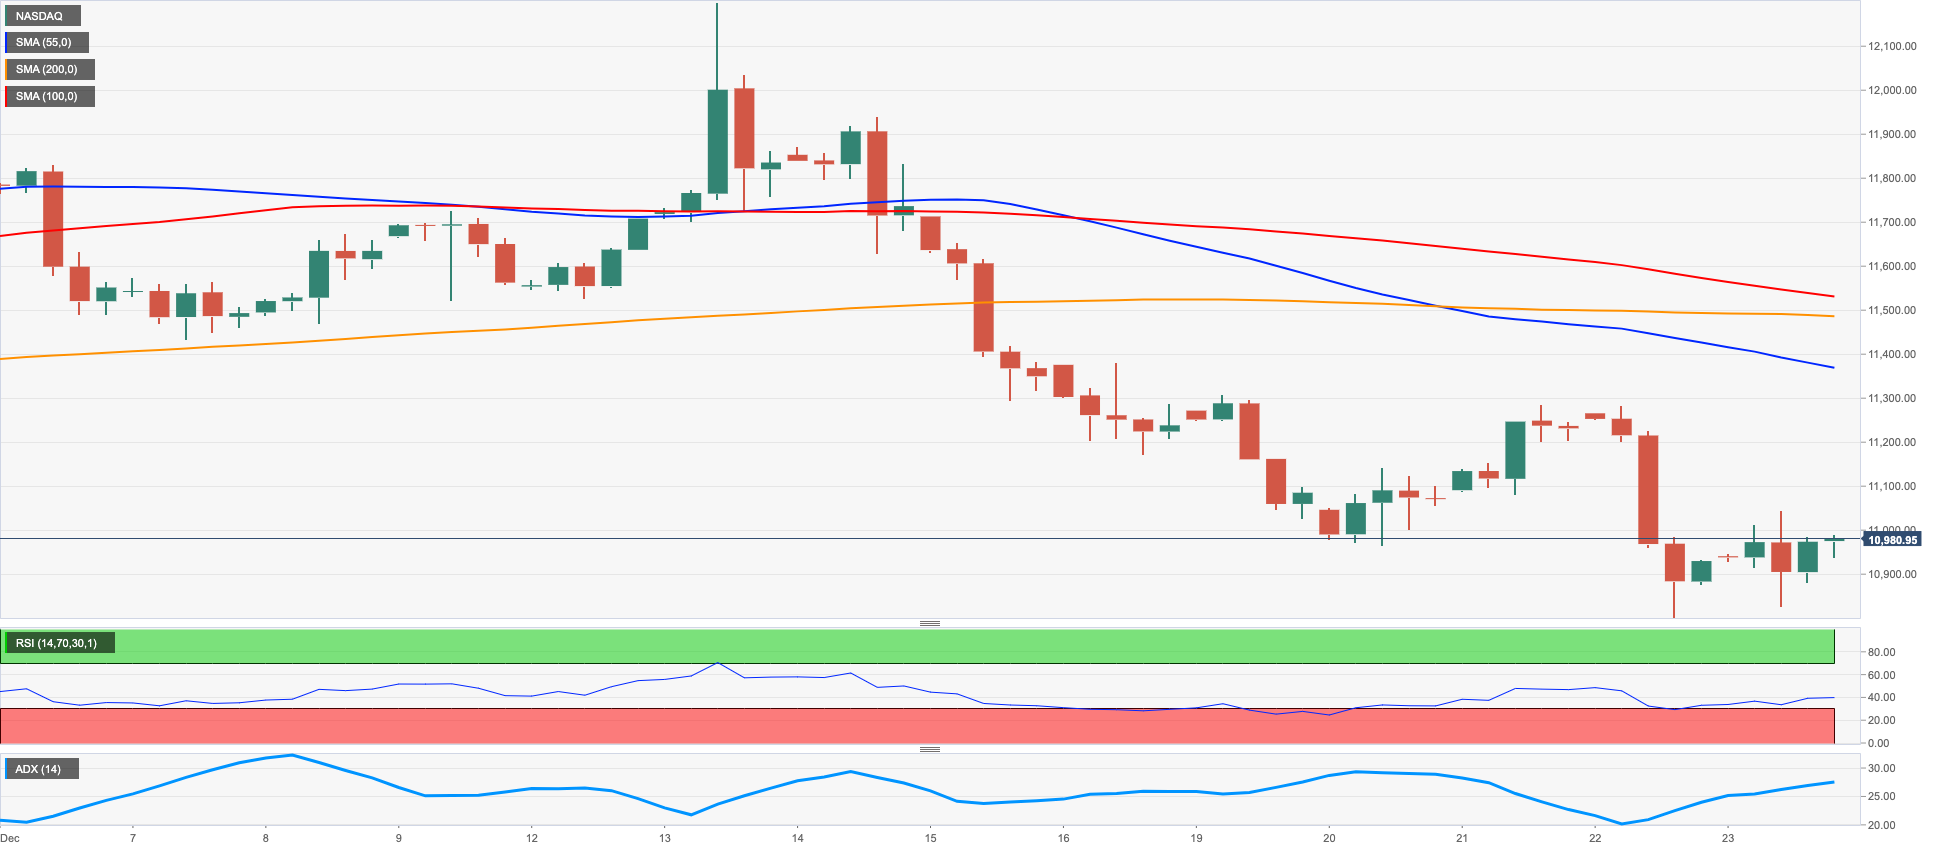
Friday’s uptick in the Nasdaq (+0.21% to 10497) was insufficient to reverse the weekly retracement in the US tech sector, which remained under pressure amidst prospects for a tighter-for-longer Fed in the next months.
That said, the index closed the third straight week with losses, including a visit to levels last seen back in late October near 10300 on December 22.
The index, however, managed to post decent gains despite the move higher in US yields across the curve, while the corrective move in the dollar also added to the upbeat mood in the tech sector at the end of the week.
The breach of the December low at 10313 (December 22) could encourage sellers to revisit the November low at 10262 (November 4) prior to the 2022 low at 10088 (October 13) and the weekly low at 9663 (June 29 2020). Alternatively, the weekly top at 10753 (December 21) should offer initial resistance ahead of the 55- and 100-day SMAs at 10894 and 11345, respectively. Once cleared this region, the Nasdaq Composite could dispute the December peak at 11571 (December 13) before the key 200-day SMA at 11838 and the September high at 12270 (September 12). The daily RSI advanced marginally to the 39 zone.
Top Gainers: Expion 360, Elys Game Technology Corp, Wavedancer
Top Losers: Applied Molecular, E-Home Household Service Holdings Ltd, Mingzhu
Resistance levels: 10753 11352 11399 (4H chart)
Support levels: 10313 10262 10088 (4H chart)
DOW JONES
US equities ended the week on a positive note, as investors assessed another lower print of US inflation, this time tracked by the PCE for the month of November. In addition, US Consumer Sentiment remained healthy while consumer spending appeared somewhat stagnant.
Overall, the Dow Jones reversed two consecutive weekly losses, while the S&P500 and the Nasdaq Composite extended the downtrend for the third week in a row.
In the meantime, market participants kept looking to the potential next moves by the Fed in a context where inflation pressures seem to be losing traction month by month, the labour market remains tight and the economy in general looks resilient.
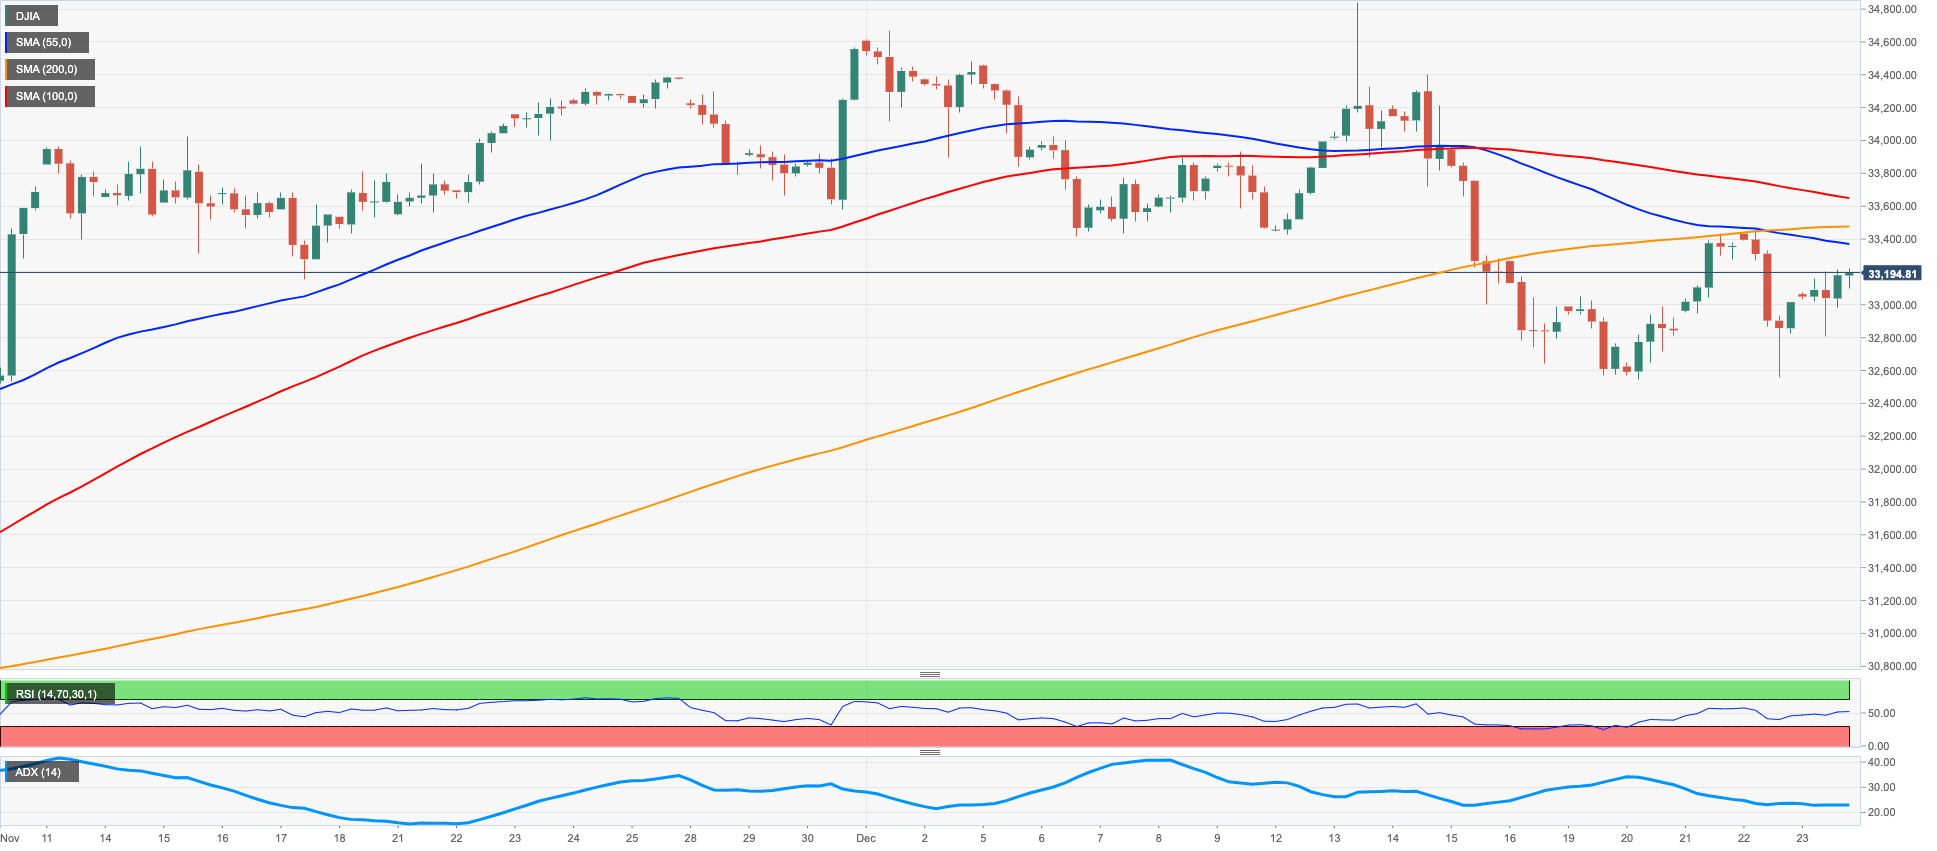
All in all, the Dow Jones gained 0.53% to 33203, the S&P500 rose 0.59% to 3844 and the tech-benchmark Nasdaq Composite advanced 0.21% to 10497.
The always relevant 200-day SMA at 32454 should hold the initial downside test in the Dow Jones. The loss of this region could open the door to the November low at 31727 (November 3) ahead of the minor support at 30206 (October 21) and the 2022 low at 28660 (October 13). On the other hand, the initial up barrier comes at the weekly peak at 33437 (December 21) prior to the December high at 34712 (December 13) and the April top at 35492, all seconded by the February peak at 35824 (February 9). The daily RSI gathered upside traction and rose above 48.
Top Performers: Chevron, Walt Disney, Dow
Worst Performers: 3M, Amgen, Nike
Resistance levels: 33437 34395 34712 (4H chart)
Support levels: 32573 32183 31727 (4H chart)
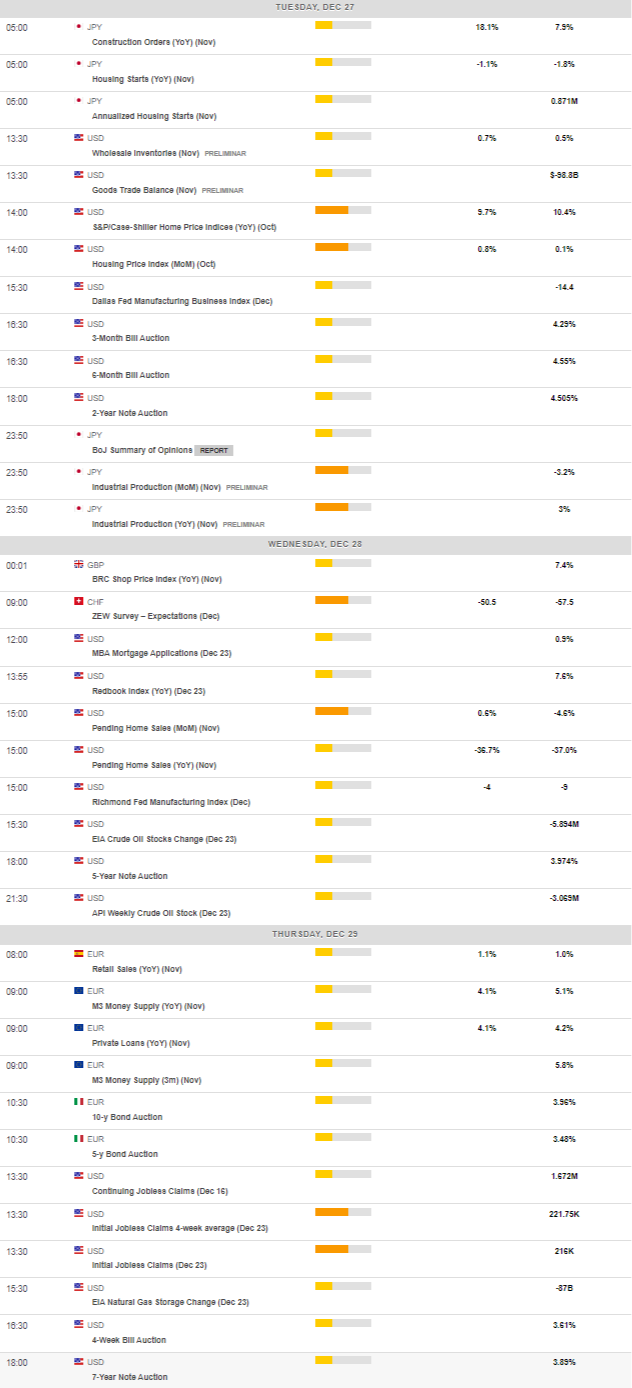
MACROECONOMIC EVENTS
All Information & Updates provided by:

All information relating to the financial markets available on this page has been prepared and issued by FXStreet (Forexstreet SL, Spain, Reg: B62498233) on the basis of publicly available information and all information believed to be reliable and does not conflict with Kuwaiti local laws, and all necessary care has been taken to before the company to ensure that the facts mentioned are correct from the source.
NCM Investment nor any of its directors or employees shall in any way be held responsible for the contents of this news, and the information contained on this page is intended only to provide clients with publicly available information and should not be construed as investment advice, report or analysis and/or constitute an offer or invitation to buy or sell financial instruments of any kind.
RISK WARNING: Forex and CFDs are highly risky leveraged products, as losses can exceed deposits. Please ensure you understand all the risks and take independent advice if necessary. NCM will segregate the clients based on the criteria of the regulator and its bylaws. NCM does not provide any advisory service; the material published does not constitute advice or a recommendation for a transaction in any financial instrument. NCM accepts no responsibility for any use of the content presented and any consequences of that use. Anyone acting on the information provided does so at their own risk.