
- Contact Us:
-

-

-

-


Daily Market Updates
28 Dec 2022
USDJPY
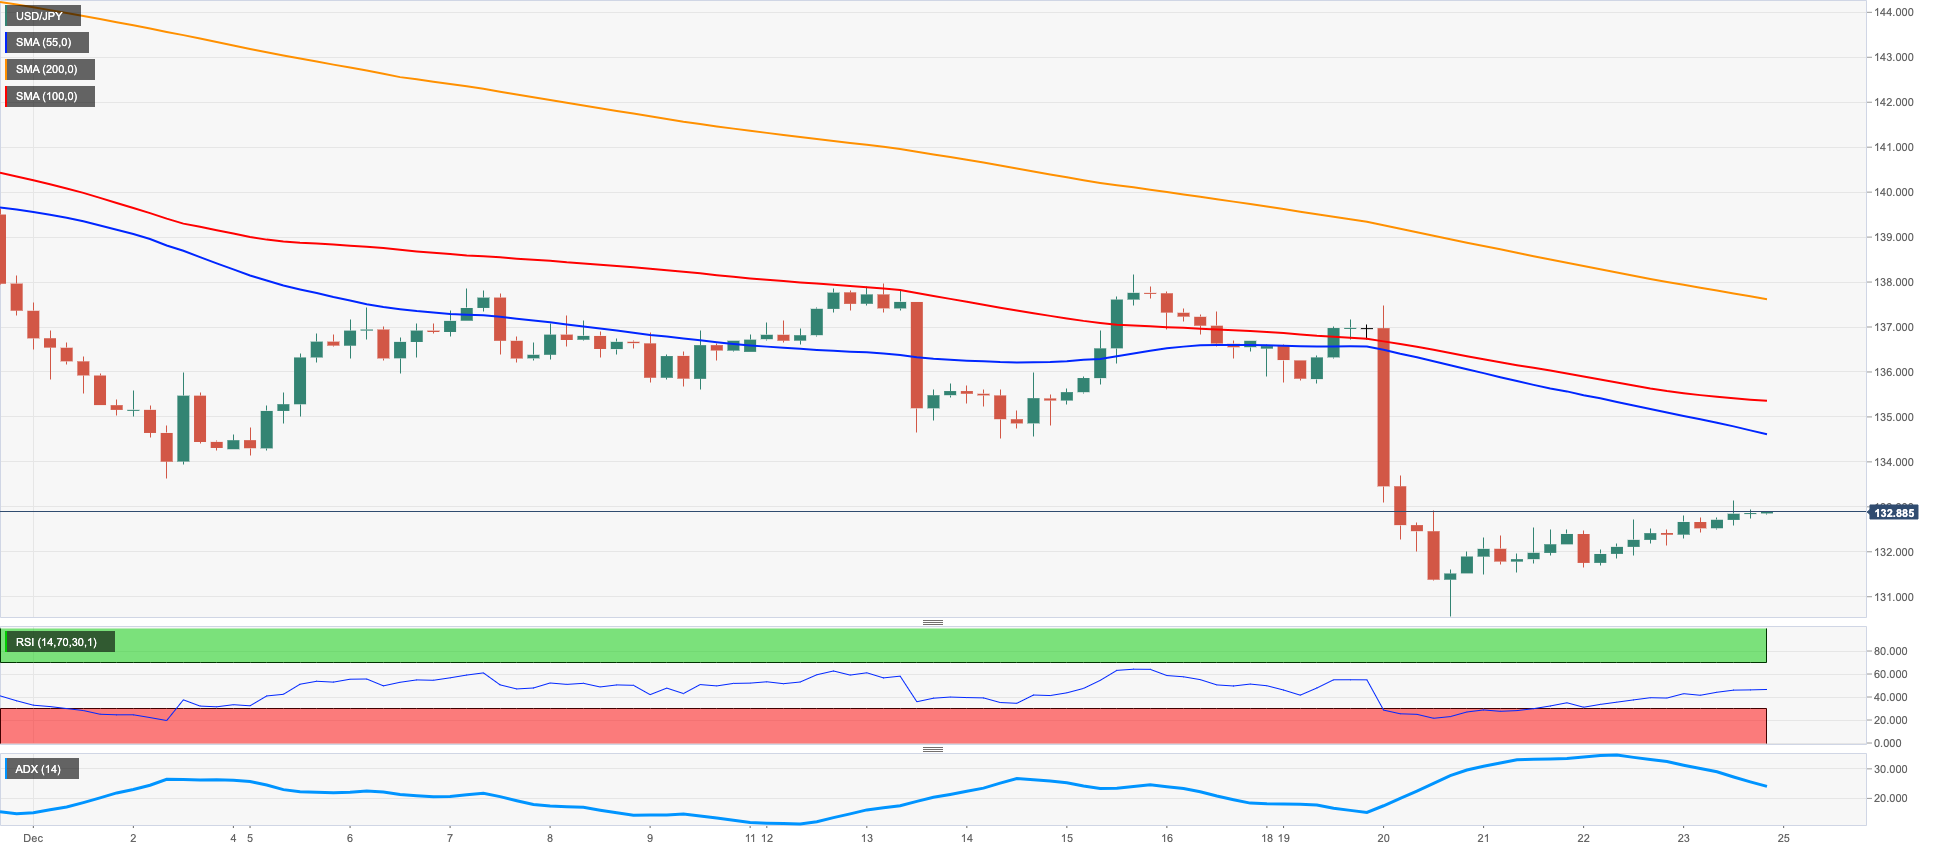
The recovery in USD/JPY reached the third consecutive session on Tuesday, this time reclaiming the area above 133.00 the figure in an atmosphere still dominated by the risk-on sentiment.
On the latter, the dollar remained on the defensive, while US yields advanced markedly and enough to sustain further the pair’s bounce off last week’s post-BoJ lows to the mid-130.00s region (December 20).
BoJ’s H.Kuroda was on the wires early in the Asian trading hours and said that the recent widening of the Yield Curve Control (YCC) was “definitely not a step towards and exit”.
In Japan, the Unemployment Rate ticked down to 2.5% in November, while Retail Sales expanded at an annual rate of 2.6% in the same month. Finally, Housing Starts contracted 1.6% vs. November 2021.
Next on the upside in USD/JPY now turns up the key 200-day SMA at 135.91 followed by the weekly top at 138.17 (December 15) and another weekly peak at 139.89 (November 30). If the pair clears this level, it could then dispute the round level at 140.00 ahead of the temporary 100- and 55-day SMAs at 141.09 and 141.23, respectively, and the weekly peak at 142.25 (November 21). Inversely, there are no support levels of significance until the December low at 130.56 (December 20) prior to the August low at 130.39 (August 2) and the key round level at 130.00. The daily RSI rebounded past the 37 mark.
Resistance levels: 133.19 137.47 138.17 (4H chart)
Support levels: 132.30 131.63 130.56 (4H chart)
GBPUSD
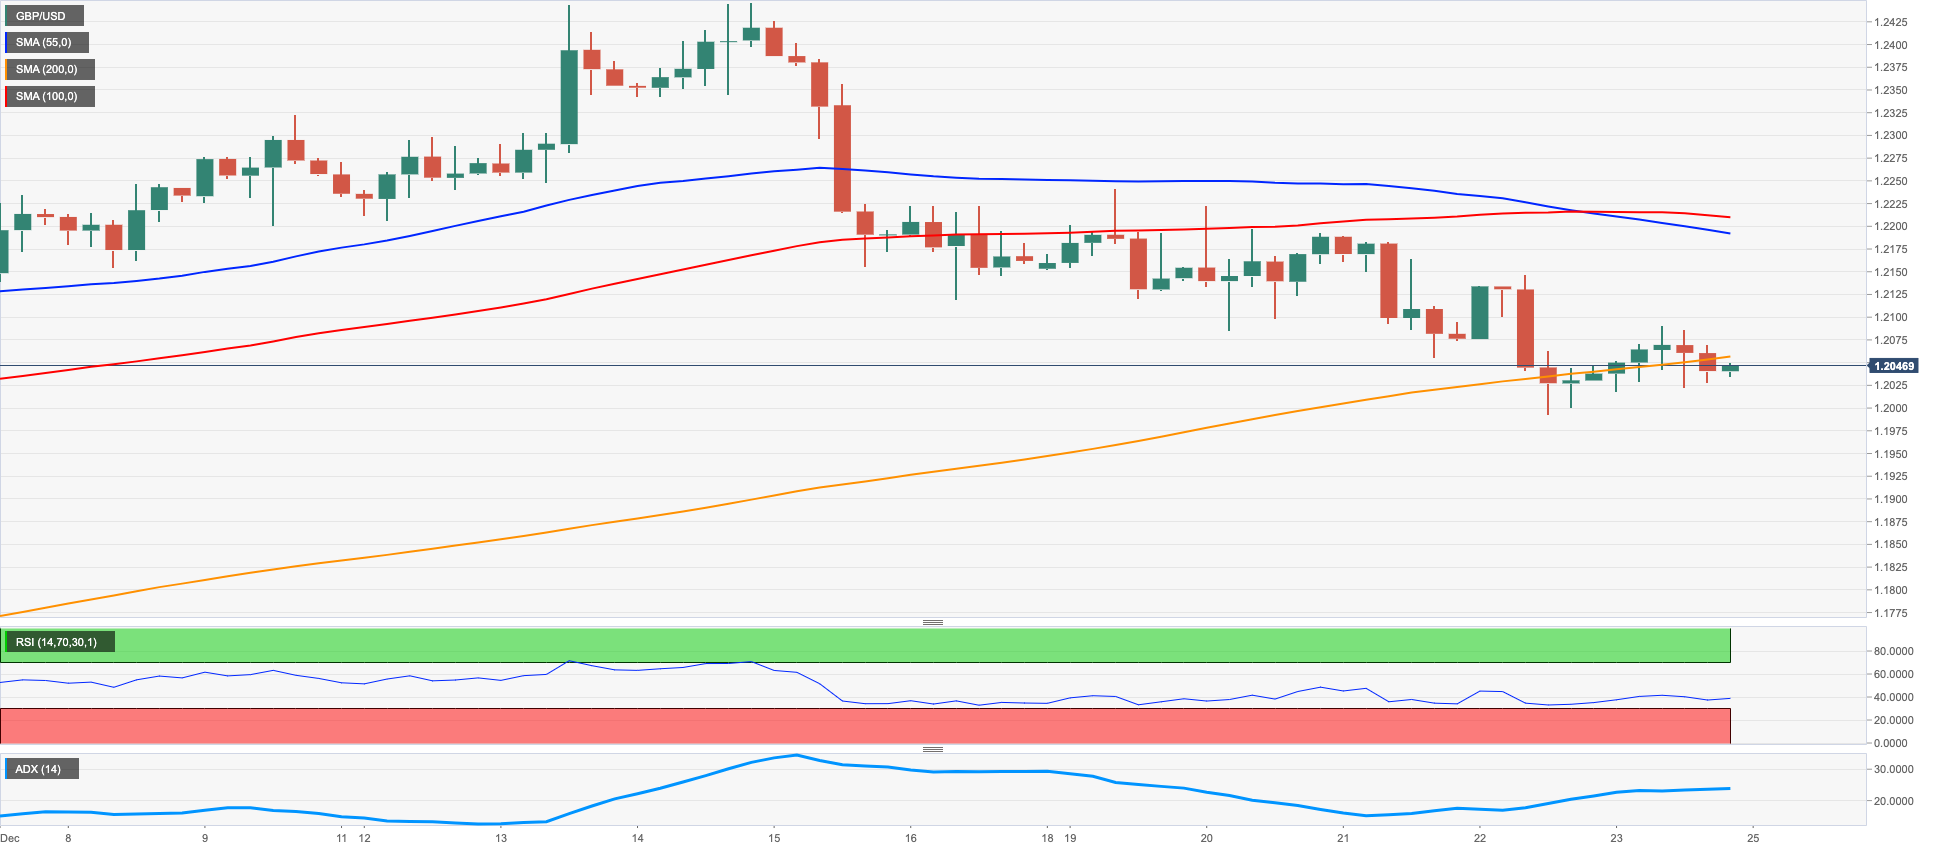
GBP/USD managed to briefly surpass the 1.2100 barrier, although the bullish attempt fizzled out later in the session and the pair returned to the negative ground on Tuesday.
The selling pressure around the greenback opened the door to the continuation of the recovery in Cable during early trade as well as the rest of the risk-linked galaxy in the first half of the week, while the 10-year Gilt yields appeared stable near the 3.65% region.
The next release of note in the UK calendar will be the house prices index measured by Nationwide and due on December 30.
GBP/USD remains under the microscope and could extend the march north to the December peak at 1.2446 (December 14) followed by the May high at 1.2666 (May 27). If cleared, then the pair could challenge the 200-week SMA at 1.2923 prior to the psychological 1.3000 yardstick. In the opposite direction, the next support of note emerges at the weekly low at 1.1900 (November 30) seconded by the provisional 55- and 100-day SMAs at 1.1801 and 1.1669, respectively. The loss of the latter could open the door to a deeper pullback to the November low at 1.1142 (November 4) and the weekly low at 1.1059 (October 21). The daily RSI gathered extra steam and rebounded past 51.
Resistance levels: 1.2112 1.2147 1.2223 (4H chart)
Support levels: 1.1991 1.1900 1.1778 (4H chart)
AUDUSD
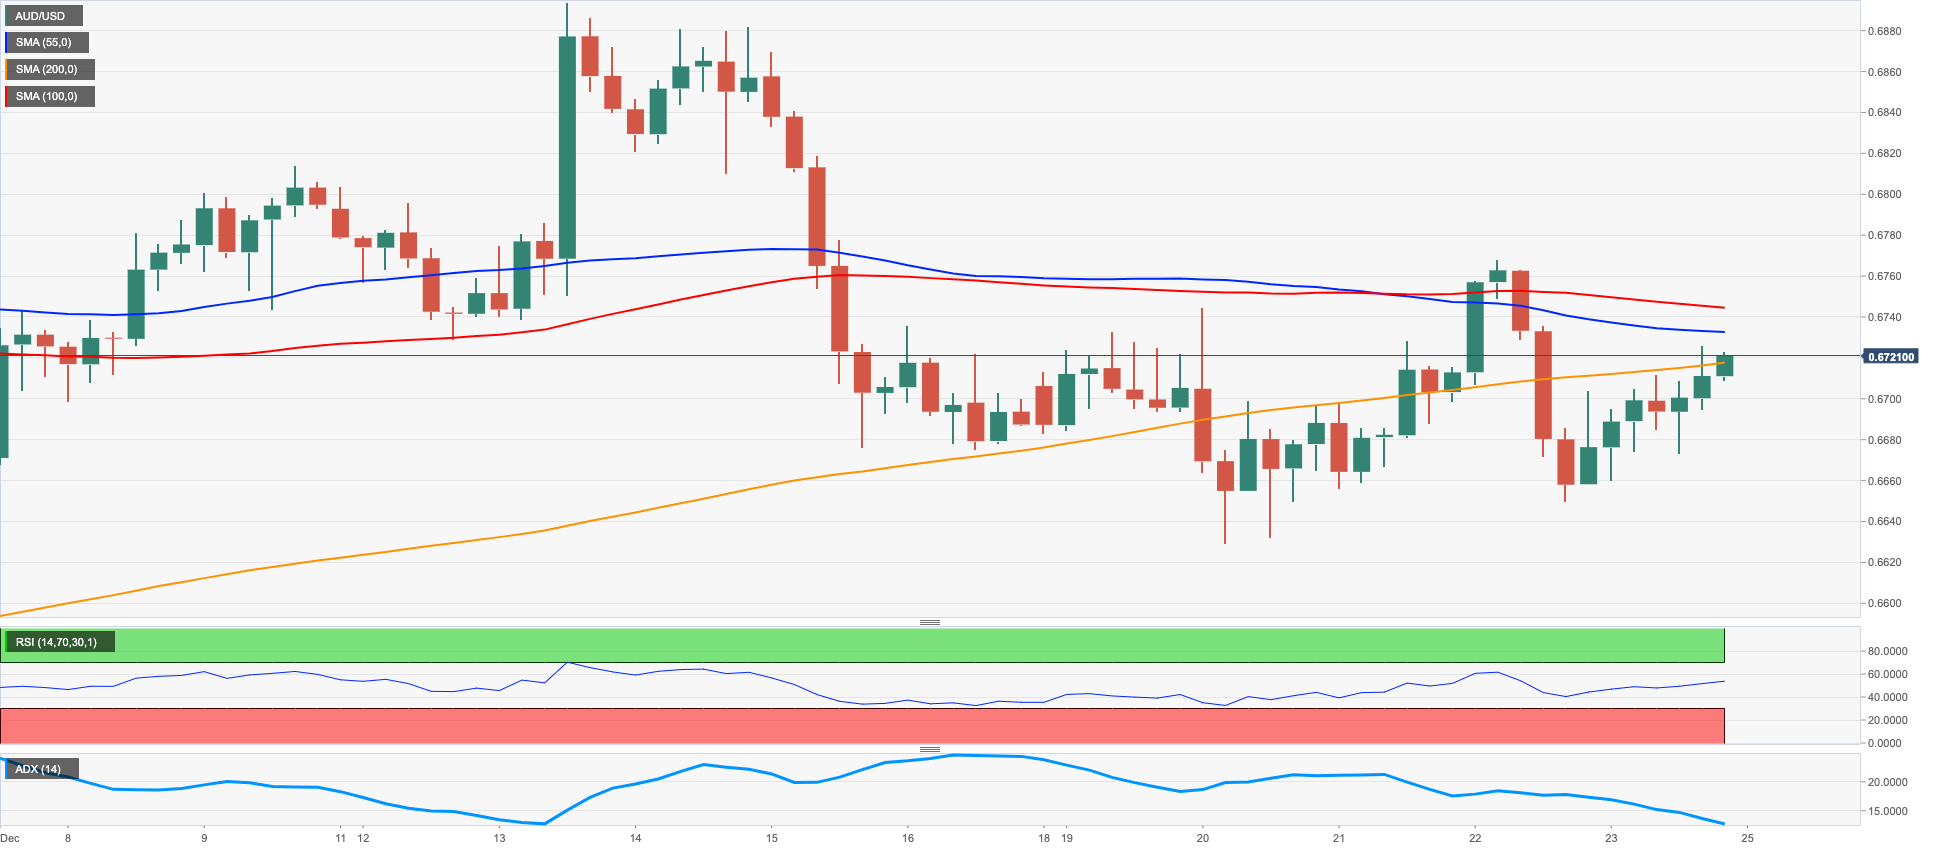
AUD/USD extended its march north and revisited the vicinity of 0.6780, or 2-week tops, on Tuesday.
Indeed, the persistent selling bias in the dollar lent fresh oxygen to the upside momentum in the pair, while positive news from further curbing of COVID restrictions in China also reinforced the bid bias around the Aussie dollar.
AUD also derived extra strength from the firm performance of the commodity space, where both copper prices and the iron ore traded with gains.
The Australian docket was empty on Tuesday.
Extra gains could now see AUD/USD revisiting the key 200-day SMA at 0.6872 ahead of the December high at 0.6893 (December 13) and the September top at 0.6916 (September 13). Up from here should come the psychological 0.7000 hurdle prior to the weekly peak at 0.7008 (August 26). Just the opposite, the December low at 0.6629 (December 20) is expected to offer initial contention ahead of the weekly low at 0.6584 (November 21), which appears underpinned by the 55-day SMA. South from here emerges the weekly low at 0.6386 (November 10) followed by the November low at 0.6272 (November 3). The daily RSI advanced further and surpassed the 55 level.
Resistance levels: 0.6775 0.6893 0.6916 (4H chart)
Support levels: 0.6717 0.6650 0.6629 (4H chart)
GOLD
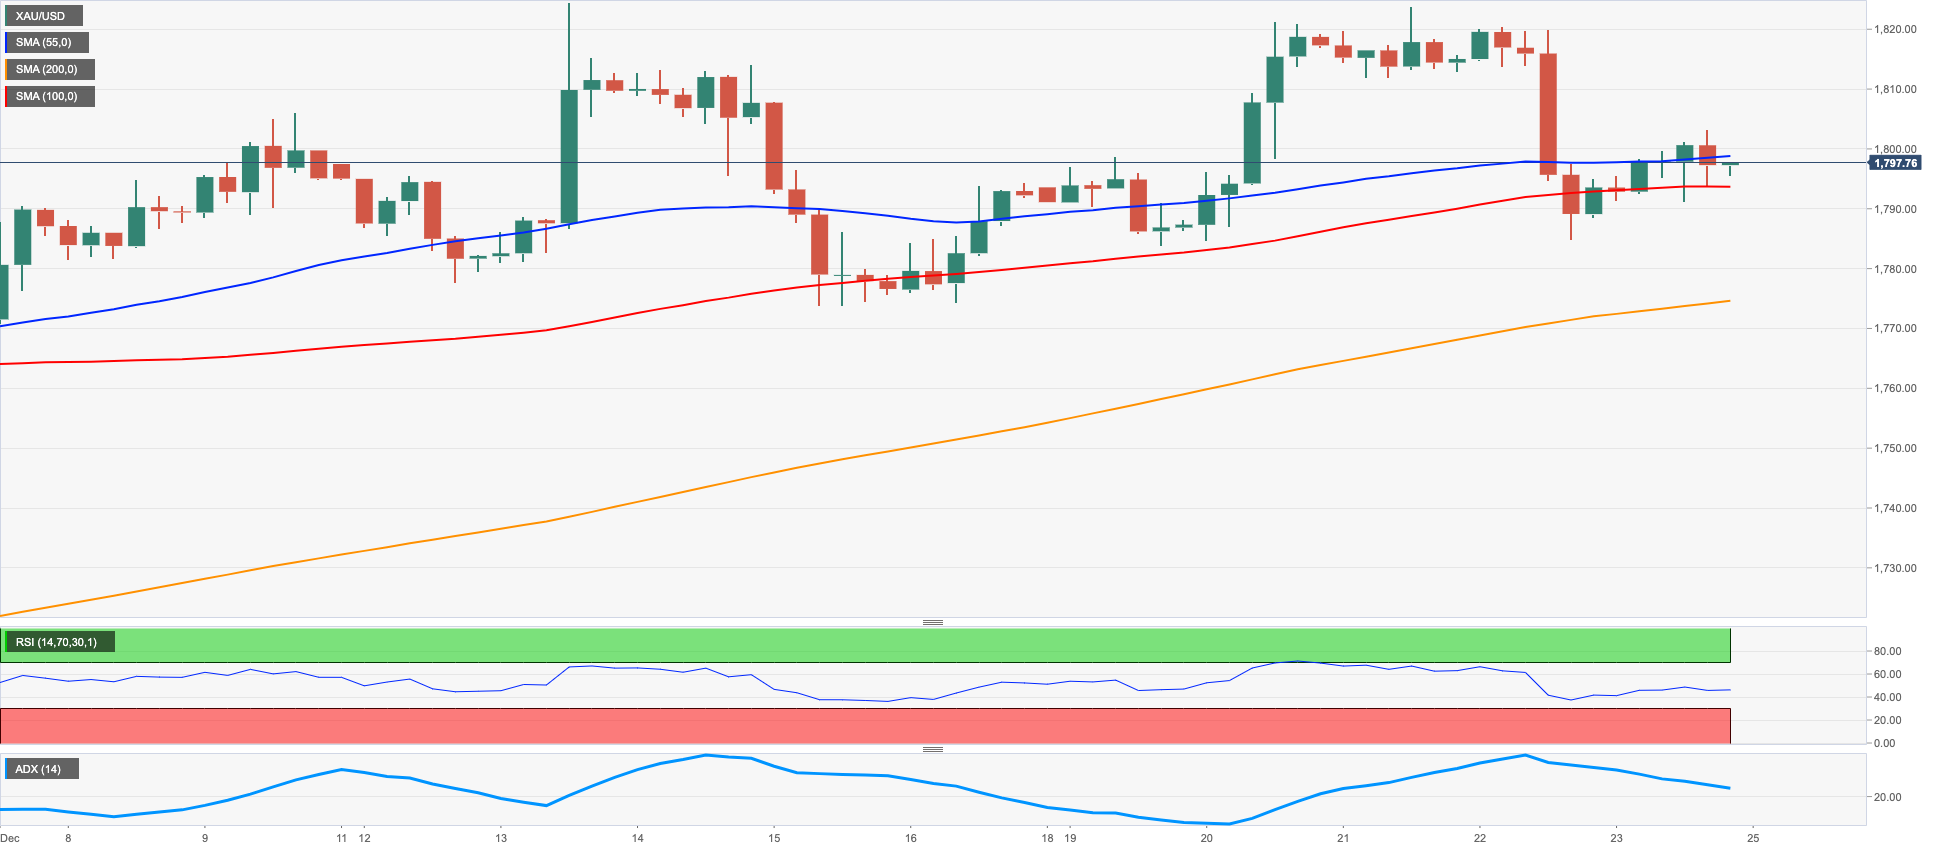
Investors remained sellers of the greenback and this theme supported further the recovery in the precious metal, which managed to reclaim some ground past the critical $1800 mark per ounce troy on Tuesday and clinch fresh monthly tops beyond $1830.
However, the appetite for the riskier assets and the persevering advance in US yields across the curve limited the upside potential of bullion in the first half of the week.
Looking at the broader picture, prospects for further rate hikes by the Federal Reserve along with the ECB intentions to keep its hiking cycle well in place for the time being and the view that the BoJ could exit its ultra-accommodative stance at some point in the next month should keep the yellow metal under scrutiny.
Further upside momentum in gold could now visit the December peak at $1833 (December 27) prior to the June high at $1879 (June 13) and ahead of the May top at $1909 (May 5). On the flip side, the loss of the 200-day SMA at $1783 could pave the way for a move to the weekly low at $1773 (December 15) ahead of the December low at $1765 (December 5) and the weekly low at $1727 (November 23). If gold breaks below this level it could revisit the temporary 100- and 55-day SMAs in the $1720 zone ahead of the 2022 low at $1614 (September 28).
Resistance levels: $1808 $1823 $1833 (4H chart)
Support levels: $1803 $1784 $1772 (4H chart)
CRUDE WTI
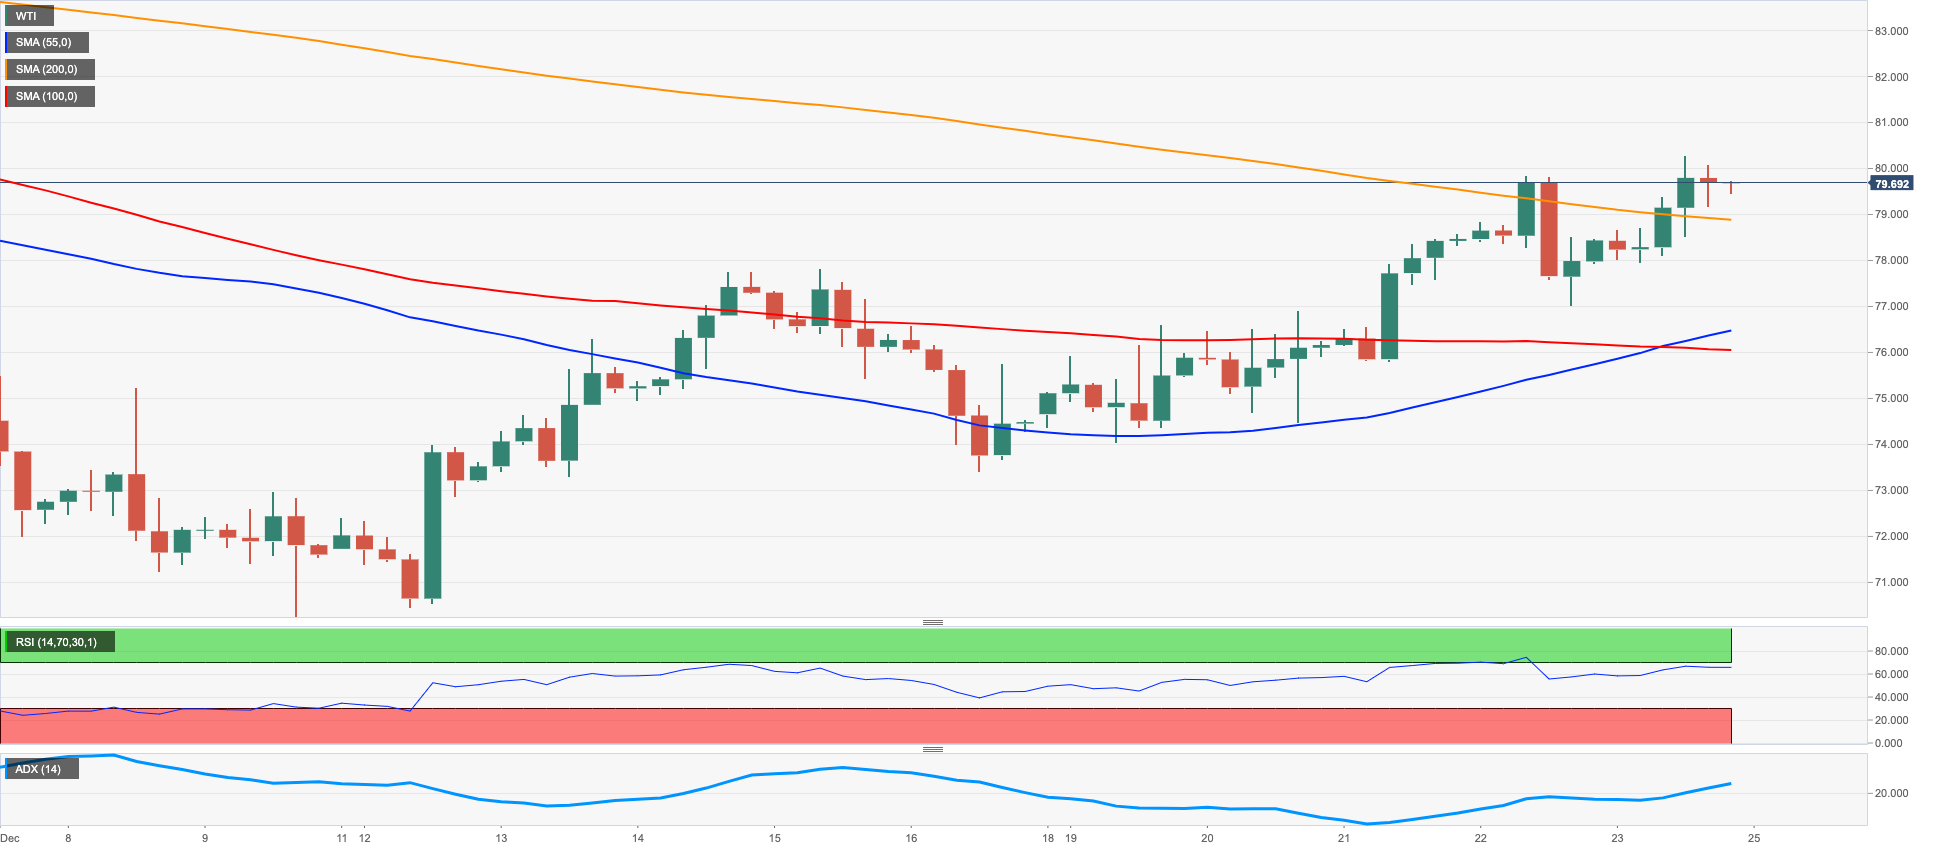
Crude oil prices rose sharply on Tuesday and the barrel of West Texas Intermediate reached its highest level since early December at $81.00.
China’s decision to scrap quarantine rules for inbound travelers from January 8 revived optimism for an improving demand outlook and provided a boost to crude oil prices.
Meanwhile, reports of Russia possibly lowering its crude oil output by 5-7% in early 2023 also helped prices rise. On the same note, Russian President Vladimir Putin signed a decree that bans the supply of oil and oil products to nations that imposed a price cap on Russian oil for five months from February 1 to July 1 of 2023.
On the four-hour chart, WTI’s technical outlook suggests that there could be a technical correction before the next leg higher. The Relative Strength Index (RSI) indicator is about to reach 70 and the price stays near the upper limit of the ascending regression channel that forms strong resistance at around $81.00.
On the upside, WTI could aim for $82.00 (static level) once it confirms $81.00 as support. Above $82.00, static hurdles are located at $82.75 and $83.30.
The mid-point of the ascending channel forms strong support at around $80.00. In case this level fails, an extended slide toward $79.30 (20-period SMA) and $78.75 (lower limit of the ascending channel, 200-period SMA) could be witnessed.
Resistance levels: 81,00 82,00 82,75 (4H chart)
Support levels: 80,00 79,30 78,75 (4H chart)
GER40
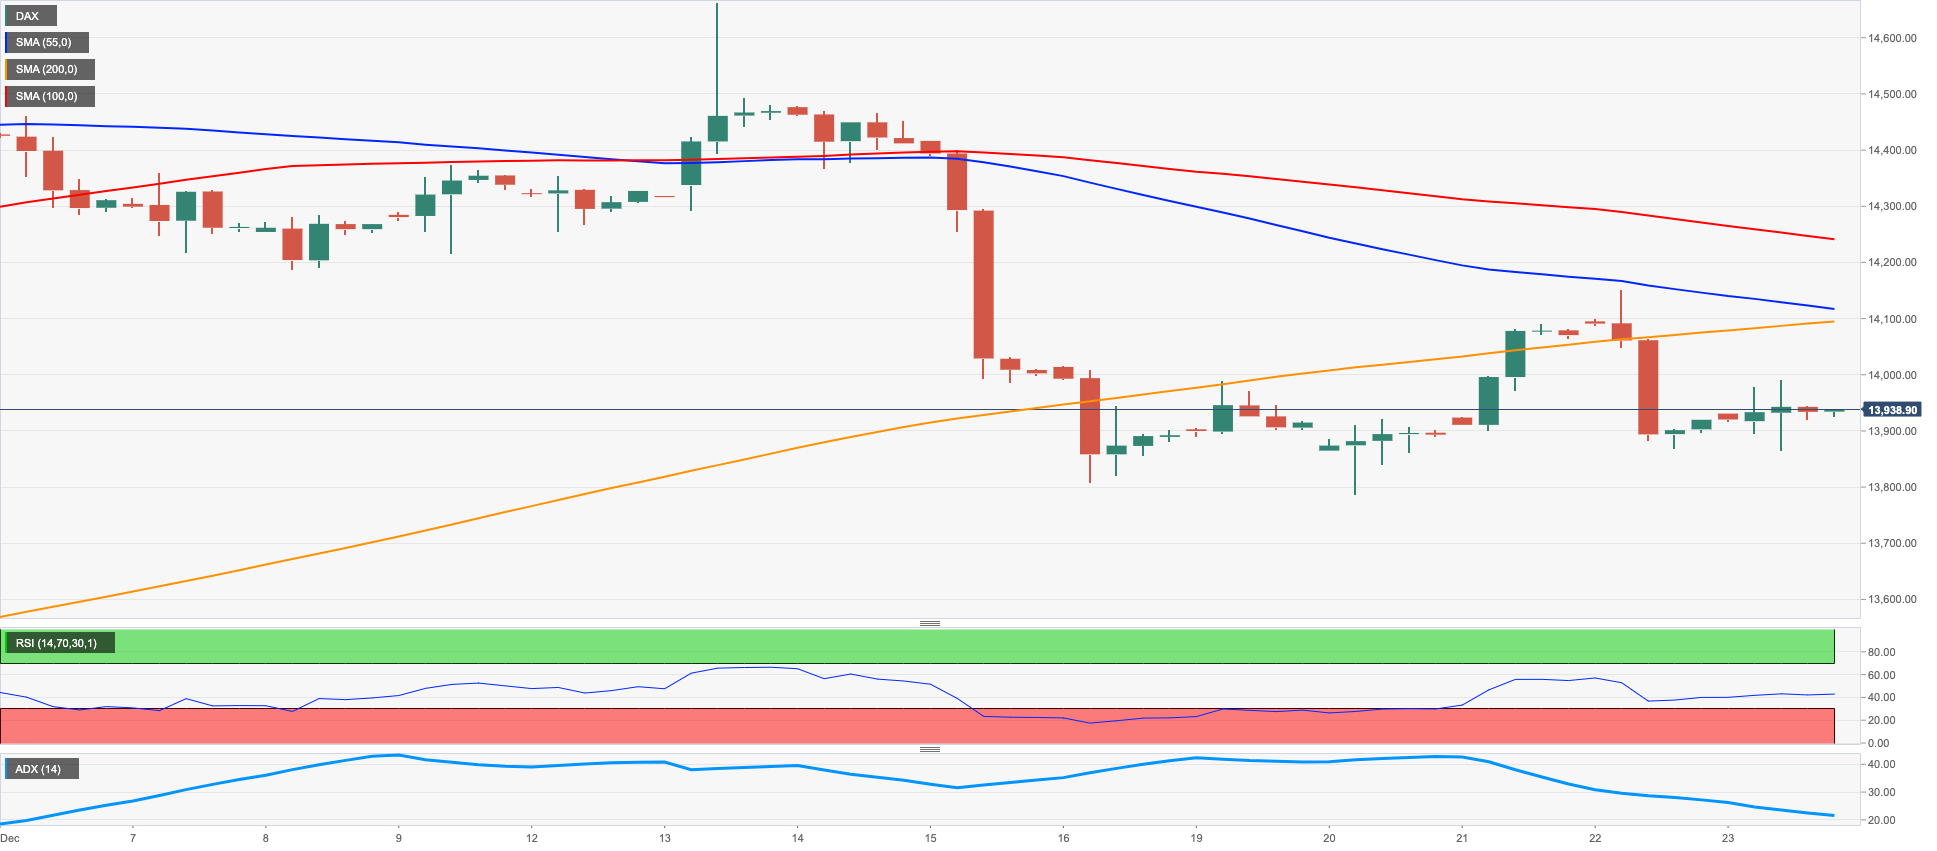
Germany’s DAX 30 Index opened with a bullish gap following the three-day weekend and gained as much as 0.8% before closing modestly higher.
After European Central Bank Governing Council member Klaas Knot told the financial times that the ECB had only just passed the halfway point of its tightening cycle, 10-year German government bond yield gained nearly 5% on the day and reached its highest level since Late October, not allowing the DAX to preserve its bullish momentum.
Thin liquidity conditions between the Christmans and the New Year holidays also seem to be not allowing the index to make steady move in either direction. There won’t be any high-impact macroeconomic data releases from Germany on Wednesday.
The Relative Strength Index (RSI) indicator on the four-hour chart turned flat near 50 after rising above that level earlier in the day, suggesting that buyers remain hesitant to commit to a steady rebound. On a slightly bullish note, the index manages to hold above the 20-period SMA.
On the upside, 14,000 (psychological level, static level) aligns as initial resistance. Once the index starts using that level as support, it could target 14,070 (50-period SMA), 14,100 (200-period SMA) and 14,150 (static level).
Resistance levels: 14,000 14,070 14,100 (4H chart)
Support levels: 13,925 13,860 13,800 (4H chart)
NASDAQ
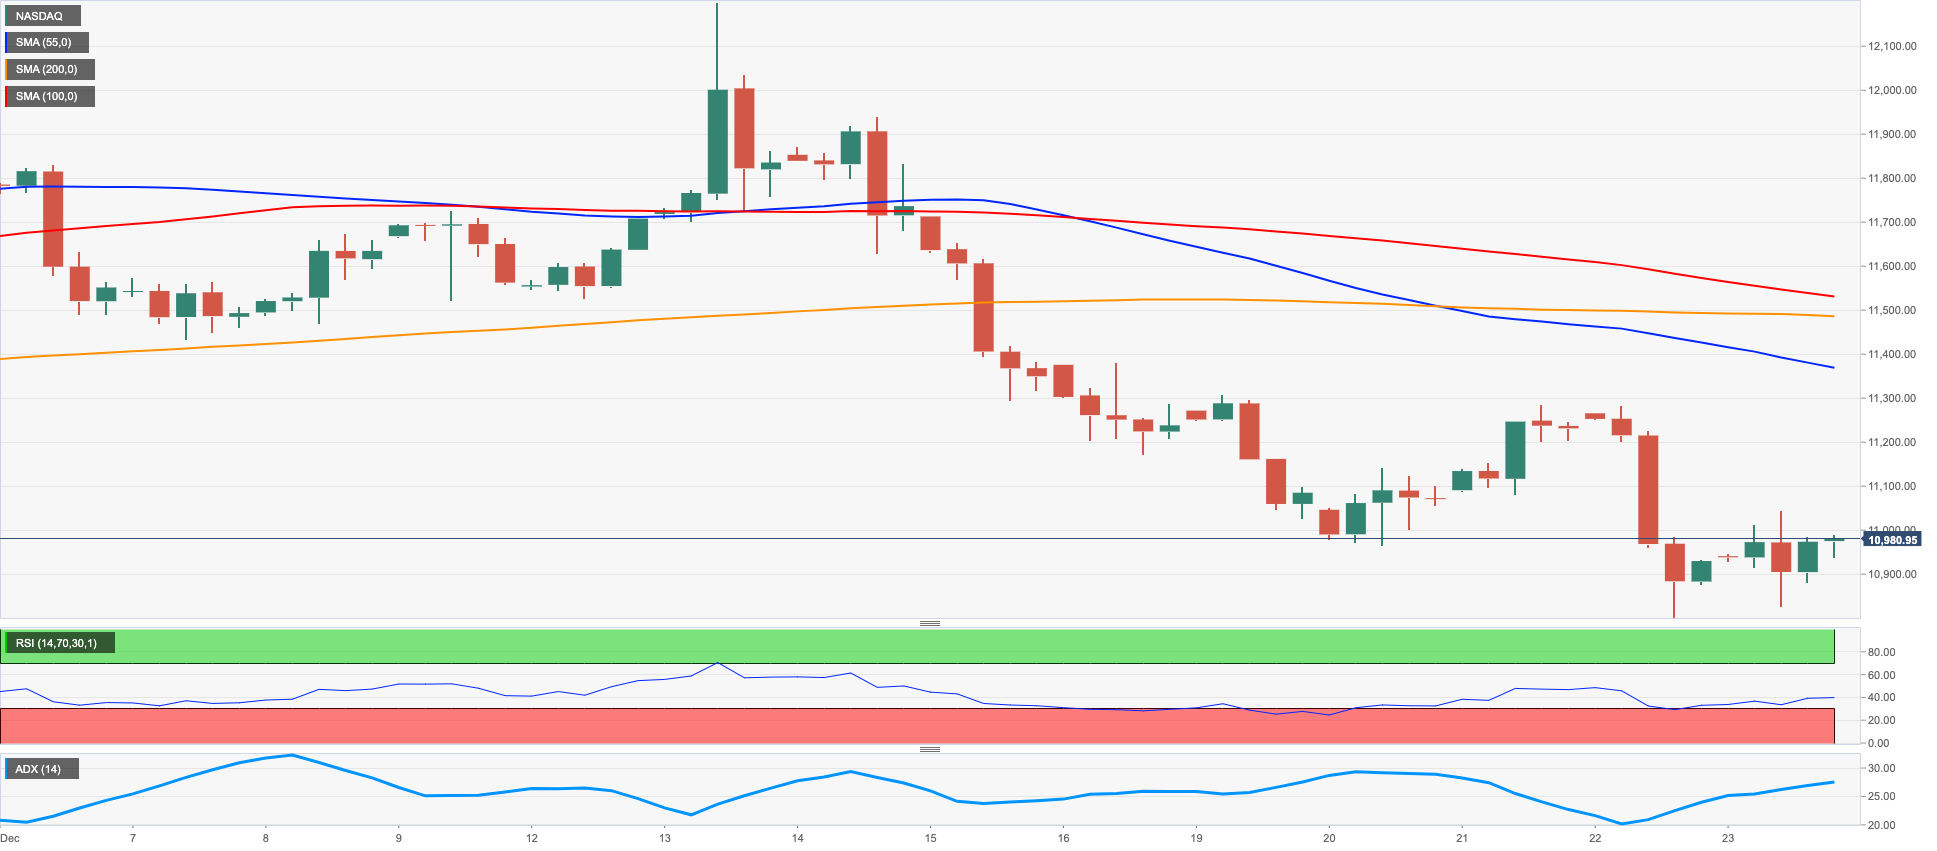
The Nasdaq Composite eased on Tuesday down roughly 100 points at the end of the day hovering at around 10,400. Wall Street traded mixed after market players returned to their desks following a long weekend, with the S&P 500 also trading in the red. Tesla leads the way lower. The share lost over 5% in pre market trading and continued to decline after the opening, down roughly 8% at the time being, accumulating a yearly lost of nearly 70%. The daily slump was triggered by news indicating the company would reduce its production for January at the Shanghai plant.
The breach of the December low at 10313 (December 22) could encourage sellers to revisit the November low at 10262 (November 4) prior to the 2022 low at 10088 (October 13) and the weekly low at 9663 (June 29 2020). Alternatively, the weekly top at 10753 (December 21) should offer initial resistance ahead of the 55- and 100-day SMAs at 10894 and 11345, respectively. Once cleared this region, the Nasdaq Composite could dispute the December peak at 11571 (December 13) before the key 200-day SMA at 11838 and the September high at 12270 (September 12). The daily RSI advanced marginally to the 39 zone.
Resistance levels: 10,753 11,352 11,399 (4H chart)
Support levels: 10,313 10,262 10,088 (4H chart)
DOW JONES
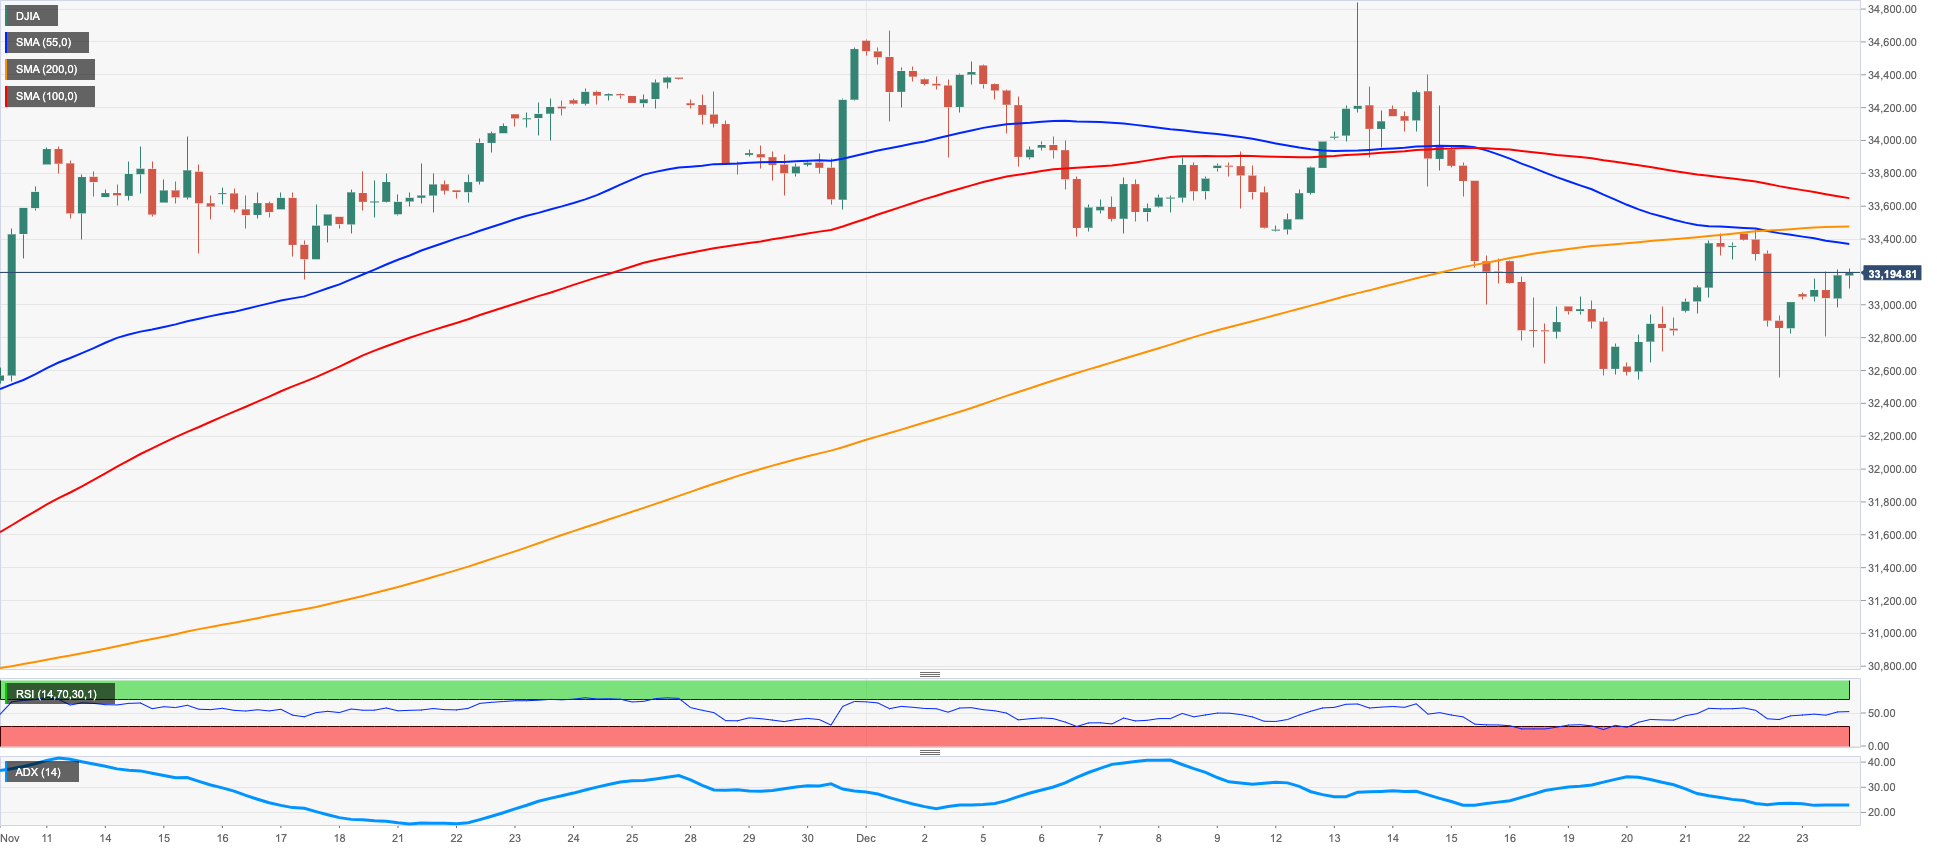
The Dow Jones Industrial Average is up after closing on Friday at 33,203.03. News from China lifted the mood ahead of the opening as the country upwardly revised its 2021 GDP estimate to 8.4% from 8.1%. Also, the government continues to ease covid-related restrictions, which will mitigate the negative impact limitations had on the economy. Finally, the China Immigration Administration announced it would resume issuing visas for mainland citizens travelling abroad.
Shares of China-based companies that trade in the US were up in premarket trading. However, shares of NIO started the day roughly 6.5% down after cutting its fourth-quarter delivery forecast, reporting supply-chain issues due to the latest Coronavirus outbreak in the Asian giant.
As the session unwound, the DJIA was the only index to trade in the green, with its counterparts posting modest losses. Heading into the Asian opening, the DJIA retains most of its intraday gains.
DJIA extends its recovery but remains far from bullish, developing below a bearish 20-day SMA at around 33,652. The longer moving averages stand far below the current level, although directionless and running parallel, reflecting limited buying strength. At the same time, technical indicators advance but remain within negative levels, in line with the absence of upward momentum. The daily high at 33,481 provides resistance ahead of the November 14 low at 33,569, followed by the mentioned SMA.
The near-term picture is neutral, with the index trading below its 100 and 200 SMAs in the 4-hour chart and technical indicators pivoting around their midlines. Friday’s high at 33,275 is the immediate support level to watch, followed by Tuesday’s low at 33,111. Once below the latter, the decline could extend towards the 32,900 price zone, particularly if the psychological 33,000 threshold gives up.
Resistance levels: 33,481 33,569 33,652 (4H chart)
Support levels: 33,275 33,111 33,010 (4H chart)
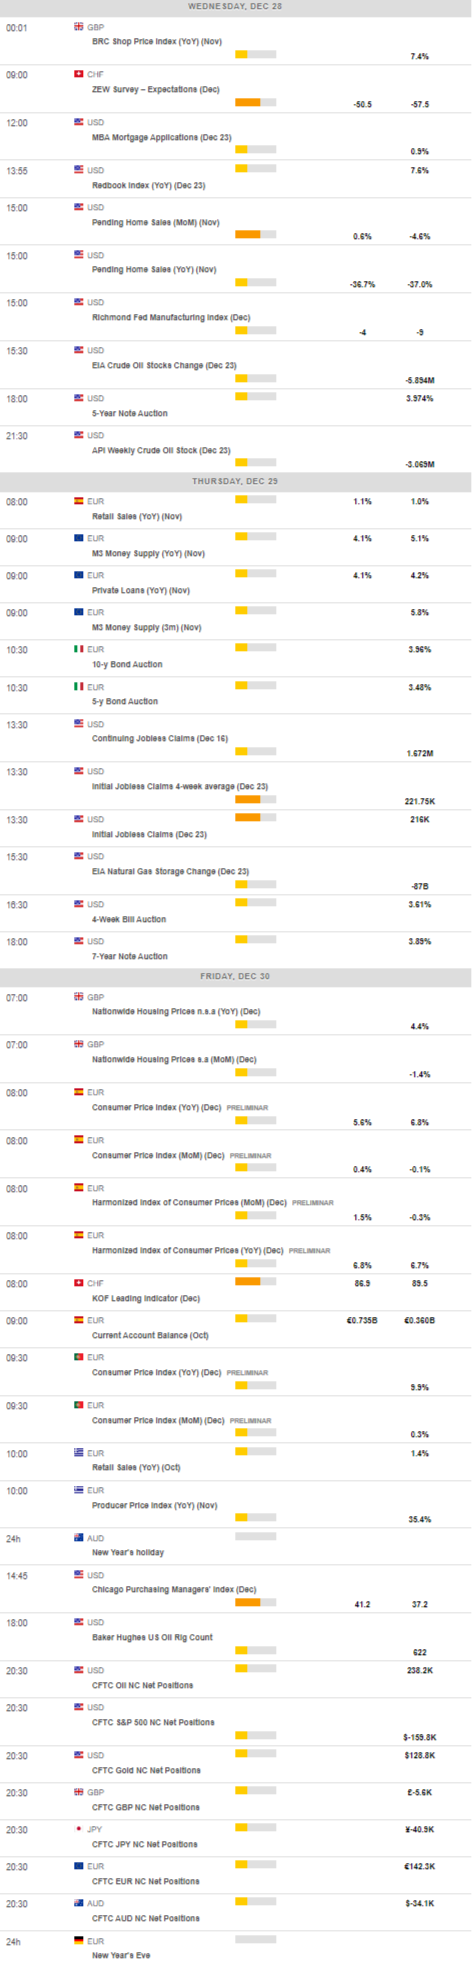
MACROECONOMIC EVENTS
All Information & Updates provided by:

All information relating to the financial markets available on this page has been prepared and issued by FXStreet (Forexstreet SL, Spain, Reg: B62498233) on the basis of publicly available information and all information believed to be reliable and does not conflict with Kuwaiti local laws, and all necessary care has been taken to before the company to ensure that the facts mentioned are correct from the source.
NCM Investment nor any of its directors or employees shall in any way be held responsible for the contents of this news, and the information contained on this page is intended only to provide clients with publicly available information and should not be construed as investment advice, report or analysis and/or constitute an offer or invitation to buy or sell financial instruments of any kind.
RISK WARNING: Forex and CFDs are highly risky leveraged products, as losses can exceed deposits. Please ensure you understand all the risks and take independent advice if necessary. NCM will segregate the clients based on the criteria of the regulator and its bylaws. NCM does not provide any advisory service; the material published does not constitute advice or a recommendation for a transaction in any financial instrument. NCM accepts no responsibility for any use of the content presented and any consequences of that use. Anyone acting on the information provided does so at their own risk.