
- Contact Us:
-

-

-

-


Daily Market Updates
29 Dec 2022
USDJPY
USD/JPY clinched the fourth consecutive daily advance, surpassing 134.00 the figure and printing at the same time new multi-session highs.
The prevailing strength around the greenback coupled with the mixed tone in US yields across the curve were sufficient to sponsor another positive session in the pair and thus extend the uptrend for yet another session on Wednesday.
In the meantime, the 10-year JGB yields eased to the 0.45% region, keeping the trade near recent peaks around the 0.50% region (the new upper band of the YCC).
In the Japanese docket, preliminary figures showed the Industrial Production is expected to have contracted at an annualized 1.3% in November and 0.1% from a month earlier.
If USD/JPY leaves behind key 200-day SMA at 136.10 it could then open the door to a probable move to weekly peaks at 138.17 (December 15) and 139.89 (November 30) ahead of the round level at 140.00 ahead and the provisional 55- and 100-day SMAs at 141.00 and 141.11, respectively, seconded by the weekly high at 142.25 (November 21). Just the opposite, the big magnet for bears emerges at the December low at 130.56 (December 20) followed by the August low at 130.39 (August 2) and the key round level at 130.00. The daily RSI improved further and broke above 42.
Resistance levels: 134.40 137.47 138.17 (4H chart)
Support levels: 132.30 131.63 130.56 (4H chart)
-638078523304062286.png)
GBPUSD
GBP/USD faded Tuesday’s pullback and posted decent gains around the 1.2030 zone despite the daily uptick in the buck midweek.
Cable, however, could not sustain the move further north of the 1.2100 mark earlier in the session, as the recovery in the dollar forced the pair to give away part of those gains eventually.
In the UK debt markets, the 10-year Gilt yields returned to the 3.65% area following an earlier advance to fresh peaks past 3.75%.
No data releases were scheduled in the UK calendar on Wednesday, leaving all the attention to the Nationwide House Price Index due on December 30.
Further recovery in GBP/USD initially targets the December high at 1.2446 (December 14). If bulls push harder, then the next hurdle of note should appear at the May top at 1.2666 (May 27) prior to the 200-week SMA at 1.2923 and ahead of the psychological 1.3000 mark. On the other hand, the weekly low at 1.1900 (November 30) is seen offering decent support before the provisional 55- and 100-day SMAs at 1.1817 and 1.16672, respectively. Further losses from here could pave the way for another test of the November low at 1.1142 (November 4) and the weekly low at 1.1059 (October 21). The daily RSI picked up pace and approached 49.
Resistance levels: 1.2125 1.2147 1.2223 (4H chart)
Support levels: 1.1991 1.1900 1.1778 (4H chart)
-638078522648810416.png)
AUDUSD
The march north in AUD/USD remained unabated on Wednesday, this time briefly surpassing the key 0.6800 barrier, although shedding some ground soon afterwards.
Decent gains in the dollar did not prevent the pair to clinch the fourth day in a row with gains despite the mixed performance in the commodity complex. On the latter, copper prices ended the session in the negative territory, while the iron ore advanced marginally past the $111.00 mark per tonne.
The continuation of the upside bias in the Aussie dollar was also propped up by the idea of further reopening of economic activity in China.
There were no results data wise Down Under midweek.
The continuation of the upside momentum in AUD/USD could put the key 200-day SMA at 0.6868 to the test prior to the December top at 0.6893 (December 13) and the September peak at 0.6916 (September 13). Next on the upside aligns the psychological 0.7000 yardstick ahead of the weekly high at 0.7008 (August 26). In the opposite direction, the December low at 0.6629 (December 20) should hold the initial test closely followed by weekly lows at 0.6584 (November 21) and 0.6386 (November 10) and before the November low at 0.6272 (November 3). The daily RSI managed to pick up pace and poke with 54.
Resistance levels: 0.6801 0.6893 0.6916 (4H chart)
Support levels: 0.6727 0.6719 0.6650 (4H chart)
-638078523807725149.png)
GOLD
The late advance in the greenback in combination with higher US yields in the medium and long end of the curve triggered a corrective downside in prices of the ounce troy of gold on Wednesday.
Indeed, bullion gave away part of Tuesday’s move to fresh 6-month tops past $1830 in response to some profit taking mood, the firm dollar and rising yields.
There are no changes to the macro scenario for the yellow metal, which is expected to remain dominated by prospects for further tightening by both the Federal Reserve and the ECB along with other major central banks.
The December high at $1833 (December 27) now appears as the initial up barrier for gold bulls ahead of the June top at $1879 (June 13) and the May peak at $1909 (May 5). On the contrary, bullion could see its losses accelerate on a breach of the 200-day SMA at $1783. South of the latter appears the weekly low at $1773 (December 15) before the December low at $1765 (December 5) and the 55-day SMA at $1732, which precedes the weekly low at $1727 (November 23) and the 100-day SMA at $1722, all ahead of prior to the 2022 low at $1614 (September 28).
Resistance levels: $1833 $1847 $1857 (4H chart)
Support levels: $1809 $1784 $1772 (4H chart)
-638078524317285956.png)
CRUDE WTI
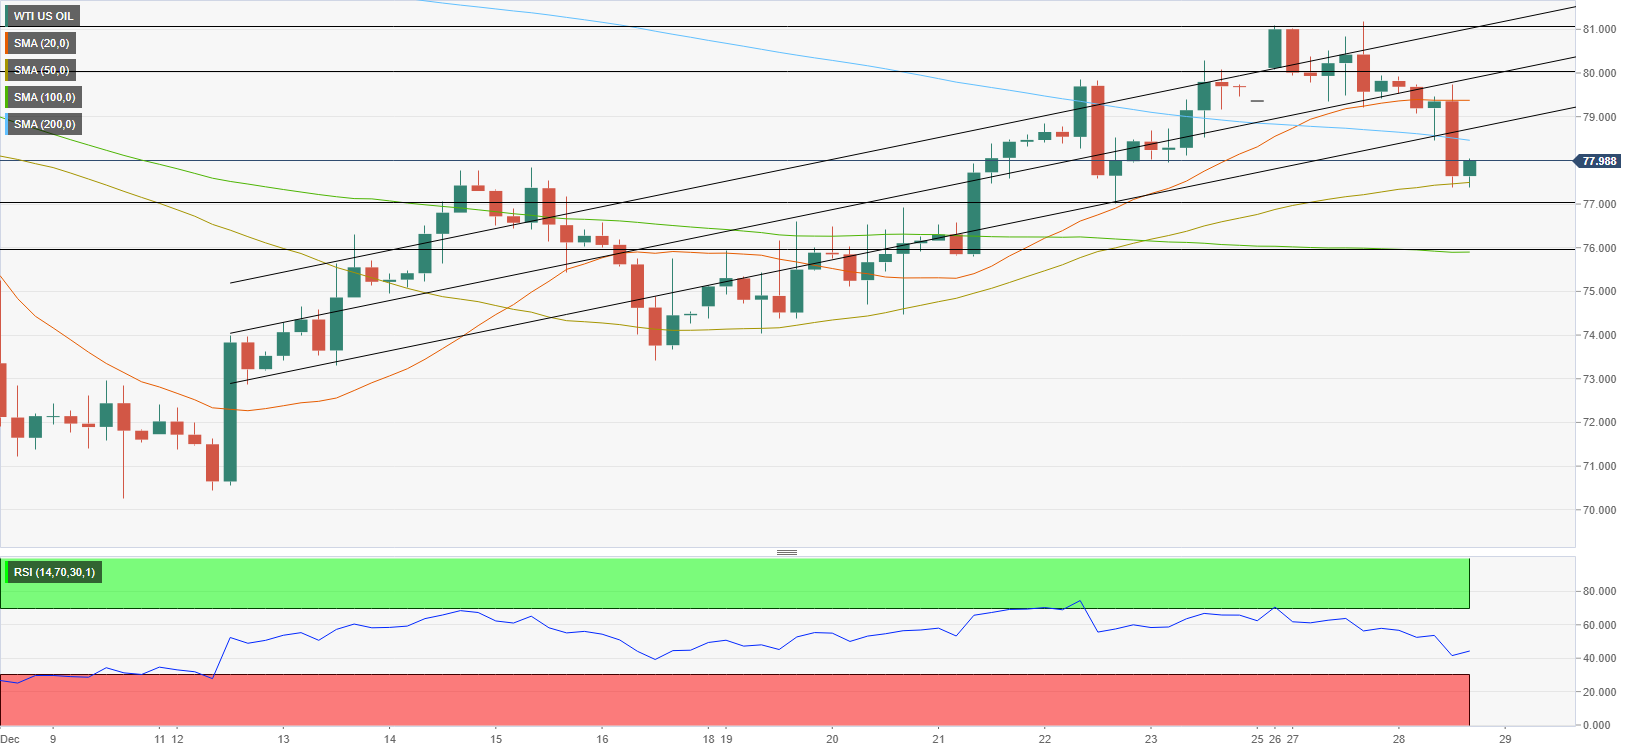
Following Tuesday’s increase, crude oil prices suffered heavy losses on Wednesday amid risk aversion during the American trading hours. The barrel of West Texas Intermediate (WTI) fell nearly 3% and declined below $78 in the second half of the day.
Hong Kong announced earlier in the day that they will scrap quarantine obligations on close contacts of positive coronavirus cases and added that international travellers arriving in the country will no longer be required to do a mandatory PCR test.
Although reopening efforts by China provided a boost to crude oil prices in hopes of an improving demand outlook on Tuesday, investors remain cautious on reports suggesting that the healthcare system is under pressure amid a rapidly rising number of patients. Moreover, the US is reportedly considering imposing new restrictions on travellers from China.
On Thursday, the US Energy Information Administration will release its weekly crude oil stock report.
On the four-hour chart, WTI’s technical outlook points to a bearish tilt with the Relative Strength Index (RSI) indicator falling below 50. Additionally, WTI broke below the ascending regression channel and the 200-period SMA, confirming the buildup of bearish pressure.
On the downside, $77.50 (50-period SMA) aligns as interim support ahead of $77.00 (psychological level, static level) and $76.00 (100-period SMA).suggests that there could be a technical correction before the next leg higher.
In case WTI manages to reclaim the 200-period SMA and returns within the ascending channel by rising above $78.60. It could attract buyers and recover toward $79.40 (20-period SMA) and $80.00 (psychological level, mid-point of the ascending channel).
Resistance levels: 78.60 79.40 80.00 (4H chart)
Support levels: 77.50 77.00 76.00 (4H chart)
GER40
Germany’s DAX 30 Index failed to build on Tuesday gains and registered modest losses on Wednesday, closing slightly below 14,000. The negative shift witnessed in risk mood amd growing concerns over the coronavirus situation in China didn’t allow European equity indexes to gain traction mid-week.
A spokesperson for the German economy ministry said on Tuesday that Russia’s decree that bans exports of crude oil and crude oil products to countries abiding by the Western price cap had no “practical significance” for the German economy.
Meanwhile, the yield on the 10-year German government bond stayed quiet near 2.5% throughout the day after having gained nearly 5% on Tuesday, allowing the DAX Index to stay in a consolidation phase.
The Relative Strength Index (RSI) indicator on the four-hour declined to 40 after moving sideways near 50 on Tuesday. Moreover, the index dropped below the 20-period SMA after having managed to hold above that level on Tuesday.
On the downside, first static support is located at 13,850. If that level is broken, DAX could continue to push lower toward 13,800 (static level) and 13,700 (former resistance from October, static level).
14,000 (psychological level, static level) aligns as initial resistance. Once the index starts using that level as support, it could target 14,050 (50-period SMA), 14,100 (static level) and 14,130 (200-period SMA).
Resistance levels: 14,000 14,050 14,100 (4H chart)
Support levels: 13,850 13,800 13,700 (4H chart)
-638078526686672804.png)
NASDAQ
The Nasdaq100 maintained the red on Wednesday, falling below the 10,800 mark for the first time since early November. The tech-related index recovered some ground ahead of the close, settling at around 10,800. Nevertheless, the souring market mood kept stocks under pressure, and the index developing not far from the multi-year low posted in October at 10,483.88.
Tesla Inc stands among the worst performers losing 3% and down ten out of the last eleven trading days. NIO is also down, while AMC Entertainment also shed 3% as the company CEO asked the company's board to freeze executives' 2023 payments to forgo salary bumps. On the other side, Generac is among the best performers, adding 5% amid a potential buyer of the company.
Technical readings in the daily chart indicate that bears remain in control. A break through the daily low at 10,771.88 could encourage sellers to test the 10,700 threshold en route to the mentioned multi-year low. In the said time frame, the index develops far below bearish moving averages, with the 20 SMA gaining downward traction at around 11,487.
The near-picture shows that a bearish 20 SMA in the 4-hour chart attracts selling interest, holding a handful of pips above the daily high at 11,005.60. Technical indicators' strong bearish momentum within negative levels points to a downward extension ahead of the year-end.
Resistance levels: 10,890 11,005 11,160 (4H chart)
Support levels: 10,773 10,700 10,620 (4H chart)
-638078527253570553.png)
DOW JONES
Wall Street changed course on Wednesday, with the three major indexes trimming Tuesday's gains. In the absence of other catalysts, investors maintained the focus on China. The local government kept announcing easing covid-related restrictions, shifting the focus to boosting economic growth. Initially, the news was welcomed by market players, but later it spurred concerns about the potential effects on inflation.
As the year-end approaches, global stock markets are set to post their worst yearly drop since 2008. The Dow Jones Industrial Average shed roughly 200 points intraday, turning negative for the week, but recovered some ground ahead of the close and currently stands above 33,100.
The DJIA has made little progress. It develops below a bearish 20-day SMA, providing strong static resistance at around 33,609. Meanwhile, the longer moving averages keep heading nowhere below the current level. Finally, technical indicators remain below their midlines, gaining bearish traction, although not enough to suggest a steeper decline.
The near-term picture is bearish, as the index trades below all of its moving averages in the 4-hour chart. Technical indicators have turned firmly lower and are currently crossing their midlines into negative territory and pivoting around their midlines. Friday's high at 33,275 has become a relevant resistance to watch. The critical 33,000 threshold provides support with a slide below it, opening the door for a retest of 32,535.98, the December 12 intraday low.
Resistance levels: 33,275 33,400.00 33,535.98 (4H chart)
Support levels: 33,010 32,880.10 32,765.90 (4H chart)
-638078525960549429.png)
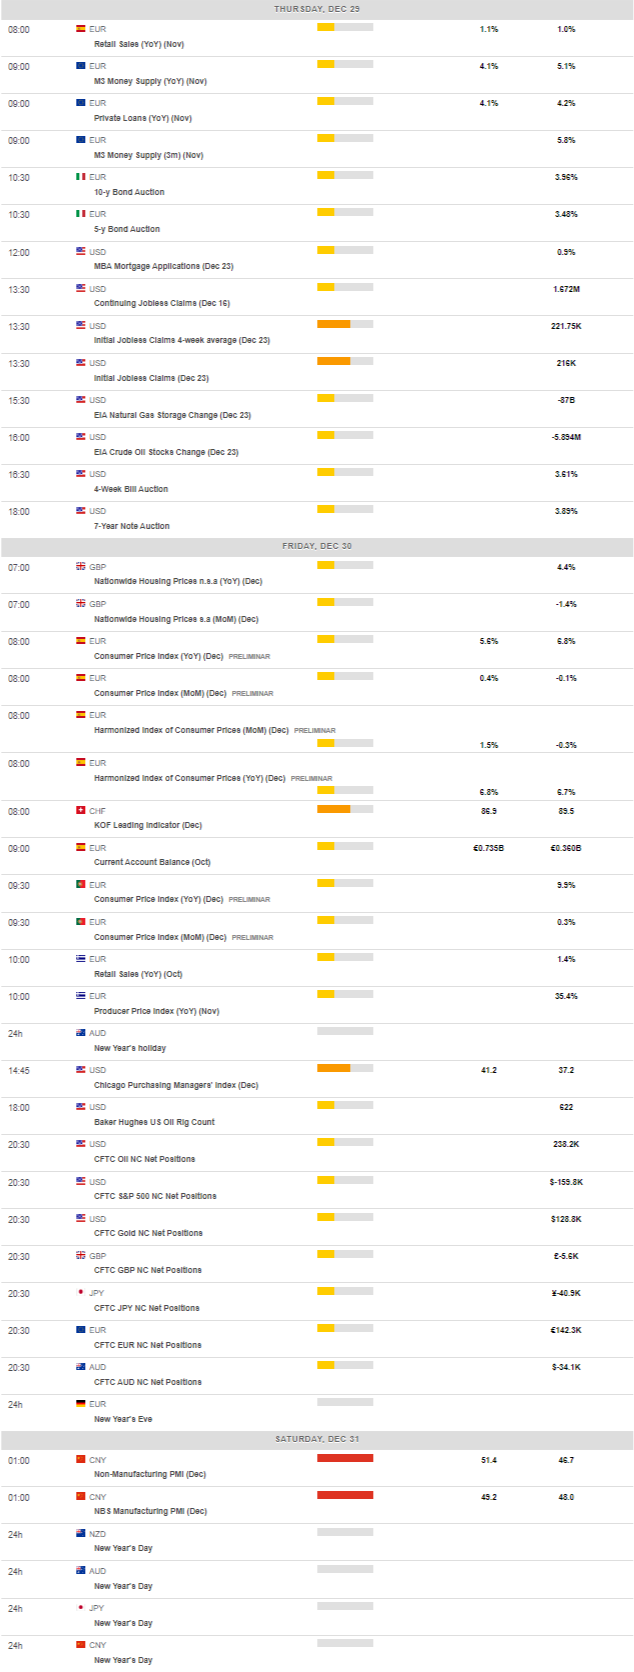
MACROECONOMIC EVENTS
All Information & Updates provided by:

All information relating to the financial markets available on this page has been prepared and issued by FXStreet (Forexstreet SL, Spain, Reg: B62498233) on the basis of publicly available information and all information believed to be reliable and does not conflict with Kuwaiti local laws, and all necessary care has been taken to before the company to ensure that the facts mentioned are correct from the source.
NCM Investment nor any of its directors or employees shall in any way be held responsible for the contents of this news, and the information contained on this page is intended only to provide clients with publicly available information and should not be construed as investment advice, report or analysis and/or constitute an offer or invitation to buy or sell financial instruments of any kind.
RISK WARNING: Forex and CFDs are highly risky leveraged products, as losses can exceed deposits. Please ensure you understand all the risks and take independent advice if necessary. NCM will segregate the clients based on the criteria of the regulator and its bylaws. NCM does not provide any advisory service; the material published does not constitute advice or a recommendation for a transaction in any financial instrument. NCM accepts no responsibility for any use of the content presented and any consequences of that use. Anyone acting on the information provided does so at their own risk.