
- Contact Us:
-

-

-

-


Daily Market Updates
30 Dec 2022
USDJPY
USD/JPY gave away part of the weekly advance and retreated sharply to 2-day lows in the sub-133.00 region on Thursday.
In fact, the pair seems to have run out of steam after failing once again to trespass weekly highs in the 134.50 region, coming all the way down to re-enter into the negative territory in line with the fresh weakness in the dollar and the decline in the US 10-year yields.
Meanwhile, the 10-year JGB yields looked stable in the 0.45% region, as the effects of the latest BoJ event continued to dissipate.
There were no results in the Japanese calendar on Thursday.
USD/JPY faces strong resistance at the weekly peak at 134.50 (December 28). The breakout of the latter could put a test of the key 200-day SMA at 136.16 back on the investors’ radar ahead of weekly highs at 138.17 (December 15) and 139.89 (November 30). Further north turns up the round level at 140.00 prior to the interim 55- and 100-day SMAs at 140.75 and 141.11, respectively, before the weekly top at 142.25 (November 21). On the other hand, there are no support levels of note until the December low at 130.56 (December 20) prior to the August low at 130.39 (August 2) and the key round level at 130.00. The daily RSI ticked lower and revisited the 39 region.
Resistance levels: 134.50 136.78 137.47 (4H chart)
Support levels: 132.90 132.30 131.63 (4H chart)
-638079376330666805.png)
GBPUSD
GBP/USD traded with gains for the second session in a row on Thursday, this time revisiting the 1.2080 region amidst the renewed offered bias around the US dollar.
Indeed, the dollar gave away Wednesday’s advance and allowed some recovery in the risk complex, while Cable has been well supported by the 1.2000 neighbourhood so far this week.
In the UK debt markets, the 10-year Gilt yields remained within the ongoing consolidative phase around 3.65%.
The next data release in the UK docket will be on December 30, where the Nationwide House Price Index is due.
GBP/USD faces a minor up barrier at the weekly high at 1.2241 (December 19) ahead of the December top at 1.2446 (December 14) and the May peak at 1.2666 (May 27). Up from here turns up the 200-week SMA at 1.2923 prior to the psychological 1.3000 yardstick. By contrast, there is decent contention at the weekly low at 1.1900 (November 30) before the temporary 55- and 100-day SMAs at 1.1831 and 1.1665, respectively. The loss of the latter could pave the way for a visit to the November low at 1.1142 (November 4) and the weekly low at 1.1059 (October 21). The daily RSI rebounded to the 51 region.
Resistance levels: 1.2087 1.2126 1.2223 (4H chart)
Support levels: 1.2000 1.1991 1.1900 (4H chart)
-638079375973980003.png)
AUDUSD
The upside momentum in AUD/USD remained well in place for the fifth consecutive session on Thursday, this time trading at shouting distance from the area of weekly tops just past 0.6800 the figure (December 28).
Another negative session in the greenback lent extra legs to the bid bias in the Aussie dollar and the rest of the risk-linked assets, while the mixed tone in the commodity universe also appeared to have bolstered the daily uptick in spot.
The continuation of the Chinese reopening has been also collaborating with the firm performance of the Australian currency in the past couple of weeks.
AUD also derived extra strength from the firm performance of the commodity space, where both copper prices and the iron ore traded with gains.
The was no news from the Australian calendar on Thursday.
If AUD/USD manages to leave behind the weekly top at 0.6801 (December 28), it could then challenge the key 200-day SMA at 0.6864 ahead of the December peak at 0.6893 (December 13) and the September high at 0.6916 (September 13). Extra gains should target the psychological 0.7000 mark prior to the weekly top at 0.7008 (August 26). Just the opposite, sellers are expected to meet the initial obstacle at the December low at 0.6629 (December 20) before weekly lows at 0.6584 (November 21) and 0.6386 (November 10). Down from here aligns the November low at 0.6272 (November 3). The daily RSI gathered further pace and surpassed the 56 level.
Resistance levels: 0.6785 0.6893 0.6916 (4H chart)
Support levels: 0.6710 0.6650 0.6629 (4H chart)
-638079376685664172.png)
GOLD
Prices of the ounce troy of the yellow metal reclaimed the area past the key $1800 mark on Thursday, setting aside at the same time Wednesday’s daily pullback.
In fact, bullion regained upside traction in response to the fresh bout of weakness in the greenback, while the mixed session in US yields across the curve also seem to have lent support to bullion.
There are no changes to the macro scenario around the non-yielder metal, which remains dominated by prospects for further tightening by major central banks, although the delicate COVID situation in China could spark bouts of risk aversion, which should be kind of supportive of further strength in bullion.
Further upside in gold needs to clear the December top at $1833 (December 27) to allow for a potential move to the June peak at $1879 (June 13) seconded by the May high at $1909 (May 5). In the opposite direction, the breakdown of the 200-day SMA at $1781 could motivate the yellow metal to dispute the weekly low at $1773 (December 15) ahead of the December low at $1765 (December 5) and the weekly low at $1727 (November 23). South from here emerges the 55- and 100-day SMAs at $1734 and $1722, respectively, before the 2022 low at $1614 (September 28).
Resistance levels: $1818 $1833 $1841 (4H chart)
Support levels: $1797 $1784 $1779 (4H chart)
-638079377105579819.png)
CRUDE WTI
WTI prices traded on the defensive for the second session in a row on Thursday, this time slipping back below the $77.00 mark per barrel to clinch fresh multi-session lows.
Rising concerns regarding the spread of COVID cases outside China has already prompted many countries to start testing Chinese travellers in tandem with growing fears surrounding global demand and its impact on the commodity.
Limiting the downside potential for crude oil prices emerged the weaker dollar and an important drop in gasolines stockpiles in the week to December 23 (3.105M barrels), as per the EIA’s weekly report. More on the latter showed that crude oil inventories rose by 0.718M barrels, supplies at Cushing shrank by 0.195M barrels and distillate stocks wemt up by 0.282M barrels.
Occasional bullish attempts in prices of the WTI should meet the initial up barrier at the weekly high at $81.14 (December 27) followed by the December top at $83.32 (December 1) and the 100-day SMA at $84.25. The breakout of this level could prompt a test of the $90.08 level (November 11) to start shaping up prior to the November peak at $93.73 and the key 200-day SMA at $94.79. On the flip side, the 2022 low at $70.10 (December 9) is expected to emerge as the next relevant contention prior to the round level at $70.00 and the weekly low at $66.15 (December 20 2021). The loss of the latter could put the 200-week SMA at $65.29 back on the radar ahead of the December 2021 low at $62.46 (December 2).
Resistance levels: $81.14 $82.70 $83.32 (4H chart)
Support levels: $76.76 $74.42 $73.31 (4H chart)
-638079377910030575.png)
GER40
German equities gauged by the DAX 40 index rose to 3-day highs and regained the area north of the 14000 mark on Thursday.
Indeed, investors appear to have seen the glass half full and continued to perceive as positive news of further curbing of COVID restrictions in China, all against the backdrop of rising fears of contagion outside the country and its impact on the global economy.
The money market in Germany, in the meantime, showed the 10-year Bund yields facing some downside pressure after faltering around the 2.505 area in the last couple of sessions.
The weekly high at 14160 (December 22) remains the initial target for bulls prior to the December top at 14675 (December 13) and the June peak at 14709 (June 6). Beyond this level comes the March high at 14925 (March 29) ahead of the 2022 top at 16285 (January 5). Then again, there is initial support at the December low at 13791 (December 20) before the key 200-day SMA at 13561 and the 100-day SMA at 13391. A deeper decline could retest the November low at 13022 (November 3) followed by the minor support at 12548 (October 21). The daily RSI leapt to the 50 zone.
Best Performers: Zalando SE, Sartorius AG Pfd, Porsche AG Pfd
Worst Performers: MTU Aero Engines AG, Covestro AG, Daimler Truck Holding AG
Resistance levels: 14160 14675 14709 (4H chart)
Support levels: 13871 13791 13547 (4H chart)
-638079378753543572.png)
NASDAQ
The Nasdaq 100 managed to set aside two consecutive daily retracements and regained the smile on Thursday, advancing to new 3-day highs in the boundaries of the 11000 mark.
The uptick in the tech benchmark index was underpinned by the generalized optimism surrounding the Chinese reopening, while marked gains in electric cars maker Tesla also collaborated with the upside bias along with the other major US stock indices.
Additionally, the renewed softness in the dollar and the mixed performance of US yields helped the index reverse the recent couple of sessions in the red ground.
If the rebound in the index picks up a more serious pace, then the weekly high at 11285 (December 21) could return to the fore ahead of the provisional 55-day SMA at 11366 and the 100-day SMA at 11747. If the index clears the latter, then the focus of attention is expected to shift to the December top at 12166 (December 13) before the key 200-day SMA, today at 12307. Contrarily, the December low at 10671 (December 28) should hold the initial test seconded by the November low at 10632 (November 4) and the 2022 low at 10440 (October 13). The daily RSI bounced past the 41 yardstick.
Top Gainers: Illumina, Tesla, Warner Bros Discovery Inc
Top Losers: PACCAR, Enphase, O’Reilly Automotive
Resistance levels: 11285 11764 12166 (4H chart)
Support levels: 10671 10632 10440 (4H chart)
-638079379142042679.png)
DOW JONES
Equities tracked by the Dow Jones reversed Wednesday’s moderate drop and rebounded decently on Thursday, although they kept well in place the current range bound theme.
In fact, stocks reacted positively to the continuation of the reopening in China despite some countries have started to impose measures to Chinese travelers.
Also helping the upbeat mood among market participants came some softness seen in the US labour market after weekly Claims rose vs. the previous week, supporting the idea that the Fed could make an impasse in its tightening cycle.
Extra strength for the benchmark index came from the firm performance in the tech sector, the offered stance in the greenback and declining yields.
Overall, the Dow Jones rose 1.13% to 33246, the S&P500 gained 1.83% to 3852 and the tech-heavy Nasdaq Composite advanced 2.47% to 10465.
The Dow Jones faces the next resistance level at the weekly high at 33437 (December 21) ahead of the December top at 34712 (December 13). Further advance could see the April peak at 35492 revisited prior to the February high at 35824 (February 9). Inversely, the downside remains so far limited by the 200-day SMA at 32453. The breach of this region could force the index to retreat further and test the November low at 31727 (November 3) prior to the minor support at 30206 (October 21) and the 2022 low at 28660 (October 13). The daily RSI climbed to the proximity of the 50 level.
Top Performers: Walt Disney, Salesforce Inc, Apple
Worst Performers: Merck&Co, Boeing, Caterpillar
Resistance levels: 33437 34395 34712 (4H chart)
Support levels: 32869 32573 32193 (4H chart)
-638079378373428979.png)
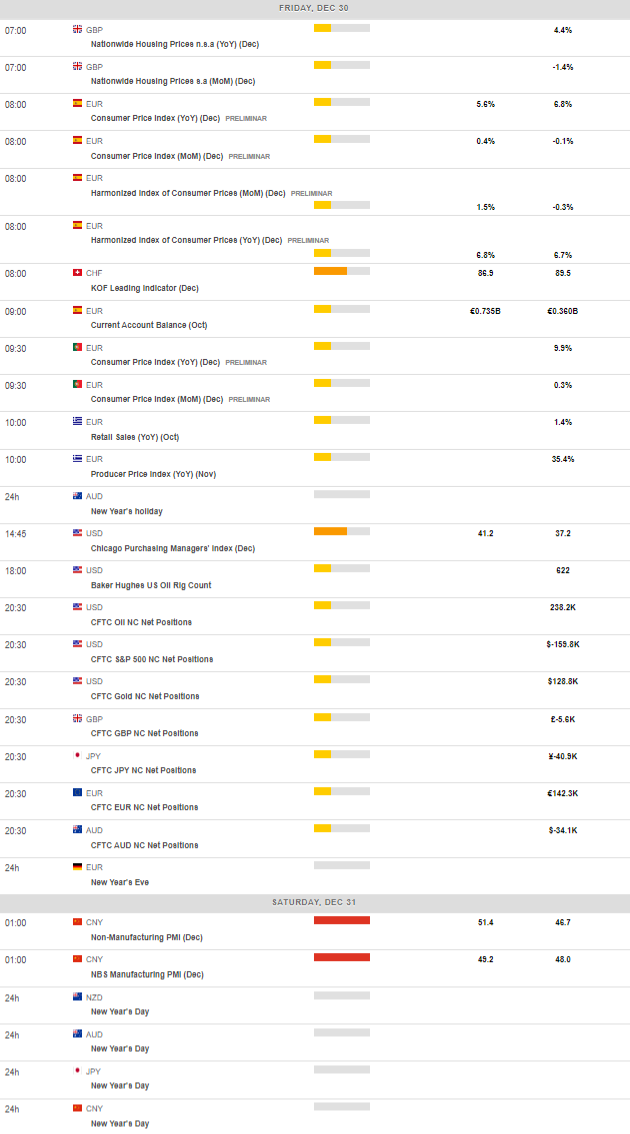
MACROECONOMIC EVENTS
All Information & Updates provided by:

All information relating to the financial markets available on this page has been prepared and issued by FXStreet (Forexstreet SL, Spain, Reg: B62498233) on the basis of publicly available information and all information believed to be reliable and does not conflict with Kuwaiti local laws, and all necessary care has been taken to before the company to ensure that the facts mentioned are correct from the source.
NCM Investment nor any of its directors or employees shall in any way be held responsible for the contents of this news, and the information contained on this page is intended only to provide clients with publicly available information and should not be construed as investment advice, report or analysis and/or constitute an offer or invitation to buy or sell financial instruments of any kind.
RISK WARNING: Forex and CFDs are highly risky leveraged products, as losses can exceed deposits. Please ensure you understand all the risks and take independent advice if necessary. NCM will segregate the clients based on the criteria of the regulator and its bylaws. NCM does not provide any advisory service; the material published does not constitute advice or a recommendation for a transaction in any financial instrument. NCM accepts no responsibility for any use of the content presented and any consequences of that use. Anyone acting on the information provided does so at their own risk.