
- Contact Us:
-

-

-

-


Daily Market Updates
02 Jan 2023
USDJPY
USD/JPY added to Thursday’s decline and dropped to multi-session lows around 130.80 at the end of the week/month/year. Furthermore, the pair gained nearly 14% since the beginning of 2022.
In fact, the demand for the Japanese safe haven picked up renewed pace in the last couple of days following unscheduled purchases of JGBs by the BoJ in an attempt to cap the move higher in yields, particularly after the latest BoJ gathering.
Adding to the downtrend in spot also appeared fresh COVID concerns and the intense retracement in the dollar.
In the meantime, the 10-year JGB yields retreated for the third session in a row and approached the 0.40% zone on Friday.
The Japanese docket was empty on Friday.
If sellers push harder, USD/JPY could challenge the December low at 130.56 (December 20), which remains closely followed by the August low at 130.39 (August 2) and the key round level at 130.00. By contrast, the weekly high at 134.50 (December 28) is expected to emerge as a tough barrier prior to the key 200-day SMA at 136.21 and weekly tops at 138.17 (December 15) and 139.89 (November 30). The surpass of the latter could put the round level at 140.00 back on the investors’ radar before the interim 55- and 100-day SMAs at 140.44 and 141.09, respectively, and the weekly peak at 142.25 (November 21). The daily RSI sank to the sub-34 area.
Resistance levels: 134.50 136.78 137.47 (4H chart)
Support levels: 130.76.43 130.56 130.39 (4H chart)
-638081843400527632.png)
GBPUSD
The British pound ended the year with decent gains following the persevering sell-off in the dollar and prompted GBP/USD to close just below the 1.2100 mark in the last session of the year. Cable, in the meantime, lost nearly 11% in 2022.
Indeed, the quid failed to capitalize on the continuation of the decline in the buck and appeared more concerned about the gloomy prospects for the domestic economy amidst (very) elevated inflation and the BoE’s hiking cycle.
There was no news in the UK debt markets, where the 10-year Gilt yields kept treading water just below the 3.70% level.
In the UK, the Nationwide Housing Prices contracted 0.1% MoM in December and expanded 2.8% from a year earlier.
No changes to the topside in GBP/USD, as the weekly top at 1.2241 (December 19) continues to stand as an immediate obstacle to extra gains prior to the December peak at 1.2446 (December 14) and the May high at 1.2666 (May 27). The breakout of the latter could put the 200-week SMA at 1.2923 to the test just before the psychological 1.3000 hurdle. At the same time, initial support appears at the weekly low at 1.1900 (November 30) ahead of the provisional 55- and 100-day SMAs at 1.1846 and 1.1664, respectively. A deeper pullback from here could allow sellers to revisit the November low at 1.1142 (November 4) seconded by the weekly low at 1.1059 (October 21). The daily RSI improved to the boundaries of the 52 yardstick.
Resistance levels: 1.2106 1.2126 1.2223 (4H chart)
Support levels: 1.2000 1.1991 1.1900 (4H chart)
-638081842900559502.png)
AUDUSD
The strong recovery in AUD/USD remained everything but abated on Friday.
Indeed, the pair clinched the sixth consecutive daily advance and rose to new 2-week tops past 0.6800 the figure at the end of the week. On a yearly view, spot shed more than 5%, falling in line with the performance of the rest of the risky assets.
The intensification of the downside in the greenback helped the Aussie dollar and the rest of the risk-associated galaxy extend the upside momentum, while the broad-based downbeat mood prevailed in the commodity space almost exclusively to the resumption of COVID fears.
There were no scheduled releases Down Under at the end of the week.
The continuation of the uptrend in AUD/USD now seems ready to confront the key 200-day SMA at 0.6861 prior to the December high at 0.6893 (December 13). Once cleared, the pair could retest the September top at 0.6916 (September 13) ahead of the psychological 0.7000 yardstick and followed by the weekly peak at 0.7008 (August 26). On the other hand, the December low at 0.6629 (December 20) appears as the immediate magnet for bears before weekly lows at 0.6584 (November 21) and 0.6386 (November 10). The loss of the latter could prompt the November low at 0.6272 (November 3) to re-emerge on the horizon. The daily RSI picked up extra traction and poked with 60.
Resistance levels: 0.6821 0.6893 0.6916 (4H chart)
Support levels: 0.6757 0.6731 0.6710 (4H chart)
-638081843829153185.png)
GOLD
Gold prices added to Thursday’s advance and extended the optimism seen in the second half of the week, managing quite well to keep the trade above the critical $1800 mark per ounce troy.
Further weakness in the greenback allowed bullion to climb to 3-day highs near $1830 in the last session of the year, while the firm upside bias in US yields across the curve somewhat undermined the likelihood of extra gains.
The precious metal, in the meantime, continued to look at developments from major central banks, while the potential resumption of the risk aversion in response to COVID jitters should initially support the demand for the metal.
Next on the upside for gold turns up the December peak at $1833 (December 27) ahead of the June high at $1879 (June 13) and the May top at $1909 (May 5). Just the opposite, the loss of the 200-day SMA at $1781 could pave the way to a probable move to the weekly low at $1773 (December 15) prior to the December low at $1765 (December 5) and the weekly low at $1727 (November 23). Once trespassed, the precious metal could challenge the 55- and 100-day SMAs at $1737 and $1723, respectively, ahead of the 2022 low at $1614 (September 28).
Resistance levels: $1826 $1833 $1841 (4H chart)
Support levels: $1797 $1784 $1781 (4H chart)
-638081844306387309.png)
CRUDE WTI
Prices of the West Texas Intermediate (WTI) climbed to 3-day highs and reclaimed the area above the key $80.00 per barrel in the last trading day of 2022. The WTI, at the same time, gained nearly 7% in the year.
Friday’s gains in the commodity were propped up by further weakness in the greenback and the generalized bias towards the risk complex, while traders continued to assess the probability of the resurgence of pent-up oil demand pari passu with the Chinese reopening.
The above, however, remained threatened by the unabated increase of COVID cases as the government kept curbing restrictions.
In the calendar, driller Baker Hughes reported that the total US oil rigs shrank by 1 in the week to December 30 to 621.
Further upside momentum in WTI faces the immediate hurdle at the weekly top at $81.14 (December 27) ahead of the December peak at $83.32 (December 1) and the 100-day SMA at $84.12. If the WTI leaves behind this region it could then confront the $90.08 level (November 11) before the November high at $93.73 and the key 200-day SMA at $94.62. On the contrary, the 2022 low at $70.10 (December 9) remains as the initial support before the round level at $70.00 and the weekly low at $66.15 (December 20 2021). Down from here comes the 200-week SMA at $65.31 prior to the December 2021 low at $62.46 (December 2).
Resistance levels: $80.54 $81.14 $82.70 (4H chart)
Support levels: $78.20 $76.76 $74.42 (4H chart)
-638081845140457060.png)
GER40
Equities tracked by the German reference index DAX 40 ended Friday’s session in the red ground and retreated nearly 13% for the whole of 2022.
Indeed, concerns regarding the surge of COVID cases in China – Europe’s key trade partner – in combination with the current elevated inflation and the likelihood that the ECB could prolong its tightening bias at least in the first half of 2023 have all weighted on investors’ mood and dragged the index lower.
In the meantime, the German 10-year Bund yields rose to fresh tops and poked with the 2.60% region on Friday, an area last seen back in mid-July 2011.
If bears remain in control of the sentiment, the DAX could revisit the December low at 13791 (December 20) ahead of the key 200-day SMA at 13558. The breach of this area could expose the interim 100-day SMA at 13394 before the November low at 13022 (November 3) and the minor support at 12548 (October 21). Inversely, there is an initial hurdle at the weekly top at 14160 (December 22) ahead of the December peak at 14675 (December 13) and seconded by the June high at 14709 (June 6). Once cleared, the index could dispute the March top at 14925 (March 29) prior to the 2022 top at 16285 (January 5). The daily RSI lost traction and dipped to the 45 zone.
Best Performers: Fresenius Medical Care AG, Volkswagen AG Non-Vtg Pfd, Porsche Automobil Holding SE Pfd
Worst Performers: Zalando SE, Deutsche Telekom AG, Continental AG
Resistance levels: 14071 14160 14675 (4H chart)
Support levels: 13871 13791 13564 (4H chart)
-638081846150641711.png)
NASDAQ
US stocks gauged by the Nasdaq 100 fell in line with the downbeat mood among investors and ended the week with modest losses (0.10% to 10939). Looking at the 2022 performance, the tech benchmark index shed more than 33%.
In fact, tech equities remained on the defensive on Friday in response to the firm note in US yields across the curve, while the perception that the Federal Reserve will most likely keep its tightening bias unchanged in the near/medium term also added to the gloomy sentiment.
The continuation of the selling pressure could force the index to revisit the December low at 10671 (December 28) ahead of the November low at 10632 (November 4) and the 2022 low at 10440 (October 13). Then again, bouts of strength could initially challenge the weekly top at 11285 (December 21) prior to the provisional 55- and 100-day SMAs at 11369 and 11727, respectively. The breakout of this level could then prompt the December peak at 12166 (December 13) to re-emerge on the horizon before the key 200-day SMA at 12292. The daily RSI corrected lower and ended near the 41 region.
Top Gainers: Lucid Group, Netflix, Baker Hughes
Top Losers: Mercado Libre, JD.com Inc Adr, Rivian Automotive
Resistance levels: 10981 11285 11764 (4H chart)
Support levels: 10671 10632 10440 (4H chart)
-638081846684020530.png)
DOW JONES
The Dow Jones ended Friday’s session slightly in the red territory, while the yearly drop approached the 9%, the worst year since the 2008 GFC.
Indeed, investors’ sentiment remained sour at the end of the week on the back of prospects for a tighter-for-longer stance from the Federal Reserve, while the continuation of the hiking cycle is also expected around the ECB and the BoJ is seen ending its ultra-accommodative stance at some point in early 2023.
The weaker dollar, in the meantime, appears to have limited the daily losses somewhat.
All in all, the Dow Jones retreated 0.22% to 33147, the S&P500 dropped 0.25% to 3839 and the tech-benchmark Nasdaq Composite shed 0.11% to 10466.
Occasional bullish attempts in the Dow Jones remained so far capped by the weekly top at 33437 (December 21). The surpass of the December peak at 34712 (December 13) should put a potential move to the April high at 35492 back on the investors’ radar before the February top at 35824 (February 9). On the flip side, the key 200-day SMA at 32448 continues to hold the downside ahead of the November low at 31727 (November 3) and the minor support at 30206 (October 21). South from here emerges the 2022 low at 28660 (October 13). The daily RSI grinded lower and flirted with 48.
Top Performers: Intel, Boeing, JP Morgan
Worst Performers: Home Depot, Travelers, McDonald’s
Resistance levels: 33437 34395 34712 (4H chart)
Support levels: 32847 32573 32197 (4H chart)
-638081845673841567.png)
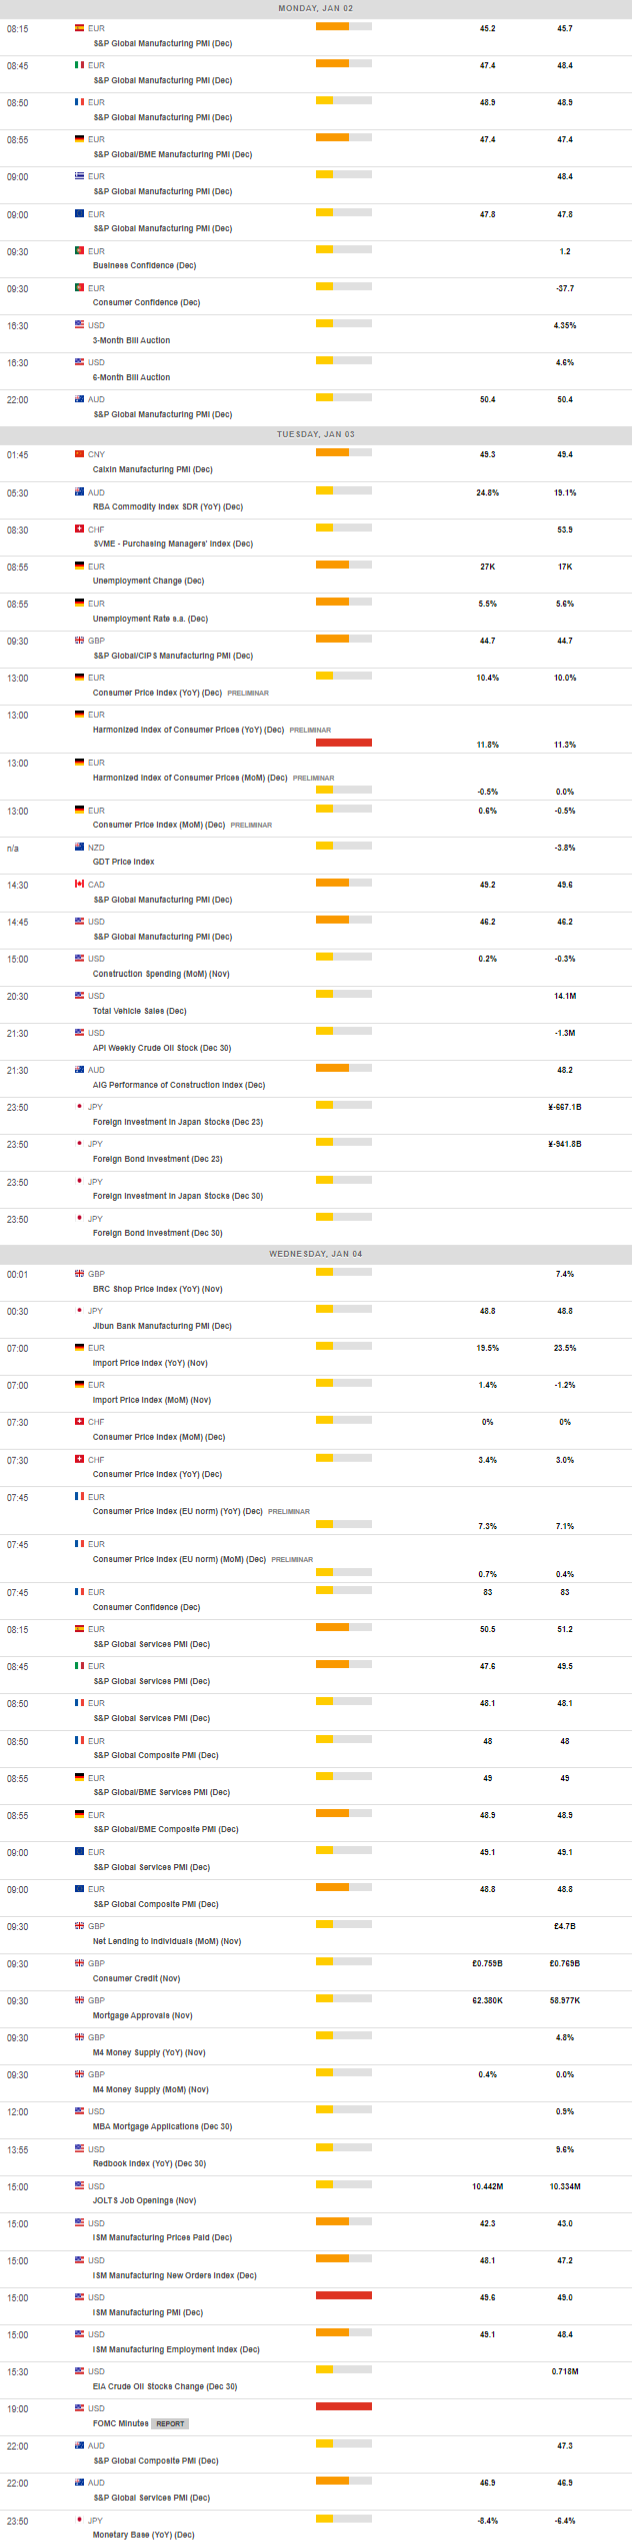
MACROECONOMIC EVENTS
All Information & Updates provided by:

All information relating to the financial markets available on this page has been prepared and issued by FXStreet (Forexstreet SL, Spain, Reg: B62498233) on the basis of publicly available information and all information believed to be reliable and does not conflict with Kuwaiti local laws, and all necessary care has been taken to before the company to ensure that the facts mentioned are correct from the source.
NCM Investment nor any of its directors or employees shall in any way be held responsible for the contents of this news, and the information contained on this page is intended only to provide clients with publicly available information and should not be construed as investment advice, report or analysis and/or constitute an offer or invitation to buy or sell financial instruments of any kind.
RISK WARNING: Forex and CFDs are highly risky leveraged products, as losses can exceed deposits. Please ensure you understand all the risks and take independent advice if necessary. NCM will segregate the clients based on the criteria of the regulator and its bylaws. NCM does not provide any advisory service; the material published does not constitute advice or a recommendation for a transaction in any financial instrument. NCM accepts no responsibility for any use of the content presented and any consequences of that use. Anyone acting on the information provided does so at their own risk.