
- Contact Us:
-

-

-

-


Daily Market Updates
03 Jan 2023
USDJPY
The persistent risk aversion in combination with the lack of activity in the US and Japanese markets seems to have lent extra wings to the safe haven yen and therefore sponsored another visit of USD/JPY to the 130.60 area on Monday.
Indeed, rising concerns in response to the surge of COVID cases mainly in China continued to favour the resurgence of the risk-off sentiment among market participants, prompting the pair to shed ground for the third consecutive day on Monday.
The next release of note in the Japanese docket will be the Consumer Confidence gauge for the month of December (January 5).
The continuation of the downtrend in USD/JPY could retest the August low at 130.39 (August 2) just before the key round level at 130.00. If spot leaves behind the latter, it could then challenge the May 2022 low at 126.36 (May 24). At the same time, the next resistance level comes at the weekly top at 134.50 (December 28) followed by the key 200-day SMA at 136.24 and weekly peaks at 138.17 (December 15) and 139.89 (November 30). North from here emerges the round level at 140.00 ahead of the provisional 55- and 100-day SMAs at 140.10 and 141.06, respectively, all prior to the weekly high at 142.25 (November 21). The daily RSI dropped further and approached the 33 level.
Resistance levels: 132.58 134.25 134.50 (4H chart)
Support levels: 130.59 130.39 129.51 (4H chart)
-638082796249061023.png)
GBPUSD
The strong risk-off mood in the global markets forced GBP/USD to reverse two straight sessions with gains and start the new year on the defensive.
Indeed, Cable receded to the mid-1.2000s and poked once again with the always relevant 200-day SMA near 1.2040 in a context where investors favoured the safe haven universe and the British pound remained under pressure.
The UK calendar was empty on Monday amidst the New Year’s Day holiday.
GBP/USD seems to be transiting a consolidative phase for the time being. That said, the next up barrier now appears at the December top at 1.2446 (December 14) seconded by the May peak at 1.2666 (May 27) and the 200-week SMA at 1.2918. The breakout of the latter could put the psychological 1.3000 yardstick back on the investors’ radar. By contrast, there is an initial contention zone at the weekly low at 1.1900 (November 30) ahead of the interim 55- and 100-day SMAs at 1.1860 and 1.1665, respectively. A deeper retracement could see the November low at 1.1142 (November 4) revisited followed by the weekly low at 1.1059 (October 21). The daily RSI broke below the 50 yardstick.
Resistance levels: 1.2106 1.2126 1.2223 (4H chart)
Support levels: 1.2000 1.1991 1.1900 (4H chart)
-638082795787527772.png)
AUDUSD
AUD/USD alternated gains with losses just above 0.6800 the figure at the beginning of the new trading year amidst meagre trading conditions in response to the New Year’s Day holiday in Australia and other major markets.
The Aussie dollar managed to stay somewhat isolated from the prevailing risk-off mood among investors, although it is expected to keep tracking news from the increasingly rapid spread of COVID cases in China.
There were no scheduled data releases in Oz on Monday.
Immediately to the upside in AUD/USD emerges the key 200-day SMA, today at 0.6857. Once cleared, the pair could confront the December peak at 0.6893 (December 13) ahead of the September high at 0.6916 (September 13). The surpass of this level could prompt the psychological 0.7000 mark to re-emerge on the horizon prior to the weekly top at 0.7008 (August 26). Contrarily, the December low at 0.6629 (December 20) offers initial support seconded by weekly lows at 0.6584 (November 21) and 0.6386 (November 10). Below the latter, the pair could retest the November low at 0.6272 (November 3). The daily RSI treaded water just below 60.
Resistance levels: 0.6821 0.6893 0.6916 (4H chart)
Support levels: 0.6757 0.6732 0.6710 (4H chart)
-638082796648149872.png)
GOLD
Gold charted an inconclusive session on Monday, although it managed well to keep business around the $1820 region per ounce troy.
The investors’ bias towards the safe haven universe against the backdrop of increasing COVID jitters lent support to the precious metal, although gains in the dollar somewhat limited its upside potential at the beginning of the new year.
Moving forward, the yellow metal could see its volatility accelerate in light of the publication of the FOMC Minutes of the December event and the Nonfarm Payrolls later in the week.
Extra gains in gold continue to initially target the December top at $1833 (December 27) prior to the June peak at $1879 (June 13) and the May high at $1909 (May 5). In the opposite direction, bears remain focused on the key 200-day SMA at $1783 before the weekly low at $1773 (December 15) and the December low at $1765 (December 5). The breach of the latter could put a probable visit to the 55-day SMA at $1737 back on the traders’ radar ahead of the weekly low at $1727 (November 23) and the 100-day SMA at $1723. South from here turns up the 2022 low at $1614 (September 28).
Resistance levels: $1833 $1847 $1857 (4H chart)
Support levels: $1809 $1781 $1772 (4H chart)
-638082797031832032.png)
CRUDE WTI
WTI prices traded in a positive foot at the beginning of the year on the back of auspicious prospects following the continuation of the reopening in China and its direct impact on the demand for crude oil.
Collaborating with the upside bias in prices of the commodity, the supply factor appeared supporting higher prices in light of news citing that Russia could reduce its output as West sanctions kick in.
Later in the week, the API and the EIA will report on US crude oil supplies in the week to December 30 on Wednesday and Thursday, respectively.
Further gains in the WTI need to clear the weekly peak at $81.14 (December 27) to allow for a potential visit to the December high at $83.32 (December 1) ahead of the 100-day SMA at $84.12. The breakout of the latter could motivate the WTI to dispute the $90.08 level (November 11) prior to the November top at $93.73 and the key 200-day SMA at $94.62. Contrastingly, support levels of relevance are not expected before the 2022 low at $70.10 (December 9) seconded by the round level at $70.00 and the weekly low at $66.15 (December 20 2021). A drop below this region exposes the 200-week SMA at $65.31 ahead of the December 2021 low at $62.46 (December 2).
Resistance levels: $80.54 $81.14 $82.70 (4H chart)
Support levels: $78.20 $76.76 $74.42 (4H chart)
-638082797797396954.png)
GER40
The German reference index for stocks, the DAX 40, started the new year with a marked advance, reclaiming at the same time the area above the key 14000 mark on Monday.
Encouraging results from the final Manufacturing PMI for the month of December (47.1) encouraged investors to increase their optimism ahead of key inflation figures in the first economy of the region due later in the week.
The daily advance in equities came in contrast with the retracement in the 10-year Bund yields from recent multi-year peaks.
The weekly high at 14160 (December 22) remains the big magnet for bulls in the near term. If the DAX surpasses this region, it could then challenge the December 2022 top at 14675 (December 13) prior to June 2022 peak at 14709 (June 6) and the March 2022 high at 14925 (March 29), all ahead of the 2022 top at 16285 (January 5). On the other hand, the immediate support level appears at the December low at 13791 (December 20) ahead of the key 200-day SMA at 13557 and the 100-day SMA at 13396. The breach of the latter could put the November low at 13022 (November 3) back on the investors’ radar prior to the minor support at 12548 (October 21). The daily RSI ticked higher past the 50 mark.
Best Performers: Zalando SE, Continental AG, Covestro AG
Worst Performers: Sartorius AG Pfd, Qiagen NV, Siemens Energy AG
Resistance levels: 14095 14160 14675 (4H chart)
Support levels: 13871 13791 13472 (4H chart)
-638082798519170044.png)
NASDAQ
Tech equities measured by the Nasdaq 100 dropped over 33% during the last year.
Same as with the rest of the US stock indices, the tighter-for-longer stance from the Federal Reserve along with recession concerns and the march north in US yields across the curve, all forced the index to remain on the defensive in 2022.
As US markets remained closed on Monday, investors are expected to keep focused on the release of key data later in the week, namely the FOMC Minutes and the Nonfarm Payrolls on Wednesday and Friday, respectively.
Losses in the index are expected to accelerate on a breakdown of the December 2022 low at 10313 (December 22). If cleared, then the Nasdaq 100 could revisit the November 2022 low at 10262 (November 4) ahead of the 2022 low at 10088 (October 13) and the weekly low at 9663 (June 29 2020). On the flip side, the initial up barrier turns up at the weekly peak at 10753 (December 21) before the 55- and 100-day SMAs at 10894 and 11345, respectively. A move beyond the latter could prompt a test of the December 2022 high at 11571 (December 13) to start shaping up prior to the key 200-day SMA at 11838 and the September 2022 top at 12270 (September 12). The daily RSI surpassed the 41 level.
Top Gainers: Expion 360, Elys Game Technology Corp, Wavedancer
Top Losers: Applied Molecular, E-Home Household Service Holdings Ltd, Mingzhu
Resistance levels: 10753 11352 11399 (4H chart)
Support levels: 10313 10262 10088 (4H chart)
-638082798912313024.png)
DOW JONES
US markets were closed due to the New Year’s Day holiday on Monday.
Back to Friday’s session, US equities faded part of the previous day’s advance and ended the 2022 with humble losses. It is worth mentioning that the Dow Jones retreated nearly 9% during the past year, the worst yearly performance since 2008.
The firm note in the greenback over the last twelve months in combination with the hiking cycle from the Federal Reserve and other major central banks as well as the recession risks associated with higher interest rates all kept gains in stocks depressed over the last year.
Overall, the Dow Jones dropped 0.22% to 33147, the S&P500 retreated 0.25% to 3839 and the tech-benchmark Nasdaq Composite lost 0.11% to 10466.
A deeper decline in the Dow Jones faces the next support at the key 200-day SMA at 32454 ahead of the November low at 31727 (November 3) and the minor support at 30206 (October 21). The breakdown of the latter should leave the index vulnerable to a test of the 2022 low at 28660 (October 13). Inversely, the weekly high at 33437 (December 21) comes first ahead of the December top at 34712 (December 13) and the April peak at 35492. Further north aligns the February high at 35824 (February 9). The daily RSI eased a tad to the 38 zone.
Top Performers: Chevron, Walt Disney, Dow
Worst Performers: 3M, Amgen, Nike
Resistance levels: 33437 34395 34712 (4H chart)
Support levels: 32573 32183 31727 (4H chart)
-638082798159223647.png)
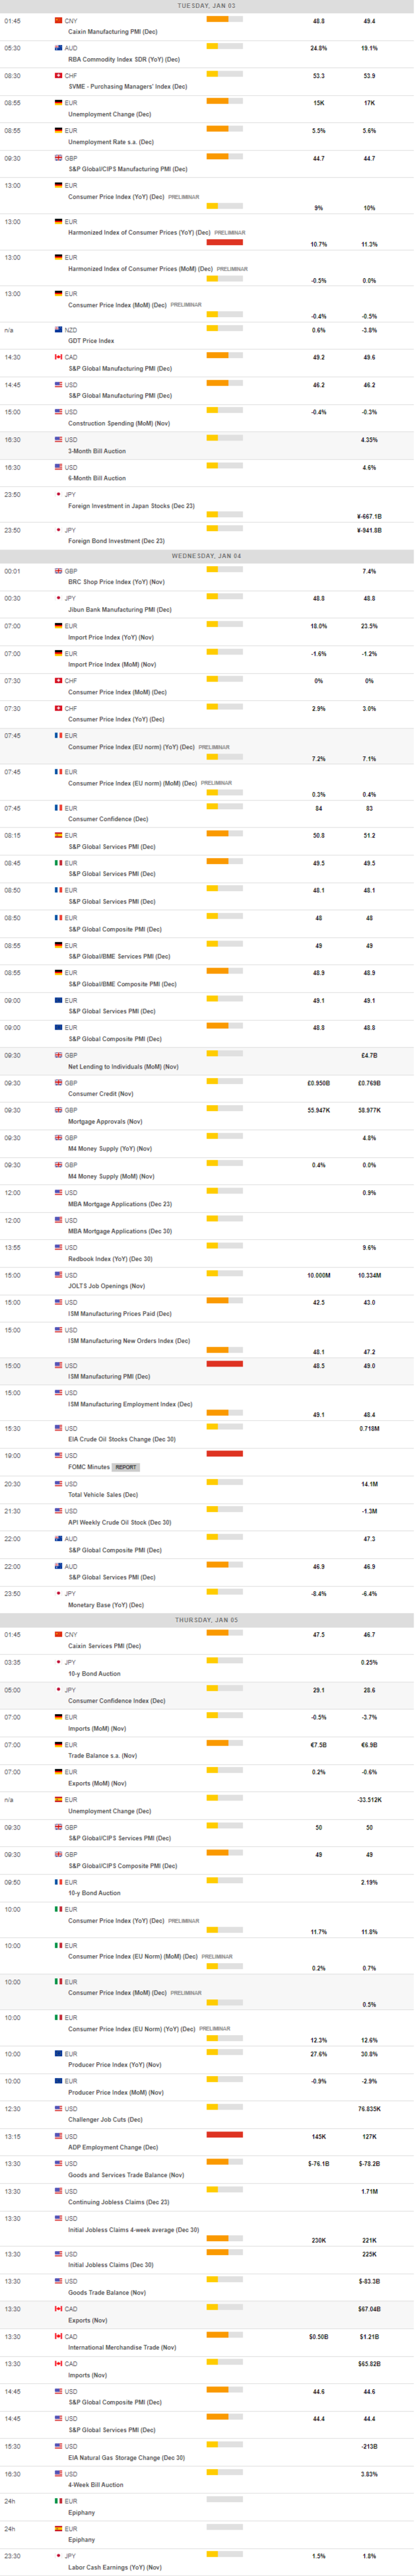
MACROECONOMIC EVENTS
All Information & Updates provided by:

All information relating to the financial markets available on this page has been prepared and issued by FXStreet (Forexstreet SL, Spain, Reg: B62498233) on the basis of publicly available information and all information believed to be reliable and does not conflict with Kuwaiti local laws, and all necessary care has been taken to before the company to ensure that the facts mentioned are correct from the source.
NCM Investment nor any of its directors or employees shall in any way be held responsible for the contents of this news, and the information contained on this page is intended only to provide clients with publicly available information and should not be construed as investment advice, report or analysis and/or constitute an offer or invitation to buy or sell financial instruments of any kind.
RISK WARNING: Forex and CFDs are highly risky leveraged products, as losses can exceed deposits. Please ensure you understand all the risks and take independent advice if necessary. NCM will segregate the clients based on the criteria of the regulator and its bylaws. NCM does not provide any advisory service; the material published does not constitute advice or a recommendation for a transaction in any financial instrument. NCM accepts no responsibility for any use of the content presented and any consequences of that use. Anyone acting on the information provided does so at their own risk.