
- Contact Us:
-

-

-

-


Daily Market Updates
05 Jan 2023
USDJPY
Another strong session for USD/JPY on Wednesday, this time printing new 3-day highs well north of the 132.00 hurdle, always against the backdrop of the dominating appetite for the risk complex and lack of news from the FOMC Minutes.
Furthermore, Wednesday’s price action around the pair came in tandem with the pronounced drop in the greenback along with another negative performance of US yields across the curve, while the 10-year JGB yields rose to multi-day peaks near 0.48%.
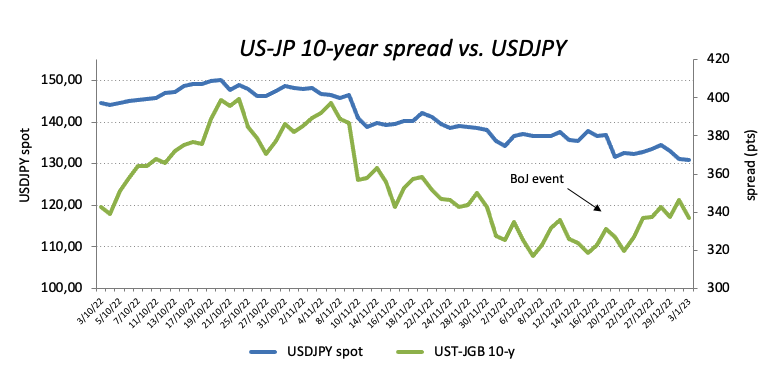
From the BoJ, the central bank announced another unscheduled bond-purchasing operation, adding to the ones observed during last week. Still around the BoJ, Governor Kuroda reiterated that the ongoing ultra-accommodative monetary stance remains well in place in order to hit the inflation target in addition to a more robust wage growth. Kuroda stressed that the context remains highly uncertain and expects global inflation to peak vs. a slowdown in growth overseas.
In Japan, Foreign Bond Investment shrank to ¥459.5B in the week to December 24, while the final Jibun Bank Manufacturing PMI eased marginally to 48.9 in December (from 49.0).
USD/JPY keeps navigating the area last traded back in early August 2022. Against that, if spot clears the weekly low at 129.50 (January 3) it could then confront the May 2022 low at 126.36 (May 24) ahead of the weekly low at 121.27 (March 31 2022). Then again, occasional bullish attempts should not meet any hurdle of note until the weekly high at 134.50 (December 28 2022), which should give way to a probable test of the key 200-day SMA at 136.32 in case that one is cleared. North from here aligns the weekly top at 138.17 (December 15 2022) prior to the 55-day SMA at 139.42 and the weekly peak at 139.89 (November 30 2022). Further up awaits the round level at 140.00 seconded by the weekly high at 142.25 (November 21). The daily RSI appeared firm above the 41 barrier.
Resistance levels: 132.71 133.49 134.50 (4H chart)
Support levels: 129.92 129.50 126.36 (4H chart)
-638084588122589985.png)
GBPUSD
The renewed offered stance around the greenback sponsored a strong comeback in the British pound and lifted GBP/USD back to the proximity of the 1.2100 hurdle amidst the generalized optimism in the risk-linked galaxy.
Indeed, Cable also managed to set aside two daily pullbacks in a row against the backdrop of a sharp bounce off multi-week lows just below the 1.1900 mark recorded on January 3.
In the UK docket, Mortgage Approvals dropped to 46.075K in November and Mortgage Lending increased to £4.358B in the same month.
The continuation of the march north in GBP/USD continues to target the December 2022 high at 1.2446 (December 14) followed by the May 2022 top at 1.2666 (May 27) and the 200-week SMA at 1.2918, which comes just ahead of the psychological 1.3000 mark. Meanwhile, there is an immediate contention at the so far weekly low at 1.1899 (January 3) before the provisional 55- and 100-day SMAs at 1.1887 and 1.1663, respectively. The breach of this region could pave the way for a move to the November 2022 low at 1.1142 (November 4) and the weekly low at 1.1059 (October 21 2022). The daily RSI advanced north of the 50 yardstick.
Resistance levels: 1.2087 1.2106 1.2126 (4H chart)
Support levels: 1.1899 1.1778 1.1763 (4H chart)
-638084587775281675.png)
AUDUSD
The Aussie dollar was the best performing currency on Wednesday, managing to surpass the key 200-day SMA (0.6850) and approach the key 0.6900 hurdle, or 3-week tops.
Indeed, AUD/USD rose more than 2% during the best moment of Wednesday’s session on the back of positive news citing that China could resume its purchases of Australian coal most likely from April, leaving behind the Chinese ban in place since late 2020.
In addition to the above-mentioned news, the intense sell-off in the greenback lent extra legs to the sharp uptick in the pair, which came in stark contrast to the generalized negative mood in the commodity universe.
There were no data releases of note in Oz on Wednesday.
If bulls can remain in control, AUD/USD should meet the next target of note at the December 2022 top at 0.6893 (December 13) ahead of the September 2022 peak at 0.6916 (September 13). If the pair clears the latter, it could then prompt the psychological 0.7000 mark to emerge on the horizon closely followed by the weekly high at 0.7008 (August 26). By contrast, the so far weekly low at 0.6688 (January 3) should offer initial support prior to the December low at 0.6629 (December 20) and weekly lows at 0.6584 (November 21) and 0.6386 (November 10). The daily RSI leapt past the 58 yardstick.
Resistance levels: 0.6886 0.6893 0.6916 (4H chart)
Support levels: 0.6688 0.6650 0.6629 (4H chart)
-638084588559482088.png)
GOLD
The optimism around the precious metal remained everything but abated on Wednesday.
Indeed, gold prices rose past the $1860 mark per ounce troy for the first time since early June 2022 on Wednesday, always on the back of the strong retracement in the dollar and declining US yields across the curve.
That said, bullion extended the advance for the fourth consecutive session and now faces the next risk event on Friday with the release of the US Nonfarm Payrolls for the month of December.
If the upside momentum accelerates, gold could dispute the June 2022 top at $1879 (June 13) ahead of the May 2022 peak at $1909 (May 5). The surpass of the latter could open the door to the April 2022 high at $1998 (April 18). In the opposite direction, there is decent contention at the key 200-day SMA at $1780 prior to the weekly low at $1773 (December 15) and the December low at $1765 (December 5). Further down emerges the 55-day SMA at $1744 ahead of the weekly low at $1727 (November 23). This area remains propped up by the 100-day SMA at $1724 before the 2022 low at $1614 (September 28).
Resistance levels: $1865 $1879 $1909 (4H chart)
Support levels: $1827 $1797 $1784 (4H chart)
-638084588956784060.png)
CRUDE WTI
Prices of the American benchmark for the sweet light crude oil slipped back below the $73.00 mark per barrel on Wednesday, or new 3-week lows.
The persevering demand concerns stemming mainly from China and its continuous battle against surging COVID cases combined with the equally omnipresent recession fears, all putting prices of the commodity under heightened pressure and adding to Monday’s negative performance.
Later in the NA session, the API will release its report on US crude oil stockpiles in the week to December 30.
A worsening scenario could drag prices of the WTI to retest the 2022 low at $70.10 (December 9) just before the round level at $70.00. The breach of the latter could motivate the weekly low at $66.15 (December 20 2021) to re-emerge on the horizon prior to the 200-week SMA at $65.39 and the December 2021 low at $62.46 (December 2). In the opposite direction, the initial up barrier awaits at the weekly top at $81.44 (January 3) followed by the December 2022 peak at $83.32 (December 1) and the 100-day SMA at $83.83. The breakdown of this region could put the $90.08 level (November 11 2022) back on the radar seconded by the November 2022 high at $93.73 and the key 200-day SMA at $94.26.
Resistance levels: $77.67 $81.44 $82.70 (4H chart)
Support levels: $72.79 $70.07 $66.11 (4H chart)
-638084589686761972.png)
GER40
Equities gauged by the German benchmark DAX 40 advanced for the third session in a row and revisited levels last seen nearly a month ago around the 14500 region on Wednesday.
Positive final readings from the Services sector across the euro area coupled with lower-than-expected flash inflation figures in France all added to the perception that the ECB could pause its hiking cycle sooner than previously anticipated and morphed into extra legs for the uptrend in the index.
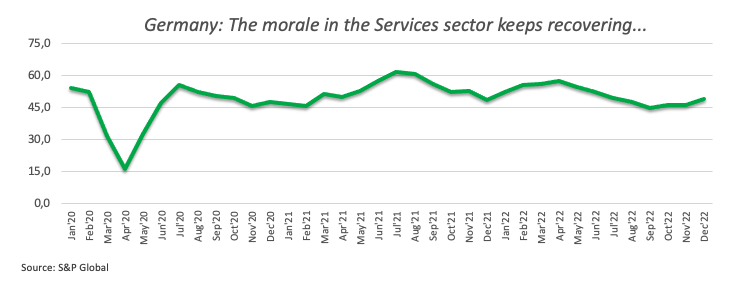
Data wise in Germany, the S&P Global Services PMI rose to 49.2 in December and 49.0 when it came to the Composite reading. In addition, Import Prices contracted 4.5% MoM in November and rose 14.5% over the last twelve months.
Looking at the money market, the 10-year Bund yields dropped for the third session in a row to multi-day lows in the 2.25% region.
Further gains in the DAX 40 now target the December 2022 high at 14675 (December 13) closely followed by the June 2022 top at 14709 (June 6). The continuation of the uptrend could see the March 2022 peak at 14925 (March 29) revisited ahead of the 2022 high at 16285 (January 5). On the flip side, the 55-day SMA at 13944 offers interim support ahead of the December 2022 low at 13791 (December 20) and the key 200-day SMA at 13558. The loss of the latter could pave the way for a test of the 100-day SMA at 13406 prior to the November 2022 low at 13022 (November 3) and the minor support at 12548 (October 21). The daily RSI advanced further and approached 62.
Best Performers: Vonovia SE, Deutsche Bank AG, adidas AG
Worst Performers: RWE AG, Deutsche Boerse AG, Linde PLC
Resistance levels: 14492 14675 14709 (4H chart)
Support levels: 14254 14121 13791 (4H chart)
-638084590375791118.png)
NASDAQ
The tech benchmark Nasdaq 100 shed ground for the third session in a row and eroded initial gains following the hawkish tone from the FOMC Minutes on Wednesday.
The weaker dollar and the generalized negative bias in the US yields only added to the sour mood among traders and did nothing to prevent another daily decline in the index, which faltered once again just ahead of the 11000 mark.
A deeper pullback in the Nasdaq 100 could retest the December 2022 low at 10671 (December 22) prior to the November 2022 low at 10632 (November 4) and the 2022 low at 10440 (October 13). Down from here comes the weekly low at 10313 (July 24 2020). Inversely, there is initial hurdle at the so far weekly top at 11093 (January 3) before the weekly peak at 11285 (December 21 2022) and the 55- and 100-day SMAs at 11369 and 11677, respectively. The trespass of this zone could put a potential visit to the December 2022 high at 12166 (December 13) back on the investors’ radar prior to the key 200-day SMA at 12257 and the September 2022 top at 12752 (September 12). The daily RSI grinded lower to the 39 area.
Top Gainers: JD.com Inc Adr, Warner Bros Discovery, Pinduoduo
Top Losers: Microsoft, Baker Hughes, Datadog
Resistance levels: 11093 11285 11719 (4H chart)
Support levels: 10671 10632 10440 (4H chart)
-638084591111524981.png)
DOW JONES
Equities tracked by the Dow Jones added to the negative start of the new year and dropped modestly on Wednesday.
The index lost some upside traction and trimmed earlier gains in the wake of the release of the FOMC Minutes of the December meeting, after members reiterated that further evidence is needed to confirm a confident downtrend in the inflation, while all members ruled out rate cuts this year.
Overall, the Dow Jones dropped 0.05% to 33119 the S&P500 advanced 0.26% to 3833 and the tech-reference Nasdaq Composite gained 0.13% to 10401.
Further recovery in the Dow Jones should not meet any hurdle of relevance until the weekly peak at 33437 (December 21 2022) ahead of the December 2022 high at 34712 (December 13). If the index leaves this level behind, it could then confront the April 2022 top at 35492 prior to the February 2022 peak at 35824 (February 9). On the contrary, the breakdown of the key 200-day SMA at 32435 could see the November 2022 low at 31727 (November 3) revisited ahead of the minor support at 30206 (October 21 2022) and the 2022 low at 28660 (October 13). The daily RSI edged higher past the 50 mark.
Top Performers: Walt Disney, Boeing, Intel
Worst Performers: Microsoft, UnitedHealth, Honeywell
Resistance levels: 33437 34395 34712 (4H chart)
Support levels: 32573 32196 31727 (4H chart)
-638084590026280649.png)
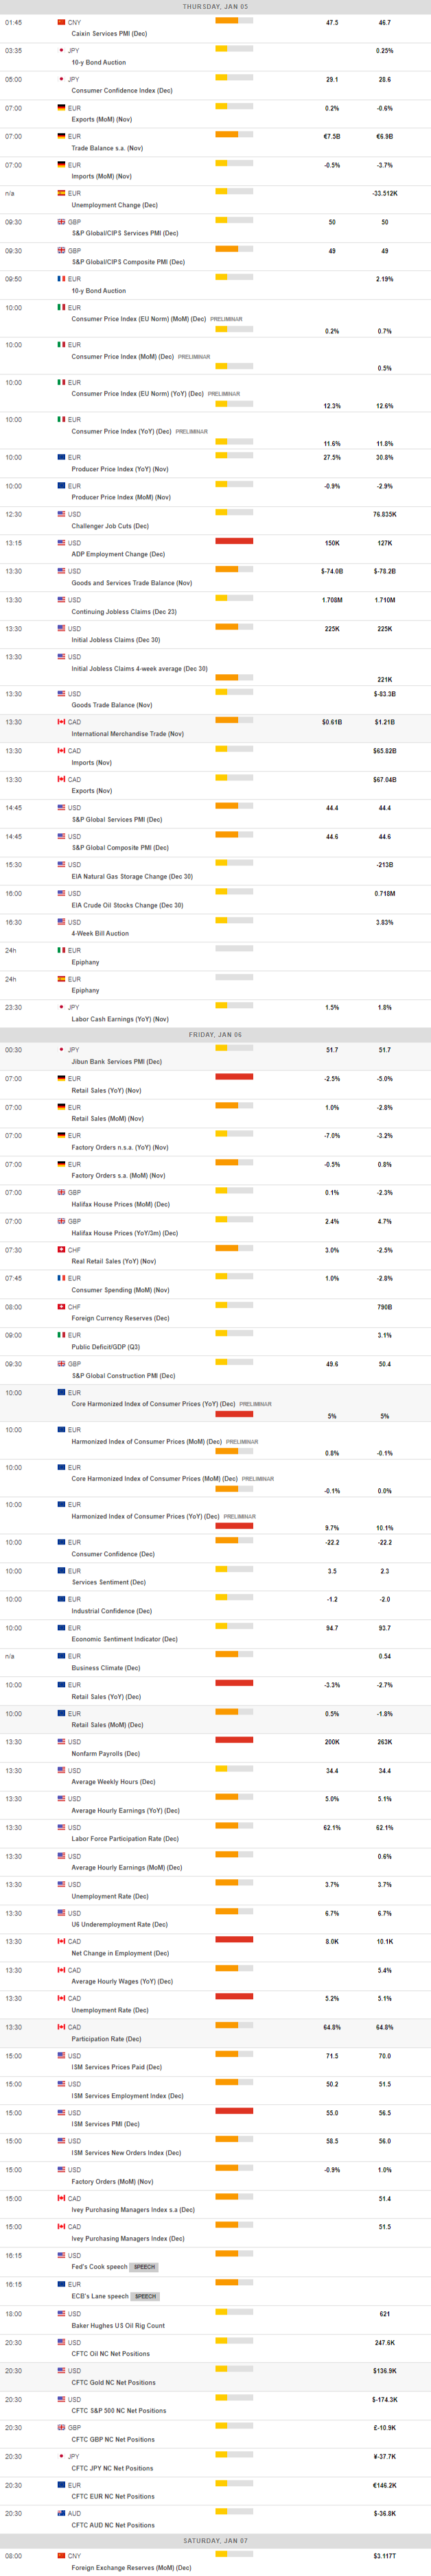
MACROECONOMIC EVENTS
All Information & Updates provided by:

All information relating to the financial markets available on this page has been prepared and issued by FXStreet (Forexstreet SL, Spain, Reg: B62498233) on the basis of publicly available information and all information believed to be reliable and does not conflict with Kuwaiti local laws, and all necessary care has been taken to before the company to ensure that the facts mentioned are correct from the source.
NCM Investment nor any of its directors or employees shall in any way be held responsible for the contents of this news, and the information contained on this page is intended only to provide clients with publicly available information and should not be construed as investment advice, report or analysis and/or constitute an offer or invitation to buy or sell financial instruments of any kind.
RISK WARNING: Forex and CFDs are highly risky leveraged products, as losses can exceed deposits. Please ensure you understand all the risks and take independent advice if necessary. NCM will segregate the clients based on the criteria of the regulator and its bylaws. NCM does not provide any advisory service; the material published does not constitute advice or a recommendation for a transaction in any financial instrument. NCM accepts no responsibility for any use of the content presented and any consequences of that use. Anyone acting on the information provided does so at their own risk.