
- Contact Us:
-

-

-

-


Daily Market Updates
06 Jan 2023
USDJPY
USD/JPY rose to multi-day tops and briefly trespassed the 134.00 hurdle on Thursday.
Indeed, the sharp rebound in the greenback - particularly in response to solid prints from the ADP report and weekly Claims - in combination with the rebound in US yields across the curve allowed the pair to clinch the third consecutive session with gains on Thursday.
News from the Japanese money market saw the JGB 10-year yields ease to the proximity of 0.40% region, giving away Wednesday’s gains.
In the Japanese calendar, the Consumer Confidence improved to 30.3 for the month of December (from 28.6).
The weekly top at 134.50 (December 28 2022) still emerges as the next target of note in case the rebound in USD/JPY gathers extra steam. Once cleared, the pair could dispute the key 200-day SMA at 136.39 ahead of the weekly peak at 138.17 (December 15 2022). North from here turns up the 55-day SMA at 139.15 followed by the weekly high at 139.89 (November 30 2022) and the round level at 140.00. On the contrary, a drop below the weekly low at 129.50 (January 3) could prompt the May 2022 low at 126.36 (May 24) to emerge on the horizon prior to the weekly low at 121.27 (March 31 2022). The daily RSI advanced further north of the 43 mark.
Resistance levels: 134.05 134.50 135.57 (4H chart)
Support levels: 129.92 129.50 126.36 (4H chart)
-638085448204831290.png)
GBPUSD
GBP/USD fully faded Wednesday’s advance and broke below the 1.1900 support to clinch multi-week lows on the back of the intense bounce in the greenback on Thursday.
Indeed, sellers re-emerged once again following another unsuccessful attempt by Cable to revisit the 1.2100 neighbourhood on Thursday despite the final UK Services PMI ticked higher to 49.9 during December.
Adding to the sour mood around the British pound, the BoE’s Decision Maker Panel (DMP) did not come on the auspicious side after it showed that members expected the UK inflation tracked by the CPI to be 7.4% a year ahead in December (from November’s 7.2%). In addition, and according to businesses, the Panel Survey noted that higher interest rates should reduce investment and employment over the next year.
The breach of the January low at 1.1873 (January 5) could expose a move to the 50% Fibo retracement of the November-December rally at 1.1794 ahead of the 100-day SMA at 1.1663 and the 78.6% Fibo retracement at 1.1421. On the other hand, there are no hurdles of note before the December 2022 top at 1.2446 (December 14) ahead of the May 2022 peak at 1.2666 (May 27) and the 200-week SMA at 1.2918, which precedes the psychological 1.3000 level. The daily RSI corrected lower to the area below the 43 level.
Resistance levels: 1.2087 1.2111 1.2126 (4H chart)
Support levels: 1.1873 1.1778 1.1762 (4H chart)
-638085447860924930.png)
AUDUSD
AUD/USD reversed a big chunk of Wednesday’s strong advance and returned to the area well below the 0.6800 support on Thursday.
The intense bounce in the greenback in a context where the appetite for the risk-associated universe appeared subdued, weighed heavily on the Aussie dollar and forced spot to trade on the defensive.
The mixed note in the commodity complex also collaborated with the selling bias around the pair, with copper prices advancing markedly after four consecutive sessions closing with losses and the iron ore treading water around the $115.00 region.
The next data release of note in the Australian docket will be the Ai Group Services Index.
In case buyers regain the upper hand, AUD/USD needs to surpass the so far January top at 0.6886 (January 4) to allow for a rapid test of the December 2022 peak at 0.6893 (December 13) prior to the September 2022 high at 0.6916 (September 13). The surpass of this level could put the psychological 0.7000 yardstick on the investors’ radar just before the weekly top at 0.7008 (August 26). Then again, there is initial support at the January low at 0.6688 (January 3) ahead of the December low at 0.6629 (December 20) and weekly lows at 0.6584 (November 21) and 0.6386 (November 10). The daily RSI lost the grip and broke below 53.
Resistance levels: 0.6886 0.6893 0.6916 (4H chart)
Support levels: 0.6734 0.6688 0.6650 (4H chart)
-638085448569051138.png)
GOLD
Gold prices saw their solid uptrend sharply halted on Thursday in response to the strong rebound in the greenback, solid US data and higher yields on both sides of the ocean.
Selling orders started to pile up around the precious metal on the back of the firm demand for the US dollar in response to auspicious results from the US labour market, where the ADP report and weekly Initial Jobless Claims surprised to the upside.
The subsequent pick up in US yields also put bullion under extra pressure pari passu with firmer expectations of a tighter-for-longer stance from the Federal Reserve.
Extra weakness in gold could see the key 200-day SMA at $1779 revisited ahead of the weekly low at $1773 (December 15) and the December low at $1765 (December 5). The loss of the latter could pave the way for a move to the 55-day SMA at $1748 seconded by the weekly low at $1727 (November 23), which appears bolstered by the 100-day SMA at $1724 and precedes the 2022 low at $1614 (September 28). By contrast, a break above the January top at $1865 (January 4) could motivate a visit to the June 2022 peak at $1879 (June 13) to start shaping up prior to the May 2022 high at $1909 (May 5) and the April 2022 top at $1998 (April 18).
Resistance levels: $1865 $1879 $1909 (4H chart)
Support levels: $1825 $1797 $1784 (4H chart)
-638085448960243735.png)
CRUDE WTI
WTI prices left behind two strong daily retracements and tepidly returned to the positive territory near the $75.00 mark per barrel on Thursday.
The small rebound in prices of the commodity came exclusively in response to an unexpected drop in gasoline inventories and distillate stocks during the past week, as reported by the EIA.
Indeed, and on the latter, crude oil inventories rose by 1.694M barrels in the week to December 30, while supplies at Cushing went up by 0.244M barrels, distillate stocks shrank by 1.427M barrels and gasoline stockpiles dropped by 0.346M barrels.
Looking at the broader scenario for crude oil, recession concerns remained unabated following a hawkish tilt from the FOMC Minutes on Wednesday and better-than-expected readings from the US labour market on Thursday.
In addition, while the reopening in China opens the door to the resurgence of pent-up demand, that view remains clouded by an unabated surge of COVID cases in the country.
The loss of the January low at $72.50 (January 5) carries the potential to spark a deeper decline to the 2022 low at $70.10 (December 9) prior to the round level at $70.00. If the WTI breaks below this region, it could then prompt the weekly low at $66.15 (December 20 2021) to return to the traders’ radar ahead of the 200-week SMA at $65.40 followed by the December 2021 low at $62.46 (December 2). Contrarily, the weekly peak at $81.44 (January 3) appears reinforced by the 55-day SMA, while the breakout of this level exposes the December 2022 high at $83.32 (December 1) ahead of the 100-day SMA at $83.69. Up from here awaits the $90.08 level (November 11 2022) prior to the November 2022 top at $93.73 and the key 200-day SMA at $94.11.
Resistance levels: $74.88 $77.39 $81.44 (4H chart)
Support levels: $72.50 $70.07 $66.11 (4H chart)
-638085449678585871.png)
GER40
German equities tracked by the DAX 40 reversed three consecutive daily advances and retreated modestly on Thursday. The index, however, managed well to keep business well north of the 14000 mark.
In fact, and amidst the mixed performance in the rest of the European stock markets, the German benchmark seems to have suffered the disappointing trade figures, where exports (-0.3% MoM) and imports (-3.3% MoM) came in below expectations in November.
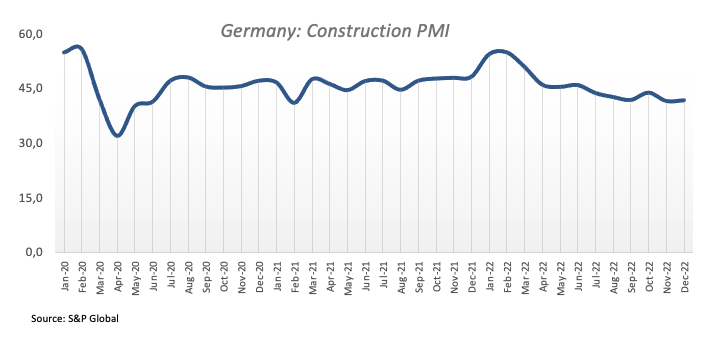
Further data releases in Germany showed the S&P Global Construction PMI improving marginally to 41.7 in December (from 41.5).
In the German debt market, the 10-year Bund yields regained some upside traction and closed with humble gains around the 2.30% area.
The DAX 40 recorded a new January high at 14501 (January 5). The surpass of this level could see the December 2022 top at 14675 (December 13) revisited just ahead of the June 2022 peak at 14709 (June 6). Further north comes the March 2022 high at 14925 (March 29) prior to the 2022 top at 16285 (January 5). Conversely, the 55-day SMA at 13975 should hold the initial test before the December 2022 low at 13791 (December 20) and the key 200-day SMA at 13558. Once cleared, the index could challenge the 100-day SMA at 13414 ahead of the November 2022 low at 13022 (November 3) and the minor support at 12548 (October 21). The daily RSI grinded a bit lower below the 60 yardstick.
Best Performers: Sartorius AG, VZO, Zalando SE, Deutsche Telekom AG
Worst Performers: Linde PLC, Merck, E.ON SE
Resistance levels: 14501 14675 14709 (4H chart)
Support levels: 14258 14130 13791 (4H chart)
-638085450797980503.png)
NASDAQ
The tech-heavy Nasdaq 100 followed the rest of its US peers and returned to the negative territory, quickly forgetting about the previous positive session and shedding 1.51% to 10750 on Thursday.
The solid pace of the greenback in combination with higher yields weighed on the tech sector and forced the index to revisit the area of multi-session lows near 10700. Also adding to the prevailing downside pressure, firm readings from the US labour market on Thursday fanned the flames of the continuation of the Fed’s hiking cycle for the time being.
Bears continue to target the December 2022 low at 10671 (December 22) just before the November 2022 low at 10632 (November 4) and the 2022 low at 10440 (October 13). The breakdown of the latter, in the meantime, could put a potential test of the weekly low at 10313 (July 24 2020) on the horizon. On the opposite side, the January peak at 11093 (January 3) appears as the immediate up barrier ahead of the weekly high at 11285 (December 21 2022) and the provisional 55- and 100-day SMAs at 11365 and 11650, respectively. Beyond the latter emerges the December 2022 top at 12166 (December 13) before the key 200-day SMA at 12240 and the September 2022 peak at 12752 (September 12). The daily RSI retreated further and flirted with 38.
Top Gainers: Pinduoduo, Warner Bros Discovery, Diamondback
Top Losers: Crowdstrike Holdings, Walgreen Boots, Workday
Resistance levels: 11093 11285 11670 (4H chart)
Support levels: 10742 10671 10632 (4H chart)
-638085451974891273.png)
DOW JONES
Stocks gauged by the Dow Jones resumed the downside and rapidly set aside Wednesday’s gains on the back of the deteriorated outlook in the risk complex, the strong rebound in the dollar and rising US yields.
Indeed, sentiment among investors soured on the back of the firm results from the US labour market, which in turn reignited the Fed’s tighter-for-longer narrative and encouraged sellers to regain control of the markets.
All in all, the Dow Jones deflated 0.72% to 33025, the S&P500 retreated 0.70% to 3825 and the tech-benchmark Nasdaq Composite dropped 1.45% to 10307.
The Dow Jones appears stuck within a multi-session consolidative range so far. The continuation of the downside pressure could put the key 200-day SMA at 32426 to the test before the November 2022 low at 31727 (November 3). The loss of the latter could open the door to a test of the minor support at 30206 (October 21 2022) prior to the 2022 low at 28660 (October 13). On the flip side, there is initial resistance at the weekly high at 33437 (December 21 2022). Above this level, the next hurdle of relevance is not seen before the December 2022 top at 34712 (December 13) followed by the April 2022 peak at 35492 and the February 2022 high at 35824 (February 9). The daily RSI deflated to the sub-45 region.
Top Performers: Chevron, Verizon, Merck&Co
Worst Performers: Walgreen Boots, Salesforce Inc, Microsoft
Resistance levels: 33437 34395 34712 (4H chart)
Support levels: 32573 32194 31727 (4H chart)
-638085450042629084.png)
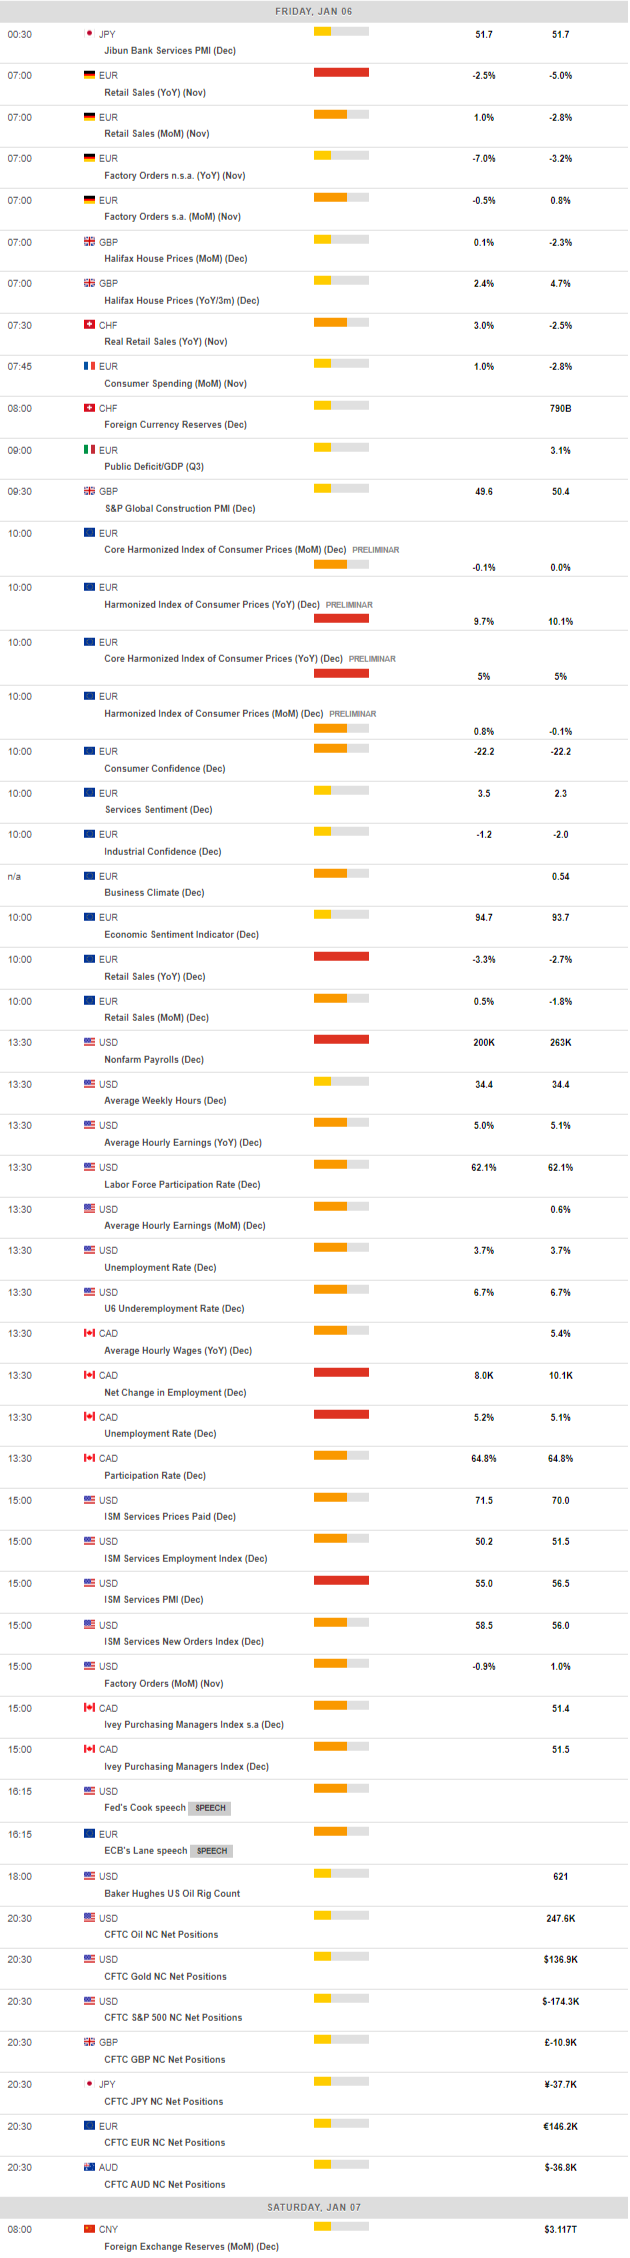
MACROECONOMIC EVENTS
All Information & Updates provided by:

All information relating to the financial markets available on this page has been prepared and issued by FXStreet (Forexstreet SL, Spain, Reg: B62498233) on the basis of publicly available information and all information believed to be reliable and does not conflict with Kuwaiti local laws, and all necessary care has been taken to before the company to ensure that the facts mentioned are correct from the source.
NCM Investment nor any of its directors or employees shall in any way be held responsible for the contents of this news, and the information contained on this page is intended only to provide clients with publicly available information and should not be construed as investment advice, report or analysis and/or constitute an offer or invitation to buy or sell financial instruments of any kind.
RISK WARNING: Forex and CFDs are highly risky leveraged products, as losses can exceed deposits. Please ensure you understand all the risks and take independent advice if necessary. NCM will segregate the clients based on the criteria of the regulator and its bylaws. NCM does not provide any advisory service; the material published does not constitute advice or a recommendation for a transaction in any financial instrument. NCM accepts no responsibility for any use of the content presented and any consequences of that use. Anyone acting on the information provided does so at their own risk.