
- Contact Us:
-

-

-

-


Daily Market Updates
09 Jan 2023
USDJPY
USD/JPY reversed three consecutive daily advances on Friday, shedding nearly 3 cents from multi-day highs around 134.80 to the area of daily lows in the 132.00 neighbourhood.
Indeed, it was all the way down for the pair soon after the release of the US Nonfarm Payrolls (+223K), dragged lower by the pronounced sell-off in the greenback and the marked move lower in US yields across the curve.
Data wise in Japan, Average Cash Earnings expanded 0.5% in the year to November and the final Jibun Bank Services PMI improved to 51.1 also in the last month of the year.
Friday’s sharp reversal now motivates USD/JPY to leave the door open to a potential visit to the weekly low at 129.50 (January 3) followed by the May 2022 low at 126.36 (May 24) and the weekly low at 121.27 (March 31 2022). On the other hand, there is an initial up-barrier at the weekly peak at 134.50 (December 28 2022) ahead of the key 200-day SMA at 136.44 and the weekly high at 138.17 (December 15 2022). The surpass of the latter puts the 55-day SMA at 138.86 back on the investors’ radar ahead of the weekly top at 139.89 (November 30 2022) seconded by the round level at 140.00. The daily RSI deflated to the 41 region.
Resistance levels: 134.59 135.27 137.47 (4H chart)
Support levels: 131.99 129.92 129.50 (4H chart)
-638087940679012309.png)
AUDUSD
AUD/USD climbed to 2-day highs and flirted with the area of recent peaks just below 0.6900 the figure at the end of the week.
Indeed, price action around the Aussie dollar fell in line with the rest of its risk-associated peers and advanced sharply against the backdrop of the intense selling pressure in the greenback, which was rapidly magnified following the publication of the US labour market for the month of December.
That said, the pair managed to close the first week of the new year in the positive territory and extended the advance for the third week in a row. Looking at the weekly chart, spot retreated only in 2 weeks out of the last 12.
Extra support for AUD came from the generalized firm performance in the commodity complex, where copper prices rose to multi-day highs vs. the small daily pullback in the iron ore.
There were no data releases Down Under at the end of the week.
AUD/USD should leave behind the January peak at 0.6886 (January 4) to extend further north the ongoing rally and challenge the December 2022 high at 0.6893 (December 13) just before the September 2022 top at 0.6916 (September 13). Beyond this level, the pair could confront the psychological 0.7000 mark ahead of the weekly peak at 0.7008 (August 26). On the contrary, the January low at 0.6688 (January 3) emerges as the initial support of note prior to the December low at 0.6629 (December 20) and weekly lows at 0.6584 (November 21) and 0.6386 (November 10). The daily RSI advanced to the boundaries of the 60 level.
Resistance levels: 0.6886 0.6893 0.6916 (4H chart)
Support levels: 0.6722 0.6688 0.6650 (4H chart)
-638087944072338828.png)
GOLD
Prices of the ounce troy of the yellow metal closed the week in a solid tone and advanced to new tops around $1870 on Friday.
The deteriorated outlook in the greenback – particularly exacerbated after the NFP figures – in combination with the noticeable decline in US yields across the curve helped bullion to extend the rally for the third straight week and trade at shouting distance from the June 2022 highs near $1880.
The apparent loss of momentum in the US labour market reignited speculation that the Federal Reserve could step on the brake of its ongoing normalization process and enter an impasse in its tightening cycle, which should all morph into extra support for the non-yielder metal.
The continuation of the upside momentum in gold could prompt the June 2022 high to emerge on the horizon at $1879 (June 13) ahead of the May 2022 top at $1909 (May 5) and the April 2022 peak at $1998 (April 18). Then again, the resumption of the offered bias could revisit the key 200-day SMA at $1779 prior to the weekly low at $1773 (December 15) and the December low at $1765 (December 5). Further south appears the 55-day SMA at $1752 before the weekly low at $1727 (November 23), which remains propped up by the 100-day SMA at $1725. The loss of this level puts the 2022 low at $1614 (September 28) back on the traders’ radar ahead of the round level at $1600.
Resistance levels: $1869 $1879 $1909 (4H chart)
Support levels: $1825 $1797 $1784 (4H chart)
-638087945270234724.png)
CRUDE WTI
Prices of the barrel of the West Texas Intermediate (WTI) closed the first week with losses after three consecutive advances on the back of the persevering presence of recession fears.
Those concerns seem to have been intensified following the US Nonfarm Payrolls, which hinted at the idea that the US economy could be running out of steam, impacting on the prospects for the demand of crude oil.
Also hovering around oil’s price action remained the Chinese reopening amidst the relentless pick-up in COVID cases, while the sharp decline in the dollar did nothing to prevent the drop in prices of the commodity.
In the calendar, driller Baker Hughes reported that US total active oil rigs went down by three to 618 in the week to January 6.
Further weakness in prices of the WTI should face immediate target at the January low at $72.50 (January 5), which precedes the 2022 low at $70.10 (December 9) and the round level at $70.00. The breach of the latter could open the door to a visit to the weekly low at $66.15 (December 20 2021) prior to the 200-week SMA at $65.40 and the December 2021 low at $62.46 (December 2). In the opposite direction, occasional bullish attempts are expected to challenge the weekly high at $81.44 (January 3) before the December 2022 top at $83.32 (December 1) and the 100-day SMA at $83.56. The surpass of the latter exposes the $90.08 level (November 11 2022) ahead of the November 2022 peak at $93.73 and the key 200-day SMA at $93.95.
Resistance levels: $75.44 $77.13 $81.44 (4H chart)
Support levels: $72.42 $70.07 $66.11 (4H chart)
-638087946535400691.png)
GER40
Equities gauged by the German benchmark index DAX 40 rose to new 3-week highs past the 14600 mark on Friday and started the week on a strong foot.
Indeed, the loss of momentum in the flash inflation figures in the euro area seems to have reinforced the perception that the ECB could moderate its hawkish impulse when it comes to future interest rate hikes, which at the same time bolstered the optimism among investors.
In the domestic debt market, the 10-year Bund yields dropped to levels last traded back in mid-December in the sub-2.20% region.
In Germany, Factory Orders shrank at a monthly 5.3% in November and Retail Sales expanded 1.1% MoM in the same period.
The DAX 40 now trades closer to the December 2022 peak at 14675 (December 13). Beyond this level, the index could dispute the June 2022 high at 14709 (June 6) ahead of the March 2022 top at 14925 (March 29) and the 2022 peak at 16285 (January 5). Inversely, there is provisional contention at the 55-day SMA at 14008 prior to the December 2022 low at 13791 (December 20) and the key 200-day SMA at 13557. The loss of this region could trigger a probable pullback to the 100-day SMA at 13423 seconded by the November 2022 low at 13022 (November 3), the minor support at 12548 (October 21 2022) and the 2022 low at 11862 (September 28). The daily RSI picked up further pace and approached 64.
Best Performers: Siemens Energy AG, Linde PLC, Infineon
Worst Performers: Henkel VZO, Sartorius AG VZO, Siemens Healthineers
Resistance levels: 14610 14675 14709 (4H chart)
Support levels: 14263 14140 13791 (4H chart)
-638087961015106485.png)
NASDAQ
The tech benchmark Nasdaq 100 followed suit and advanced strongly in line with its US index peers at the end of the week.
In fact, the US tech sector derived strength from the generalized better tone in the risk complex, helped at the same time by the intense retracement in the greenback and a marked decline in US yields across the curve.
In case the recovery in the index picks up a more serious impulse, the Nasdaq 100 could revisit the January high at 11093 (January 3) followed by the weekly top at 11285 (December 21 2022) and the interim 55- and 100-day SMAs at 11362 and 11623, respectively. The breakout of this region could confront the December 2022 peak at 12166 (December 13) ahead of the key 200-day SMA at 12222 and the September 2022 high at 12752 (September 12). Conversely, the initial support of note remains at the December 2022 low at 10671 (December 22), which precedes the November 2022 low at 10632 (November 4). A deeper drop could put the 2022 low at 10440 (October 13) to the test prior to the weekly low at 10313 (July 24 2020). The daily RSI made a U-turn and rose past 46.
Top Gainers: Costco, Old Dominion Freight Line Inc, IDEXXX Labs
Top Losers: Enphase, JD.com Inc Adr, Rivian Automotive
Resistance levels: 11093 11285 11631 (4H chaD)
Support levels: 10742 10671 10632 (4H chart)
-638087949604769576.png)
DOW JONES
US equities tracked by the three major stock indices rose sharply on Friday and closed the first week of the new year with decent gains.
Indeed, expectations that the Federal Reserve could temper its current hawkishness and slow the pace of interest rate hikes boosted the optimism among investors and fueled the upside momentum in stocks.
The above appeared reinforced by mixed results from the US Nonfarm Payrolls and the lower-than-expected readings from the ISM Non-Manufacturing, while the sell-off in the dollar and diminishing US yields also added to the sentiment.
Overall, the Dow Jones advanced 2.13% to 33630, the S&P500 gained 2.28% to 3895 and the tech-heavy Nasdaq Composite climbed 2.56% to 10569.
If the Dow Jones accelerates its gains it could then attempt a challenge of the December 2022 peak at 34712 (December 13) ahead of the April 2022 high at 35492 and the February 2022 top at 35824 (February 9). Contrarily, the big magnet for bears emerges at the key 200-day SMA at 32420 seconded by the November 2022 low at 31727 (November 3) and the minor support at 30206 (October 21 2022). Down from here turns up the 2022 low at 28660 (October 13). The daily RSI leapt to the proximity of 55.
Top Performers: Intel, Walgreen Boots, Dow
Worst Performers: UnitedHealth, Home Depot, Chevron
Resistance levels: 33710 34395 34712 (4H chart)
Support levels: 32812 32573 32188 (4H chart)
-638087960102797624.png)
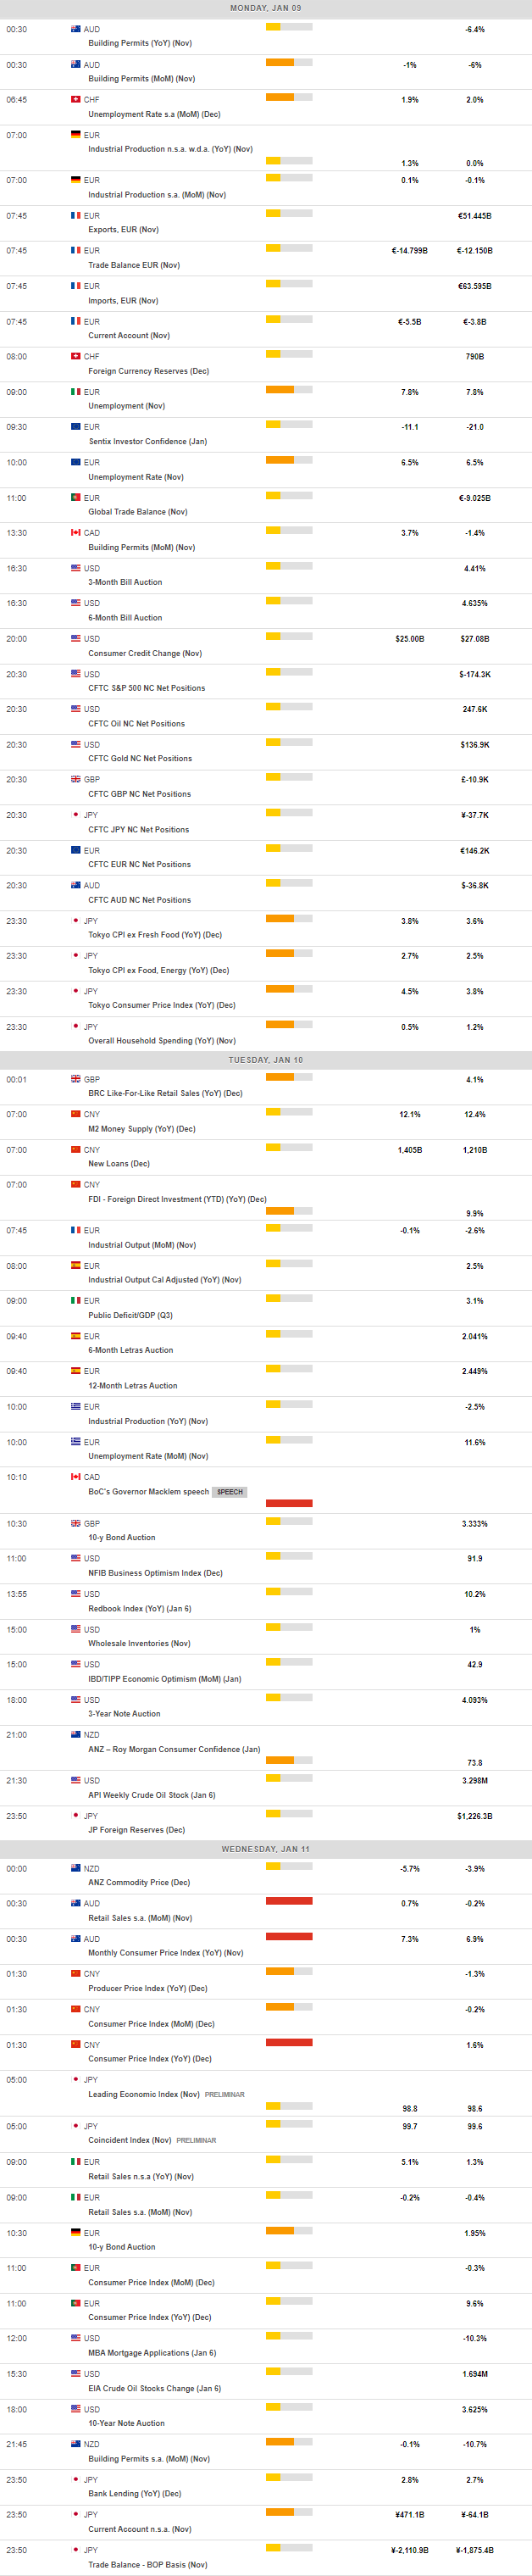
MACROECONOMIC EVENTS
All Information & Updates provided by:

All information relating to the financial markets available on this page has been prepared and issued by FXStreet (Forexstreet SL, Spain, Reg: B62498233) on the basis of publicly available information and all information believed to be reliable and does not conflict with Kuwaiti local laws, and all necessary care has been taken to before the company to ensure that the facts mentioned are correct from the source.
NCM Investment nor any of its directors or employees shall in any way be held responsible for the contents of this news, and the information contained on this page is intended only to provide clients with publicly available information and should not be construed as investment advice, report or analysis and/or constitute an offer or invitation to buy or sell financial instruments of any kind.
RISK WARNING: Forex and CFDs are highly risky leveraged products, as losses can exceed deposits. Please ensure you understand all the risks and take independent advice if necessary. NCM will segregate the clients based on the criteria of the regulator and its bylaws. NCM does not provide any advisory service; the material published does not constitute advice or a recommendation for a transaction in any financial instrument. NCM accepts no responsibility for any use of the content presented and any consequences of that use. Anyone acting on the information provided does so at their own risk.