
- Contact Us:
-

-

-

-


Daily Market Updates
10 Jan 2023
USDJPY
USD/JPY came under fresh downside pressure and revisited the 131.30 zone, or 3-day lows, on Monday. Indeed, spot extended the rejection from Friday’s multi-day peaks in the area just shy of 135.00 the figure.
The pair’s negative price action followed further deterioration of the dollar in combination with declining US yields across the curve, as speculation around a potential pause in the Fed’s tightening cycle continued to run high among market participants.
The Japanese calendar was empty on Monday, leaving the attention to Tuesday’s release of annualized Household Spending figures during November.
Extra losses in USD/JPY could now challenge the psychological 130.00 mark seconded by the weekly low at 129.50 (January 3) and the May 2022 low at 126.36 (May 24). The loss of the latter could pave the way for a deeper pullback to the weekly low at 121.27 (March 31 2022). Just the opposite, the January high at 134.77 (January 6) comes first before the key 200-day SMA at 136.48 and the weekly top at 138.17 (December 15 2022). If the pair clears this level it could then open the door to the 55-day SMA at 138.55 prior to the weekly peak at 139.89 (November 30 2022) and the round level at 140.00. The daily RSI lost the 40 grip.
Resistance levels: 132.65 134.77 134.99 (4H chart)
Support levels: 131.30 129.92 129.50 (4H chart)
-638088928930798449.png)
GBPUSD
The generalized and intense selling pressure around the greenback helped GBP/USD advance to fresh multi-week highs north of the 1.2200 hurdle at the beginning of the week.
Cable gathered extra steam and added to Friday’s equally strong rebound to finally revisit the 1.2200 zone in a context widely favourable to the risk-on mood amidst persistent investors’ repricing of a potential Fed’s pivot sooner than previously anticipated.
From the BoE, Chief Economist H.Pill suggested that some labour market indicators appear to have started to turn, adding that a slowing labour market may reduce the risk of inflation.
In the docket, BBA Mortgage Rate increased to 6.41% in December (from 5.88%), in what was the only data release scheduled across the Channel.
In light of the recent marked advance, GBP/USD is now expected to target the December 2022 high at 1.2446 (December 14) prior to the May 2022 top at 1.2666 (May 27) and the 200-week SMA at 1.2919. The breakout of the latter is seen exposing the psychological 1.3000 yardstick. On the opposite side, the January low at 1.1841 (January 6) offers initial contention ahead of the 50% Fibo retracement of the November-December rally at 1.1794 and the provisional 100-day SMA at 1.1670. South from emerges the 78.6% Fibo retracement at 1.1421. The daily RSI bounced beyond the 63 mark.
Resistance levels: 1.2209 1.2241 1.2446 (4H chart)
Support levels: 1.2124 1.1841 1.1778 (4H chart)
-638088928208787302.png)
AUDUSD
The upside momentum in AUD/USD remained everything but abated on Monday.
Indeed, spot climbed further north of 0.6900 the figure for the first time since late August 2022, always in response to the pronounced retracement in the dollar, while the generalized positive performance in the commodity complex also lent extra oxygen to the Aussie dollar.
In addition, further Chinese reopening continued to underpin the upside bias in AUD as well as commodities and industrial metals.
In Oz, preliminary figures showed Building Permits expected to have contracted 9.0% MoM in November and 15.1% over the last twelve months.
AUD/USD printed a new January high at 0.6949. The breakout of this level could put a test of the psychological 0.7000 mark back on the investors’ radar closely followed by the weekly top at 0.7008 (August 26). On the other hand, sellers face initial contention at the January low at 0.6688 (January 3) ahead of the December low at 0.6629 (December 20) and weekly lows at 0.6584 (November 21) and 0.6386 (November 10). The daily RSI leapt past the 63 hurdle.
Resistance levels: 0.6945 0.6956 0.7008 (4H chart)
Support levels: 0.6754 0.6722 0.6688 (4H chart)
-638088929511072869.png)
GOLD
Gold prices advanced past the $1880 mark per ounce troy for the first time since late May 2022 at the beginning of the week.
The dollar’s meltdown along with the extra weakness in US yields across the curve sustained the second consecutive daily gain in the yellow metal on Monday.
Collaborating with the upbeat sentiment among traders came the increasing perception that the Fed could pivot to a less hawkish stance when it comes to future interest rate raises.
Gold bulls now seem focused on the May 2022 peak at $1909 (May 5) seconded by the April 2022 high at $1998 (April 18) just before the psychological $2000 mark and the 2022 top at $2070 (March 8). On the contrary, there is a minor support level at $1825 (January 5). The breach of this level should prompt the key 200-day SMA at $1779 to emerge on the horizon ahead of the weekly low at $1773 (December 15) and the December low at $1765 (December 5). Down from here turns up the 55-day SMA at $1756 prior to the weekly low at $1727 (November 23), an area coincident with the 100-day SMA.
Resistance levels: $1881 $1909 $1919 (4H chart)
Support levels: $1825 $1797 $1784 (4H chart)
-638088930090064943.png)
CRUDE WTI
Optimism among traders after China reopened its borders lent legs to crude oil prices and sponsored a move to 3-day highs near the $77.00 mark per barrel of the West Texas Intermediate (WTI).
However, there are still plenty of doubts surrounding any meaningful bounce in WTI prices, as this same upbeat mood could rapidly morph into another source of weakness against the backdrop of the unabated increase in COVID cases along the country.
The sharp retracement in the greenback, in the meantime, also bolstered the upside bias in the commodity, while the currency is also expected to remain under scrutiny in light of the release of US inflation figures tracked by the CPI later in the week.
As usual, the API and the EIA will report on US crude oil inventories in the week to January 6.
A more meaningful bounce could motivate the WTI to confront the January top at $81.44 (January 3) ahead of the December 2022 peak at $83.32 (December 1), which appears propped up by the 100-day SMA at $83.41. The breakout of this region could put the $90.08 level (November 11 2022) back on the traders’ radar prior to the November 2022 high at $93.73, which is also reinforced by the key 200-day SMA at $93.79. On the flip side, the breakdown of the January low at $72.50 (January 5) is expected to put the 2022 low at $70.10 (December 9) to the test just before the round level at $70.00. South from here comes the weekly low at $66.15 (December 20 2021) followed by the 200-week SMA at $65.48 and the December 2021 low at $62.46 (December 2).
Resistance levels: $76.69 $77.00 $81.44 (4H chart)
Support levels: $72.42 $70.07 $66.11 (4H chart)
-638088931394678376.png)
GER40
The German stock index DAX 40 started its second consecutive week with gains, climbing at the same time to levels last seen back in mid-March 2022 just below the 15000 mark.
Indeed, the generalized optimism among traders was sustained by news that China will reopen its borders, reinforcing the idea of the emergence of pent-up demand.
In addition, diminishing US yields and the weaker dollar also added to the positive sentiment and were another factor propping up daily gains in European stock markets.
Speaking about yields, the German 10-year Bund yields retested the vicinity of the 2.30% region\, although the uptick fizzled out afterwards, leaving just a modest advance for the day.
In the domestic docket, Industrial Production expanded 0.2% in November vs. the previous month.
-638088935179006329.png)
The DAX 40 now faces the next up barrier at the March 2022 peak at 14925 (March 29) prior to the 2022 high at 16285 (January 5). Contrarily, the 55-day SMA at 14046 offers provisional contention ahead of the December 2022 low at 13791 (December 20) and the key 200-day SMA at 13558. A deeper drop from here could open the door to the 100-day SMA at 13436 before the November 2022 low at 13022 (November 3). Once breached, the minor support at 12548 (October 21 2022) could emerge as the next support prior to the 2022 low at 11862 (September 28). The daily RSI rose to the boundaries of the 68 level.
Best Performers: Sartorius AG VZO, Dr Ing hc F Porsche, Vonovia
Worst Performers: Fresenius Medical Care, Fresenius SE, E.ON SE
Resistance levels: 14832 14925 15542 (4H chart)
Support levels: 14388 14275 14163 (4H chart)
-638088932735263805.png)
NASDAQ
The tech reference index Nasdaq 100 added to Friday’s gains and advanced to 3-week highs just above the 11300 level at the beginning of the week, extending the auspicious start of the new year.
Indeed, the sentiment around tech stocks improved markedly on Monday following another negative session in US yields across the curve in tandem with expectations of a slower rate path by the Federal Reserve in the next months.
The sharp sell-off in the greenback also added to the upbeat mood in the risk complex and bolstered further the second straight advance in the index.
Immediately to the upside for the Nasdaq 100 now emerges the interim 55- and 100-day SMAs at 11365 and 11599, respectively. The trespass of this region could prompt a test of the December 2022 high at 12166 (December 13) to start shaping up prior to the key 200-day SMA at 12205 and the September 2022 top at 12752 (September 12). Inversely, the resumption of the selling bias should meet the next contention of note at the December 2022 low at 10671 (December 22), just ahead of the November 2022 low at 10632 (November 4) and the 2022 low at 10440 (October 13). Down from here emerges the weekly low at 10313 (July 24 2020). The daily RSI advanced past the 50 barrier.
Top Gainers: Lucid Group Inc, tesla Inc, AMD Inc
Top Losers: lululemon ahtletica inc, Regeneron Pharmaceuticals Inc, DexCom Inc
Resistance levels: 11304 11606 12166 (4H chart)
Support levels: 10696 10671 10632 (4H chart)
-638088933282115405.png)
DOW JONES
Equities measured by the Dow Jones advanced modestly but enough to extend Friday’s positive momentum and at the same time climb to levels last seen back in mid-December near the 34000 mark on Monday.
In fact, stocks rose on the back of the weaker dollar, shrinking US yields and rising expectations that the Federal Reserve could pivot to a slower pace of rate hikes in the next months.
Further positive news from China also underpinned the optimism among traders after the country announced its reopening of the borders.
All in all, the Dow Jones advanced 0.05% to 33635, the S&P500 rose 0.53% to 3915 and the tech-benchmark Nasdaq Composite gained 2.03% to 10784.
Extra recovery in the Dow Jones needs to clear the so far January peak at 33935 (January 9) to pave the way for a potential visit to the December 2022 high at 34712 (December 13) followed by the April 2022 top at 35492 and the February 2022 peak at 35824 (February 9). In the opposite direction, the critical 200-day SMA at 32417 continues to offer solid contention. If the Dow breaks below this zone, it could then confront the November 2022 low at 31727 (November 3) before the minor support at 30206 (October 21 2022) and the 2022 low at 28660 (October 13). The daily RSI looked stable around 55.
Top Performers: Salesforce Inc, Intel, Microsoft
Worst Performers: Merck&Co, J&J, Amgen
Resistance levels: 33935 34395 34712 (4H chart)
Support levels: 32812 32573 32185 (4H chart)
-638088932076055551.png)
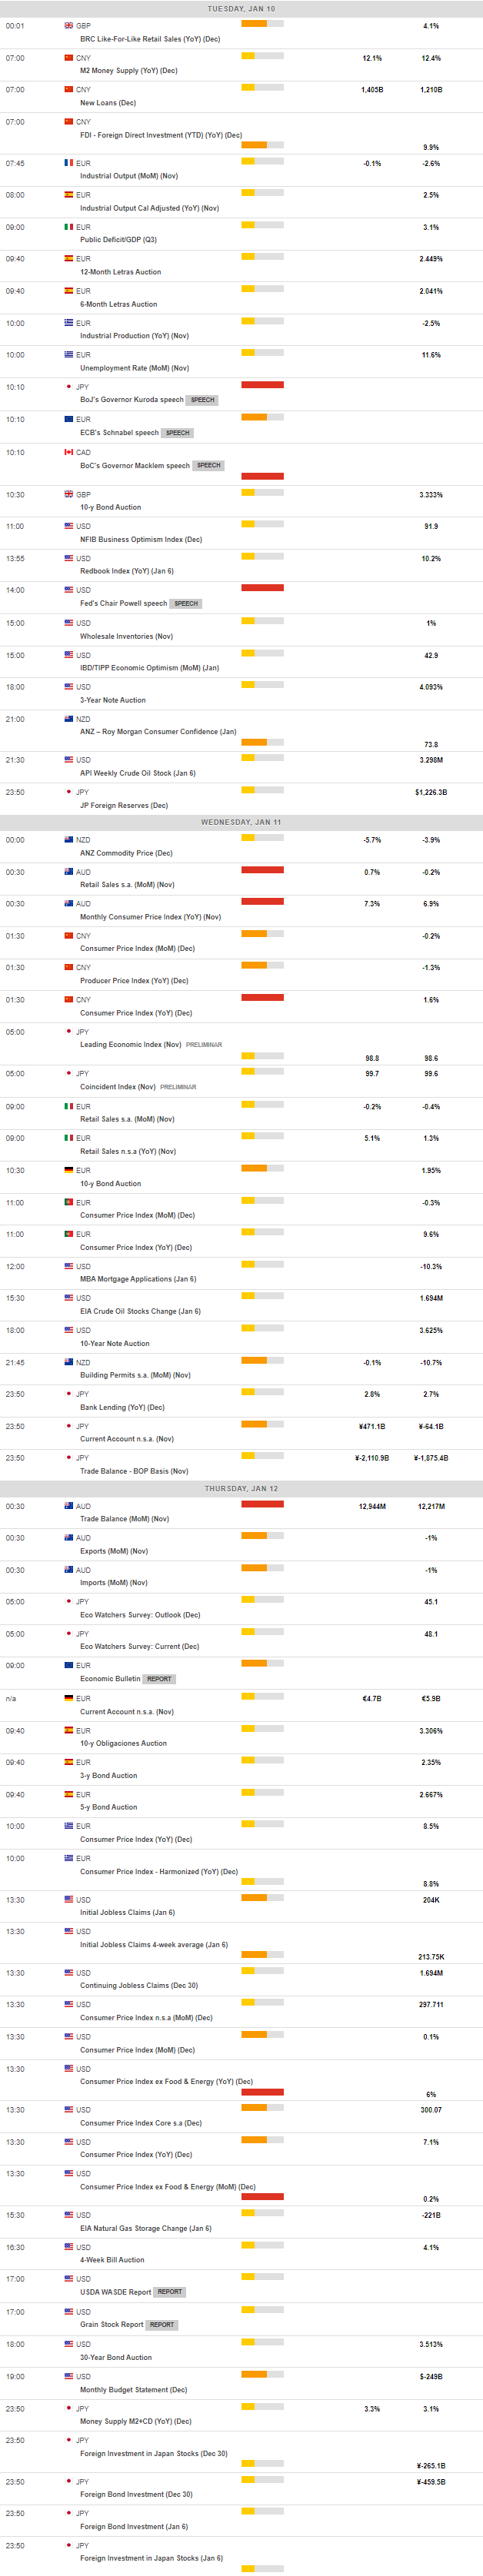
MACROECONOMIC EVENTS
All Information & Updates provided by:

All information relating to the financial markets available on this page has been prepared and issued by FXStreet (Forexstreet SL, Spain, Reg: B62498233) on the basis of publicly available information and all information believed to be reliable and does not conflict with Kuwaiti local laws, and all necessary care has been taken to before the company to ensure that the facts mentioned are correct from the source.
NCM Investment nor any of its directors or employees shall in any way be held responsible for the contents of this news, and the information contained on this page is intended only to provide clients with publicly available information and should not be construed as investment advice, report or analysis and/or constitute an offer or invitation to buy or sell financial instruments of any kind.
RISK WARNING: Forex and CFDs are highly risky leveraged products, as losses can exceed deposits. Please ensure you understand all the risks and take independent advice if necessary. NCM will segregate the clients based on the criteria of the regulator and its bylaws. NCM does not provide any advisory service; the material published does not constitute advice or a recommendation for a transaction in any financial instrument. NCM accepts no responsibility for any use of the content presented and any consequences of that use. Anyone acting on the information provided does so at their own risk.