
- Contact Us:
-

-

-

-


Daily Market Updates
11 Jan 2023
USDJPY
A noticeable uptick in US yields across the curve in addition to decent gains in the greenback allowed USD/JPY to leave behind two straight sessions with losses and advance past the 132.00 mark on Tuesday.
In fact, the sell-off in the dollar took a breather on Tuesday amidst some increasingly cautious tone ahead of the release of US inflation figures later in the week (January 12).
In the Japanese money market, the key 10-year JGB yields added to Monday’s marginal advance and trespassed the 0.50% level.
In Japan, Household Spending contracted at an annualized 1.2% in November and 0.9% vs. a month earlier. Additional data saw the Tokyo CPI rising 4% in the year to December and also 4% YoY when it came to the Tokyo Core CPI.
USD/JPY appears to have moved into a consolidative phase. That said, the January low at 129.50 (January 3) should emerge as the initial support prior to the May 2022 low at 126.36 (May 24) and the weekly low at 121.27 (March 31 2022). On the opposite side, the breakout of the January top at 134.77 (January 6) could put the key 200-day SMA at 136.58 back on the investors’ radar before the weekly peak at 138.17 (December 15 2022). The latter appears underpinned by the vicinity of the 55-day SMA at 138.27 ahead of the weekly high at 139.89 (November 30 2022) and the round level at 140.00. The daily RSI picked up pace and approached 42.
Resistance levels: 132.65 134.77 134.83 (4H chart)
Support levels: 131.30 129.92 129.50 (4H chart)
-638089739254512236.png)
GBPUSD
The late rebound in the greenback appears to have been sufficient to spark a corrective decline in GBP/USD after two consecutive sessions with gains.
Actually, Cable probed once again the 1.2200 neighbourhood – or monthly peaks - just to come under moderate selling pressure soon afterwards in tandem with the lack of a clear direction in the risk complex.
In the UK, BRC Retail Sales Monitor expanded 6.5% in the year to November and a 10-year Gilt auction came at 3.697%.
If bulls regain the initiative, GBP/USD is expected to revisit the January high at 1.2209 (January 9). Beyond this level, the pair should meet the next hurdle not before the December 2022 top at 1.2446 (December 14) ahead of the May 2022 peak at 1.2666 (May 27). Once cleared, the 200-week SMA at 1.2913 should emerge on the horizon before the psychological 1.3000 mark. Conversely, initial contention turns up at the January low at 1.1841 (January 6) followed by the temporary 100-day SMA at 1.1673 and the November 2022 low at 1.1142 (November 4). The daily RSI receded to the 55 area.
Resistance levels: 1.2209 1.2241 1.2446 (4H chart)
Support levels: 1.2128 1.1841 1.1778 (4H chart)
-638089738828372017.png)
AUDUSD
Following Monday’s advance to new 5-month highs around 0.6950, AUD/USD came under some marked selling pressure and slipped back well below 0.6900 the figure on Tuesday.
In fact, a decent bounce in the greenback managed to leave behind part of the recent pronounced sell-off and kept the price action in the commodity complex and the risk-linked galaxy depressed.
On the positive side for the Aussie dollar, latest news cited Chinese steel companies have resumed imports of Australian coal.
There were no data releases Down Under on Tuesday, leaving the attention to Wednesday’s Monthly CPI Indicator and Retail Sales, both for the month of November.
The resumption of the bullish sentiment should encourage AUD/USD to revisit the January top at 0.6949. Once cleared, spot could challenge the psychological 0.7000 level just before the weekly peak at 0.7008 (August 26). Just the opposite, the breach of the 200-day SMA at 0.6836 could prompt a potential test of the January low at 0.6688 (January 3) to start shaping up prior to the December low at 0.6629 (December 20) and weekly lows at 0.6584 (November 21) and 0.6386 (November 10). The daily RSI deflated south of the 60 yardstick.
Resistance levels: 0.6949 0.6956 0.7008 (4H chart)
Support levels: 0.6860 0.6758 0.6722 (4H chart)
-638089739638624621.png)
GOLD
Price action around the precious metal fell in line with the generalized consolidation seen in the global markets on Tuesday.
Against that, gold prices advanced modestly, although this was enough to keep the bullish performance well in place and print the third consecutive daily gain. It is worth mentioning that bullion has already gained more than 3% since lows recorded on January 5 near $1820 per ounce troy.
Tuesday’s positive session in the yellow metal was also accompanied by the inconclusive performance of the dollar and quite a marked rebound in US yields across the curve.
The next salient event for gold will be Thursday’s release of the US inflation figures for the month of December, which could have a direct impact on markets’ expectations of a Fed’s pivot.
Immediately to the upside for gold comes the so far January peak at $1881 (January 9) closely followed by the May 2022 high at $1909 (May 5). Further up appears the April 2022 top at $1998 (April 18) just ahead of the psychological $2000 mark and the 2022 peak at $2070 (March 8). On the other hand, the $1825 level (January 5) comes as an initial support prior to the more relevant 200-day SMA at $1778 and the weekly low at $1773 (December 15). The loss of this level exposes the December low at $1765 (December 5) before the 55-day SMA at $1760 and the weekly low at $1727 (November 23), an area reinforced by the 100-day SMA.
Resistance levels: $1881 $1909 $1919 (4H chart)
Support levels: $1825 $1797 $1784 (4H chart)
-638089739961709210.png)
CRUDE WTI
Prices of the barrel of the American benchmark for the sweet light crude oil charted the second straight session with gains on Tuesday.
The move higher in the commodity, however, could not surpass the $76.00 mark per barrel against the backdrop of alternating direction in the greenback, higher US yields and increasing prudence ahead of the release of US CPI on Thursday and its potential implications on the Fed’s tightening plans.
The upside bias in the commodity, in the meantime, appeared limited after the World Bank revised down its GDP projections for China, the US and the EU for the current year.
Later in the NA session, the API will report on US crude oil stockpiles in the week to January 6.
WTI prices look well supported by the January low at $72.50 (January 5) for the time being. The loss of this zone could spark a deeper decline to, initially, the 2022 low at $70.10 (December 9) just ahead of the round level at $70.00. The breakdown of the latter could pave the way for a move to the weekly low at $66.15 (December 20 2021) prior to the 200-week SMA at $65.48 and the December 2021 low at $62.46 (December 2). Then again, the next up barrier of note is not expected to emerge before the January peak at $81.44 (January 3) before the December 2022 high at $83.32 (December 1). The proximity of the 100-day SMA at $83.26 also underpins the latter. North from here comes the $90.08 level (November 11 2022) seconded by the 200-day SMA at $93.66 and the November 2022 top at $93.73.
Resistance levels: $75.83 $76.69 $81.44 (4H chart)
Support levels: $72.42 $70.07 $66.11 (4H chart)
-638089740863131559.png)
GER40
German equities gauged by the DAX 40 benchmark gave away part of the recent 2-day advance although they managed to keep business around the 14800 zone on Tuesday.
Indeed, the drop in the German index was no exception among its European peers, which closed in a sea of red following Monday’s multi-month peaks.
Further out, the broader sentiment among market participants remained sour despite the German Government Adviser M.Schnitzer suggesting that inflation in Germany has probably peaked, and added that there seems to be no need for the ECB to hike the policy rate by more than half percentage point at its next gathering.
Another positive session saw the German 10-year Bund yields adding to Monday’s gains past the 2.30% level.
There are no changes to the topside in the DAX 40, as the index continues to face the immediate resistance at the January peak at 14832 (January 9). The breakout of this level could prompt a visit to the March 2022 high at 14925 (March 29) to emerge on the horizon ahead of the 2022 top at 16285 (January 5). In the opposite direction, provisional support comes at the 55-day SMA at 14079 before the December 2022 low at 13791 (December 20) and the key 200-day SMA at 13559. Down from here lines up the 100-day SMA at 13451 ahead of the November 2022 low at 13022 (November 3). Further south comes the minor support at 12548 (October 21 2022) before the 2022 low at 11862 (September 28). The daily RSI rose eased a tad to the area below 67.
Best Performers: Bayer, Fresenius Medical Care, Deutsche Boerse
Worst Performers: Zalando SE, Siemens Energy AG, Fresenius SE
Resistance levels: 14832 14925 15542 (4H chart)
Support levels: 14388 14285 14179 (4H chart)
-638089744354000413.png)
NASDAQ
Tech equities gauged by the Nasdaq 100 followed their US peers and added to the ongoing rebound, revisiting once again the 11200 region on Tuesday.
Rising cautiousness among traders in light of the upcoming release of US inflation figures (Thursday) coupled with higher yields and the better performance in the dollar did not prevent the tech index to advance for the third consecutive session on Tuesday.
In the meantime, expectations of a pivot on the Fed’s monetary conditions seem to remain as the exclusive driver behind the improvement in the index in the last few sessions.
Bulls initially face the January high at 11304 (January 9) ahead of the temporary 55- and 100-day SMAs at 11364 and 11574, respectively. Beyond this zone, the Nasdaq 100 could confront the December 2022 top at 12166 (December 13) before the key 200-day SMA at 12187 and the September 2022 peak at 12752 (September 12). Contrarily, there are no support levels of note until the December 2022 low at 10671 (December 22) followed by the November 2022 low at 10632 (November 4) and the 2022 low at 10440 (October 13). The loss of the latter exposes the weekly low at 10313 (July 24 2020). The daily RSI surpassed the 49 barrier.
Top Gainers: Warner Bros Discovery Inc, Netflix, IDEXX Labs
Top Losers: Illumina, Broadcom, Fortinet
Resistance levels: 11304 11593 12166 (4H chart)
Support levels: 10696 10671 10632 (4H chart)
-638089745217023778.png)
DOW JONES
US equities navigated a consolidative range broadly in line with the rest of the global markets and the generalized cautious mood among investors.
Indeed, the three major US stock indices remained prudent, albeit with a bullish tilt on Tuesday, as market participants wait for further clues around the potential next moves by the Federal Reserve when it comes to its tightening cycle. On this, the US inflation figures measured by the CPI and out on Thursday will be crucial.
All around, the Dow Jones rose 0.14% to 33562, the S&P500 gained 0.23% to 3901 and the tech-heavy Nasdaq Composite advanced 0.40% to 10678.
Extra gains in the Dow Jones need to leave behind the so far January high at 33935 (January 9) to challenge the December 2022 top at 34712 (December 13) ahead of the April 2022 peak at 35492 and the February 2022 high at 35824 (February 9). On the flip side, the December 2022 low at 32573 (December 22) emerges as the initial barrier for sellers just before the critical 200-day SMA at 32410. Once the latter is cleared, the index could then put the November 2022 low at 31727 (November 3) to the test prior to the minor support at 30206 (October 21 2022) seconded by the 2022 low at 28660 (October 13). The daily RSI climbed a tad to the area above 54.
Top Performers: Goldman Sachs, Caterpillar, Amgen
Worst Performers: UnitedHealth, Coca-Cola, Apple
Resistance levels: 33935 34395 34712 (4H chart)
Support levels: 32812 32573 32181 (4H chart)
-638089744060822334.png)
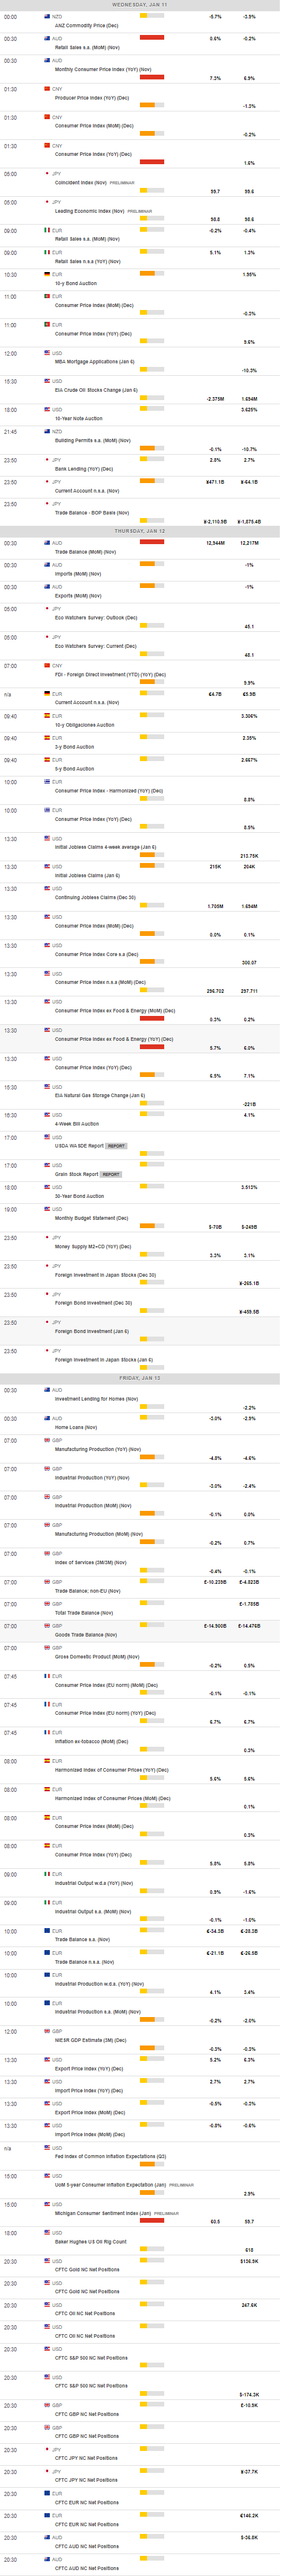
MACROECONOMIC EVENTS
All Information & Updates provided by:

All information relating to the financial markets available on this page has been prepared and issued by FXStreet (Forexstreet SL, Spain, Reg: B62498233) on the basis of publicly available information and all information believed to be reliable and does not conflict with Kuwaiti local laws, and all necessary care has been taken to before the company to ensure that the facts mentioned are correct from the source.
NCM Investment nor any of its directors or employees shall in any way be held responsible for the contents of this news, and the information contained on this page is intended only to provide clients with publicly available information and should not be construed as investment advice, report or analysis and/or constitute an offer or invitation to buy or sell financial instruments of any kind.
RISK WARNING: Forex and CFDs are highly risky leveraged products, as losses can exceed deposits. Please ensure you understand all the risks and take independent advice if necessary. NCM will segregate the clients based on the criteria of the regulator and its bylaws. NCM does not provide any advisory service; the material published does not constitute advice or a recommendation for a transaction in any financial instrument. NCM accepts no responsibility for any use of the content presented and any consequences of that use. Anyone acting on the information provided does so at their own risk.