
- Contact Us:
-

-

-

-


Daily Market Updates
12 Jan 2023
USDJPY
The tepid bias towards the risk-associated assets seems to have sustained another positive session in USD/JPY on Wednesday, this time surpassing the 132.00 mark to clinch new 3-day highs.
The uptick in the pair came despite US yields ticked lower and the greenback remained stuck within a very narrow range ahead of the release of US CPI later in the week. In the Japanese debt market, the JGB 10-year yields advanced modestly to the 0.51% region.
Data wise in the “Land of the Rising Sun”, preliminary readings expected the Coincident Index to have eased marginally to 99.1 in November and the Leading Economic Index to have dropped to 97.6 during the same period.
Extra recovery in USD/JPY now looks to retest the January peak at 134.77 (January 6) ahead of the key 200-day SMA at 136.57. Beyond this level emerges the weekly high at 138.17 (December 15 2022), which remains propped up by the 55-day SMA at 138.01. Further north turns up the weekly top at 139.89 (November 30 2022) prior to the round level at 140.00. Conversely, the breach of the January low at 129.50 (January 3) could put the May 2022 low at 126.36 (May 24) back on the investors’ radar ahead of the weekly low at 121.27 (March 31 2022). The daily RSI advanced tepidly to the proximity of 43.
Resistance levels: 132.87 134.77 134.83 (4H chart)
Support levels: 131.30 129.92 129.50 (4H chart)
-638090628984310142.png)
GBPUSD
Modest gains in the greenback despite the largely side-lined mood in the global assets were enough to keep the bearish note unchanged around the British pound and trigger the second consecutive daily pullback in GBP/USD, this time revisiting the 1.2100 neighbourhood on Wednesday, or 2-day lows.
Indeed, the USD Index (DXY) exchanged up and downs within the prevailing broader range bound theme, as market participants continued to wait for the release of crucial US inflation figures for the month of December, due on Thursday.
The next key data releases in the UK docket will be the GDP figures, Trade Balance results, Industrial Production and Manufacturing Production, all coming on Friday.
Further correction could see GBP/USD revisit the key 200-day SMA at 1.2002 closely followed by the interim 55-day SMA at 1.1951. The breach of this zone could open the door to a test of the January low at 1.1841 (January 6) seconded by the provisional 100-day SMA at 1.1677 and the November 2022 low at 1.1142 (November 4). Inversely, the immediate up barrier aligns at the January top at 1.2209 (January 9). Beyond the latter, Cable’s recovery could challenge the December 2022 peak at 1.2446 (December 14) before the May 2022 high at 1.2666 (May 27). Further up is seen the 200-week SMA at 1.2913 prior to the psychological 1.3000 yardstick. The daily RSI broke below the 55 level.
Resistance levels: 1.2209 1.2241 1.2446 (4H chart)
Support levels: 1.2100 1.2056 1.1841 (4H chart)
-638090628668906754.png)
AUDUSD
AUD/USD regained the smile and left behind Tuesday’s pullback, advancing once again past the 0.6900 barrier on Wednesday.
The still inconclusive price action around the greenback coupled with alternating risk appetite trends lent some wings to the Aussie dollar and motivated buyers to return to the pair midweek.
In addition, the broad-based recovery in the commodity complex collaborated with the pair’s upside following another session with gains in copper prices and the firm advance in the iron ore, this time surpassing the $120.00 mark per tonne for the first time since late June 2022.
AUD derived extra oxygen after the Australian docket showed the Monthly CPI Indicator rose to 7.3% in November – which underpinned expectations for extra rate hikes by the RBA – and Retail Sales expanded 1.4% MoM also in November.
Immediately to the upside for AUD/USD emerges the January peak at 0.6949, which is considered the last defense before an assault of the psychological 0.7000 mark, which at the same time precedes the weekly high at 0.7008 (August 26). On the opposite side, the pair could see its losses accelerate on a break below the key 200-day SMA at 0.6834. South from here turns up the January low at 0.6688 (January 3) ahead of the December low at 0.6629 (December 20) and weekly lows at 0.6584 (November 21) and 0.6386 (November 10). The daily RSI gathered steam and approached 61.
Resistance levels: 0.6925 0.6949 0.6956 (4H chart)
Support levels: 0.6859 0.6763 0.6722 (4H chart)
-638090629291139516.png)
GOLD
The upside momentum in the precious metal appeared everything but abated on Wednesday, as prices approached the $1890 level for the first time since early May 2022. The move, however, fizzled out later in the session and prompted bullion to settle around Tuesday’s close.
The persevering indecision in the dollar in combination with declining US yields across the curve fueled further the acute recovery in the yellow metal, which gradually trades closer to the key $2000 mark per ounce troy.
Moving forward, the upside bias in bullion could be put to the test in the next hours in light of the publication of US CPI for the month of December and its direct implication on investors’ expectations of a Fed’s pivot in the near-term future.
Gold now trades at shouting distance from the May 2022 top at $1909 (May 5). The surpass of this level could prompt the April 2022 peak at $1998 (April 18) to emerge on the horizon prior to the psychological $2000 mark and the 2022 high at $2070 (March 8). Just the opposite, there is a minor support level at $1825 (January 5) before the significant 200-day SMA at $1778 and the weekly low at $1773 (December 15). Down from here lines up the December low at $1765 (December 5), which is underpinned by the 55-day SMA and comes ahead of the weekly low at $1727 (November 23), an area equally propped up by the 100-day SMA.
Resistance levels: $1886 $1909 $1919 (4H chart)
Support levels: $1845 $1825 $1801 (4H chart)
-638090629656416550.png)
CRUDE WTI
WTI prices leapt to fresh multi-session highs near the $78.00 mark per barrel on Wednesday, rapidly setting aside Tuesday’s small pullback at the same time.
In fact, the sharp and also somewhat unexpected move higher in crude oil prices followed renewed optimism among traders on a probable weak print from US inflation on Thursday, allaying concerns of further tightening by the Fed.
In addition, the weaker dollar added to the upbeat note in the black gold along with
the ongoing Chinese reopening, all eclipsing a huge weekly build in crude oil inventories, as reported by the EIA earlier on Wednesday.
On the latter,the EIA reported an increase of 18.962M barrels in crude oil inventories in the week to January 6, while supplies at Cushing increased by 2.511M barrels, distillate stocks shrank by 1.069M barrels and gasoline stockpiles went up by 4.114M barrels.
WTI faces an initial up barrier at the weekly peak at $77.79 (January 11) ahead of the January high at $81.44 (January 3) and the December 2022 top at $83.32 (December 1). The breakout of this level could open the door to a test of the $90.08 level (November 11 2022) prior to the 200-day SMA at $93.53 and the November 2022 peak at $93.73. On the contrary, bears are expected to meet the initial obstacle at the January low at $72.50 (January 5) followed by the 2022 low at $70.10 (December 9), which precedes the round level at $70.00. Extra losses from here could revisit the weekly low at $66.15 (December 20 2021) ahead of the 200-week SMA at $65.48 and the December 2021 low at $62.46 (December 2).
Resistance levels: $77.79 $81.44 $83.32 (4H chart)
Support levels: $72.42 $70.07 $66.11 (4H chart)
-638090630423814722.png)
GER40
The German stock benchmark DAX 40 extended the optimism seen at the beginning of the new year and came just short of the key barrier at the 15000 mark on Wednesday, an area last traded back in February 2022.
Following Wednesday’s positive price action, the index continued to navigate the second consecutive week with gains, always on the back of the persistent appetite for the risk complex and fresh speculation that the ECB could pause/slow down its hiking cycle (despite the recent hawkish tone from some ECB rate setters).
Collaborating with the upside bias, latest news suggested that the German economy could avoid slipping into recession this year.
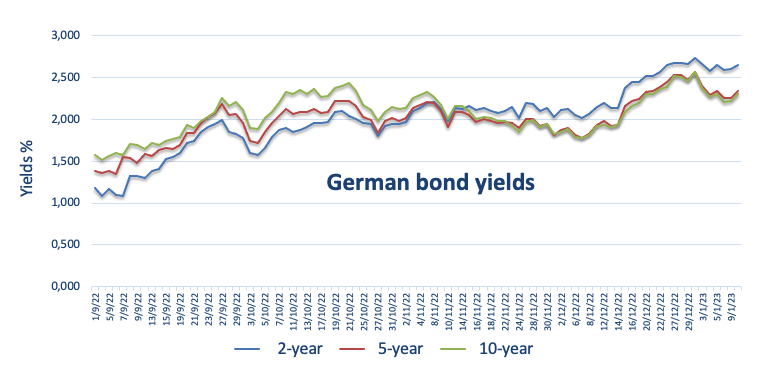
Daily gains in German equities were opposed to a corrective knee-jerk in the 10-year Bund yields after two consecutive daily advances.
The only release in the German docket was the 10-year Bund auction, which came at 2.25% (from 1.95%).
Further upside in the DAX 40 exposes a move to the 15000 mark, while a break above this key barrier should not meet the next resistance level until the 2022 peak at 16285 (January 5). On the flip side, the 55-day SMA at 14113 offers interim contention prior to the December 2022 low at 13791 (December 20) and the key 200-day SMA at 13562. South of the latter emerges the 100-day SMA at 13468 before the November 2022 low at 13022 (November 3) and the minor support at 12548 (October 21 2022). Extra losses from here should target the 2022 low at 11862 (September 28). The daily RSI flirted with the overbought territory near 70.
Best Performers: Vonovia, Siemens Energy AG, Merck
Worst Performers: Hannover Rueckversicherung SE, Covestro, Airbus Group
Resistance levels: 14965 15542 15614 (4H chart)
Support levels: 14692 14388 14285 (4H chart)
-638090630747493512.png)
NASDAQ
Further optimism lent wings to the US tech sector and sponsored another daily uptick in the Nasdaq 100, this time advancing to 3-week tops around 11300, an area coincident with the 55-day SMA.
While market participants appeared prudent ahead of the release of US CPI on Thursday, the vacillating price action around the dollar and the daily retracement in US yields across the curve sustained the persistent buying interest in the tech benchmark on Wednesday.
The breakout of the so far January top at 11358 (January 11) could pave the way for rapid visit to the temporary 55- and 100-day SMAs at 11365 and 11575, respectively. If the upside impulse picks up extra pace, then the December 2022 peak at 12166 (December 13) could return to the traders’ radar ahead of the key 200-day SMA at 12187 and the September 2022 high at 12752 (September 12). In the opposite direction, sellers should meet the initial support at the December 2022 low at 10671 (December 22), just before the November 2022 low at 10632 (November 4) and the 2022 low at 10440 (October 13). Down from the latter appears the weekly low at 10313 (July 24 2020). The daily RSI climbed further north of the 50 hurdle.
Top Gainers: Lucid Group, Atlassian Corp Plc, Airnb
Top Losers: Intuitive Surgical, DexCom, Moderna
Resistance levels: 11358 11582 12166 (4H chart)
Support levels: 10696, 10671, 10632 (4H chart)
-638090631582530029.png)
DOW JONES
Equities tracked by the Dow Jones remained largely side-lined for yet another session on Wednesday, as investors continued to wait for the release of the December US inflation figures gauged by the CPI (Thursday).
Further consolidation in the greenback and a corrective downtick in US yields also lent some legs to the upside bias in US stocks midweek.
Overall, the Dow Jones gained 0.42% to 33849, the S&P500 advanced 0.78% to 3949 and the tech-reference Nasdaq Composite rose 1.15% to 10866.
Dow Jones continues to face the immediate up barrier at the so far January top at 33935 (January 9). Once cleared, the index could then challenge the December 2022 peak at 34712 (December 13) en route to the April 2022 high at 35492 and the February 2022 top at 35824 (February 9). Then again, there are no support levels of relevance until the December 2022 low at 32573 (December 22), which appears reinforced by the critical 200-day SMA at 32411. The breach of this key region could prompt the November 2022 low at 31727 (November 3) to emerge on the horizon ahead of the minor support at 30206 (October 21 2022) and the 2022 low at 28660 (October 13). The daily RSI edged higher past the 57 yardstick.
Top Performers: Microsoft, Home Depot, Goldman Sachs
Worst Performers: Salesforce Inc, Verizon, Procter&Gamble
Resistance levels: 33935 34395 34712 (4H chart)
Support levels: 32812 32573 32180 (4H chart)
-638090632318803342.png)
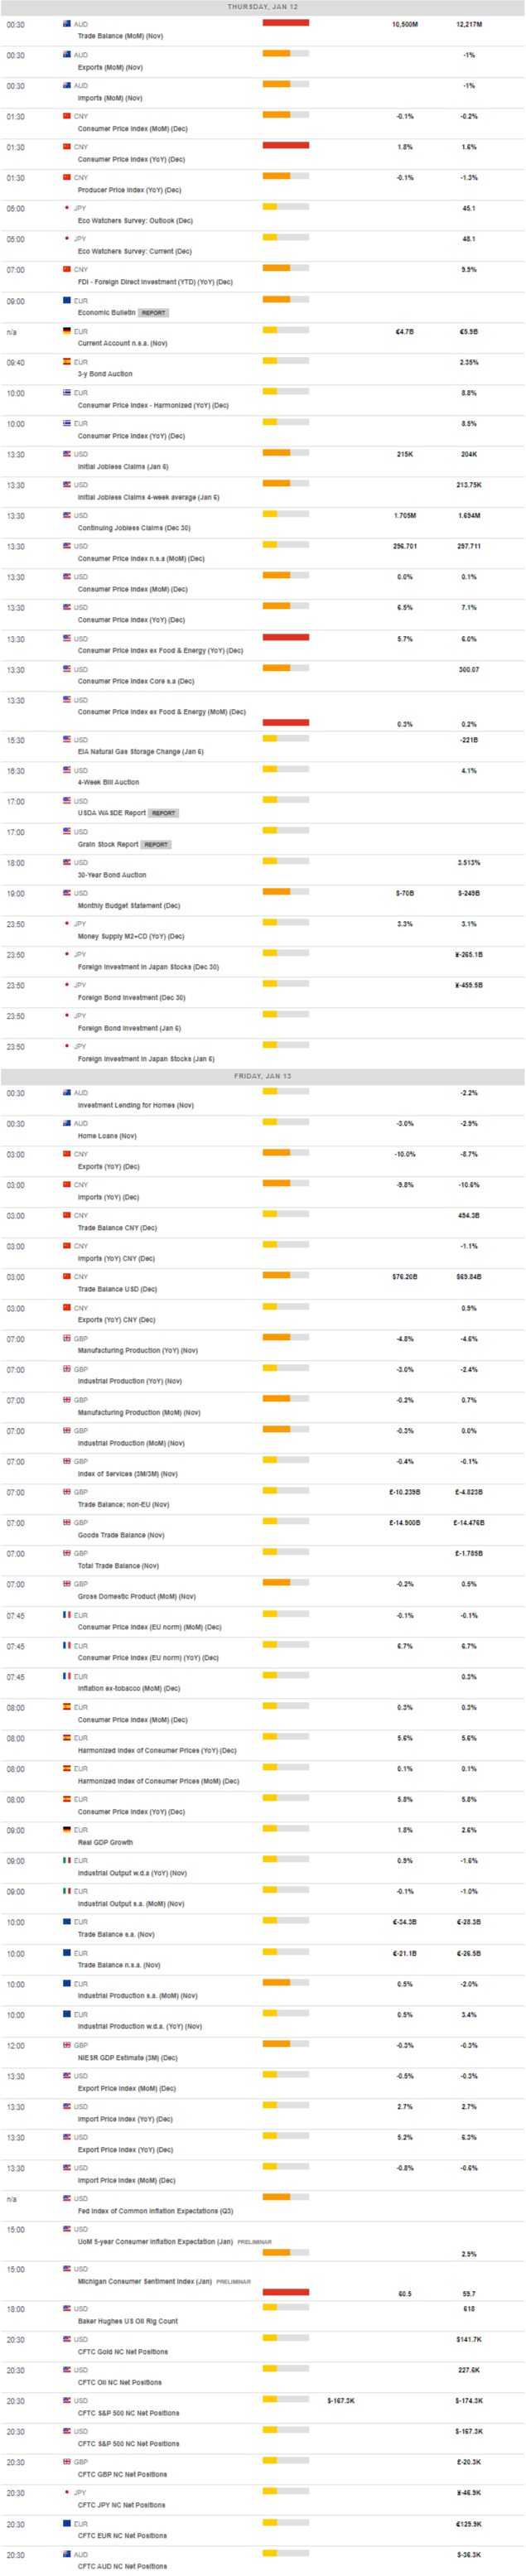
MACROECONOMIC EVENTS
All Information & Updates provided by:

All information relating to the financial markets available on this page has been prepared and issued by FXStreet (Forexstreet SL, Spain, Reg: B62498233) on the basis of publicly available information and all information believed to be reliable and does not conflict with Kuwaiti local laws, and all necessary care has been taken to before the company to ensure that the facts mentioned are correct from the source.
NCM Investment nor any of its directors or employees shall in any way be held responsible for the contents of this news, and the information contained on this page is intended only to provide clients with publicly available information and should not be construed as investment advice, report or analysis and/or constitute an offer or invitation to buy or sell financial instruments of any kind.
RISK WARNING: Forex and CFDs are highly risky leveraged products, as losses can exceed deposits. Please ensure you understand all the risks and take independent advice if necessary. NCM will segregate the clients based on the criteria of the regulator and its bylaws. NCM does not provide any advisory service; the material published does not constitute advice or a recommendation for a transaction in any financial instrument. NCM accepts no responsibility for any use of the content presented and any consequences of that use. Anyone acting on the information provided does so at their own risk.