
- Contact Us:
-

-

-

-


Daily Market Updates
13 Jan 2023
USDJPY
USD/JPY collapsed to 7-month lows and slipped back below the 129.00 support on Thursday.
Indeed, the pronounced sell-off in the dollar and lower US yields across the curve weighed on the pair, while further downside pressure also came after news cited the likelihood that the BoJ could evaluate its ultra-accommodative monetary stance at its next meeting, which bolstered the demand for the safe haven yen.
On the latter, and according to Japanese newspaper Yomiuri, the BoJ is expected to assess the consequences of its huge monetary policy easing at its upcoming event on January 18.
In Japan, Bank Lending expanded 2.7% in the year to December and the Current Account surplus rose to ¥1803.6B in November. In addition, the Eco Watchers Survey Current eased to 47.9 and the Eco Watchers Survey Outlook rose to 47 in December.
If the selling pressure gathers extra impulse, then the door could open for USD/JPY to revisit the January low at 128.85 (January 12) prior to the May 2022 low at 126.36 (May 24) and the weekly low at 121.27 (March 31 2022). Inversely, the resumption of the bid bias is predicted to retarget the January high at 134.77 (January 6) seconded by the key 200-day SMA at 136.61. Once this region is cleared, the 55-day SMA at 137.76 should come next ahead of the weekly top at 138.17 (December 15 2022) and the weekly peak at 139.89 (November 30 2022). Further up emerges the round level at 140.00 before the 100-day SMA at 140.73. The daily RSI lost the grip and approached the 33 region.
Resistance levels: 132.87 134.42 134.77 (4H chart)
Support levels: 128.85 126.36 125.08 (4H chart)
-638091471381799031.png)
GBPUSD
Fresh oxygen for the risk complex propelled GBP/USD to new multi-week highs near 1.2250 on Thursday.
Indeed, the steep pullback in the greenback sponsored the strong resumption of the buying interest around the British pound and lifted Cable well past 1.2200 the figure in the second half of the week.
The UK calendar was empty on Thursday, leaving all the attention to Friday’s release of GDP readings, Trade Balance results, Industrial Production and Manufacturing Production.
Immediately to the upside for GBP/USD now comes the December 2022 high at 1.2446 (December 14) seconded by the May 2022 top at 1.2666 (May 27). The surpass of the latter could put the 200-week SMA at 1.2913 back on the radar before the psychological 1.3000 mark. Contrarily, the key 200-day SMA at 1.1997 is expected to offer decent contention just ahead of the provisional 55-day SMA at 1.1963 and the January low at 1.1841 (January 6). The breach of this level exposes the interim 100-day SMA at 1.1680 followed by the November 2022 low at 1.1142 (November 4). The daily RSI broke above the 58 mark.
Resistance levels: 1.2246 1.2446 1.2599 (4H chart)
Support levels: 1.2133 1.2084 1.1841 (4H chart)
-638091470893020889.png)
AUDUSD
AUD/USD added to Wednesday’s gains and reclaimed once again the area above the 0.6900 hurdle on Thursday.
Indeed, the pronounced drop in the dollar sponsored the second consecutive daily gains in the pair, which poked with recent highs near the 0.6950 zone also helped by the solid performance of the commodity complex.
On the latter, copper prices extended the uptrend and the iron ore clinched modest gains always above the $120.00 mark per tonne.
Data wise in Oz, the trade surplus increased to A$13.201B in November, with Exports and Imports contracting 0.4% and 1.5%, respectively, from a month earlier.
If AUD/USD breaks above the January high at 0.6984, it could then dispute the psychological 0.7000 level just ahead of the weekly top at 0.7008 (August 26). Further north lines up the August 2022 peak at 0.7136 (August 11). Conversely, the breach of the key 200-day SMA at 0.6831 should spark a deeper retracement to the January low at 0.6688 (January 3) prior to the December low at 0.6629 (December 20) and weekly lows at 0.6584 (November 21) and 0.6386 (November 10). The daily RSI gathered pace and advanced north of 69.
Resistance levels: 0.6984 0.7008 0.7136 (4H chart)
Support levels: 0.6869 0.6767 0.6722 (4H chart)
-638091471876340497.png)
GOLD
The dollar debilitated further in the wake of the release of US CPI and lifted prices of the ounce troy of the precious metal to fresh peaks past the $1900 mark for the first time since early May 2022 on Thursday.
Indeed, the greenback accelerated its losses after another decline in US inflation figures underpinned speculation of a Fed’s pivot sooner than previously anticipated, while extra support for the yellow metal came from a deeper retracement in US yields across the curve.
Immediately to the upside for gold now emerges the May 2022 peak at $1909 (May 5). Beyond the latter lines up the April 2022 high at $1998 (April 18) ahead of the psychological $2000 mark and the 2022 top at $2070 (March 8). On the opposite side, the $1825 (January 5) level comes as a minor support before the more relevant 200-day SMA at $1778 and the weekly low at $1773 (December 15). The breach of this zone could put the December low at $1765 (December 5) back on the traders’ radar seconded by the weekly low at $1727 (November 23), which appears reinforced by the 100-day SMA.
Resistance levels: $1901 $1909 $1919 (4H chart)
Support levels: $1867 $1825 $1806 (4H chart)
-638091472436686382.png)
CRUDE WTI
Prices of the American benchmark for the sweet light crude oil posted its second consecutive session with gains on Thursday, this time briefly breaking above the $79.00 mark per barrel.
Renewed hopes on a US soft landing in combination with positive demand prospects in response to the reopening in China and further bans against Russian oil helped the commodity clinch another session with gains on Thursday.
In addition, the lower US inflation figures in the last month of 2022 also prompted a sharp sell-off in the dollar, which eventually added to the bullish move in crude oil prices.
Next on the upside for the WTI aligns the January top at $81.44 (January 3) seconded by the December 2022 peak at $83.32 (December 1). Above the latter comes the $90.08 level (November 11 2022) ahead of the 200-day SMA at $93.42 and the November 2022 high at $93.73. On the other hand, there are no support levels of note until the January low at $72.50 (January 5), which precedes the 2022 low at $70.10 (December 9) and the round level at $70.00. South from here turns up the weekly low at $66.15 (December 20 2021) prior to the 200-week SMA at $65.50 and the December 2021 low at $62.46 (December 2).
Resistance levels: $79.11 $81.44 $83.32 (4H chart)
Support levels: $77.07 $76.70 $73.81 (4H chart)
-638091473681886187.png)
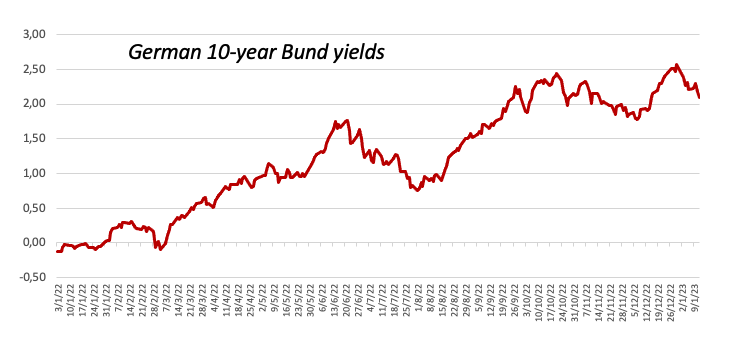
GER40
German equities tracked by the domestic DAX 40 rose for the second session in a row on Thursday.
Indeed, stocks not only extended the auspicious start of the new year for yet another session, but also reclaimed the area above the 15000 mark for the first time since late February 2022.
The move higher in the German stock market came in line with the broader upside bias in the rest of the European peers and propped up by strong demand prospects coming mainly from the reopening in China and recent views that the region could avoid a recession.
In Germany, the Current Account surplus widened to €16.9B in November (from €5.7B).
In the meantime, the 10-year Bund yields retreated further and revisited the 2.10% region, or 4-week lows.
The DAX 40 finally left behind the key 15000 barrier. That said, the next hurdle of relevance is not expected before the 2022 high at 16285 (January 5). Then again, the 55-day SMA at 14147 should hold the initial test ahead of the December 2022 low at 13791 (December 20) and the key 200-day SMA at 13565. Just below the latter aligns the 100-day SMA at 13487 ahead of the November 2022 low at 13022 (November 3) and the minor support at 12548 (October 21 2022). The 2022 low at 11862 (September 28) is expected to come next. The daily RSI entered the overbought territory near 72.
Best Performers: RWE AG ST, Zalando SE, Airbus Group
Worst Performers: Symrise AG, Merck, Covestro
Resistance levels: 15095 15542 15614 (4H chart)
Support levels: 14484 14267 13873 (4H chart)
-638091474892912860.png)
NASDAQ
The Nasdaq 100 climbed to multi-week peaks and flirted with the 11500 region on Thursday, advancing for the fifth session in a row and poking with the key 200-week SMA at the same time.
Declining US yields following further cooling of US inflation in combination with the intense sell-off in the dollar all lent extra wings to the risk complex and the tech sector.
Collaborating with the upside bias in the index and the rest of its peers, speculation that the Fed could now slow the pace of the future interest rate hikes continued to run high among traders.
The Nasdaq 100 now faces an immediate up barrier at the 100-day SMA at 11537. The surpass of this area could prompt a potential visit to the December 2022 high at 12166 (December 13) to emerge on the horizon. This region appears supported by the key 200-day SMA at 12153 and comes before the September 2022 top at 12752 (September 12). On the flip side, initial contention appears at the December 2022 low at 10671 (December 22) closely followed by the November 2022 low at 10632 (November 4) and the 2022 low at 10440 (October 13). The breakdown of this level could put the weekly low at 10313 (July 24 2020) back on the investors’ radar. The daily RSI rose to the proximity of the 58 level.
Top Gainers: Cognizant A, MercadoLibre, Airbnb
Top Losers: Zscaler, Illumina, Cintas
Resistance levels: 11487 11551 12166 (4H chart)
Support levels: 10696 10671 10632 (4H chart)
-638091475323603595.png)
DOW JONES
US equities surpassed the key 34000 mark for the first time since mid-December when measured by the Dow Jones on Thursday.
Indeed, the upbeat mood among investors was boosted by another decline in US inflation figures, which at the same time reinforced the view of a Fed’s pivot now sooner than previously estimated.
In the wake of the publication of the US CPI, the probability of a 25 bps rate hike by the Fed at the February gathering climbed above 90%. This scenario was underpinned by later comments from FOMC’s Harker, while his colleague Bullard suggested the Fed must raise rates beyond 5% as soon as possible.
All in all, the Dow Jones rose 0.84% to 34257, the S&P500 gained 0.55% to 3991 and the tech-heavy Nasdaq Composite advanced 0.64% to 11001.
The continuation of the current recovery in the Dow Jones now targets the December 2022 high at 34712 (December 13) prior to the April 2022 top at 35492 and followed by the February 2022 peak at 35824 (February 9). On the contrary, the 55-day SMA at 33357 should offer initial and temporary contention followed by the December 2022 low at 32573 (December 22) and the critical 200-day SMA at 32403. A deeper pullback could see the index revisiting the November 2022 low at 31727 (November 3) before the minor support at 30206 (October 21 2022) and the 2022 low at 28660 (October 13). The daily RSI improved further and left behind the 62 mark.
Top Performers: Walt Disney, Boeing, Caterpillar
Worst Performers: Amgen, Coca-Cola, Walmart
Resistance levels: 34292 34712 35492 (4H chart)
Support levels: 33444 32573 32181 (4H chart)
-638091474415495715.png)
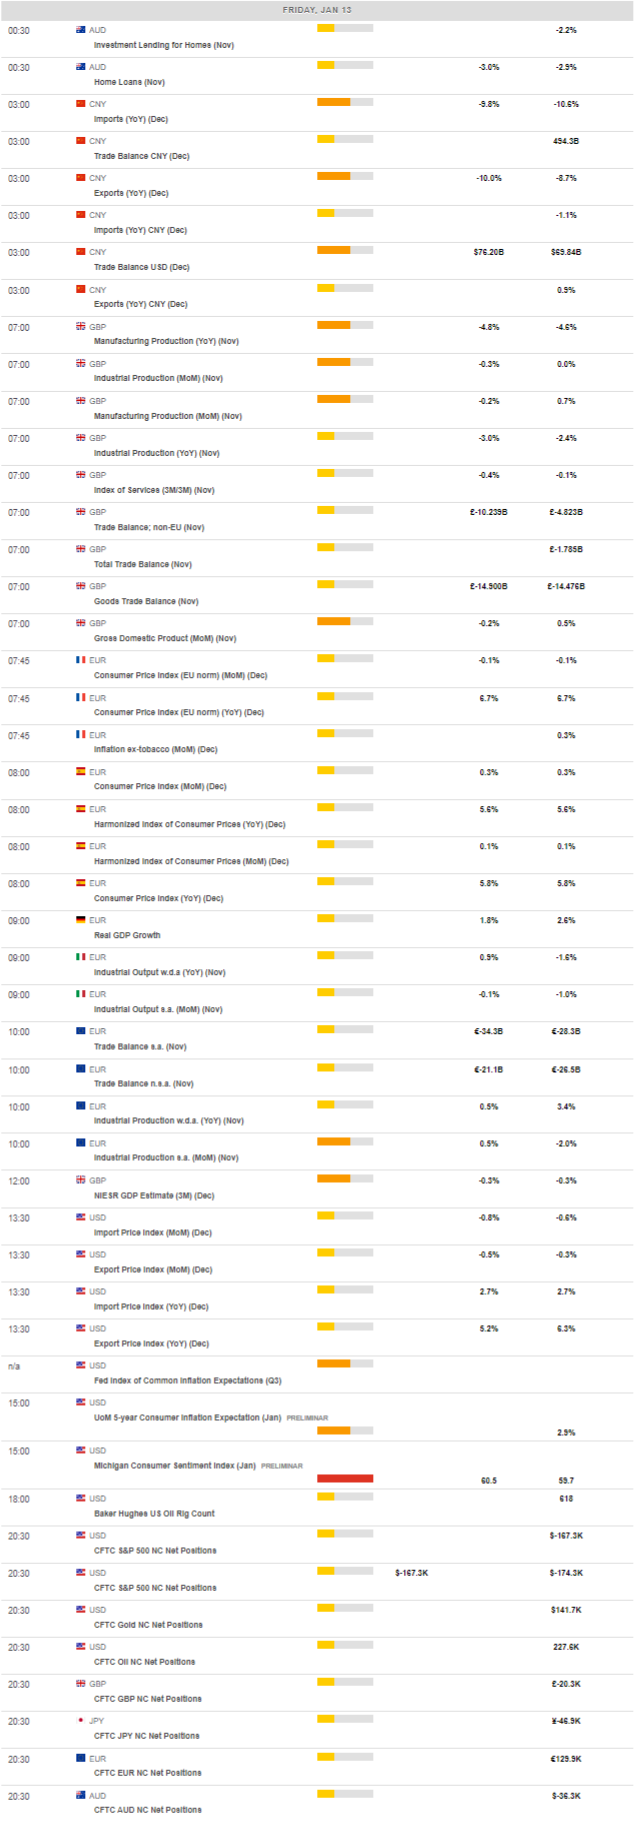
MACROECONOMIC EVENTS
All Information & Updates provided by:

All information relating to the financial markets available on this page has been prepared and issued by FXStreet (Forexstreet SL, Spain, Reg: B62498233) on the basis of publicly available information and all information believed to be reliable and does not conflict with Kuwaiti local laws, and all necessary care has been taken to before the company to ensure that the facts mentioned are correct from the source.
NCM Investment nor any of its directors or employees shall in any way be held responsible for the contents of this news, and the information contained on this page is intended only to provide clients with publicly available information and should not be construed as investment advice, report or analysis and/or constitute an offer or invitation to buy or sell financial instruments of any kind.
RISK WARNING: Forex and CFDs are highly risky leveraged products, as losses can exceed deposits. Please ensure you understand all the risks and take independent advice if necessary. NCM will segregate the clients based on the criteria of the regulator and its bylaws. NCM does not provide any advisory service; the material published does not constitute advice or a recommendation for a transaction in any financial instrument. NCM accepts no responsibility for any use of the content presented and any consequences of that use. Anyone acting on the information provided does so at their own risk.