
- Contact Us:
-

-

-

-


Daily Market Updates
18 Jan 2023
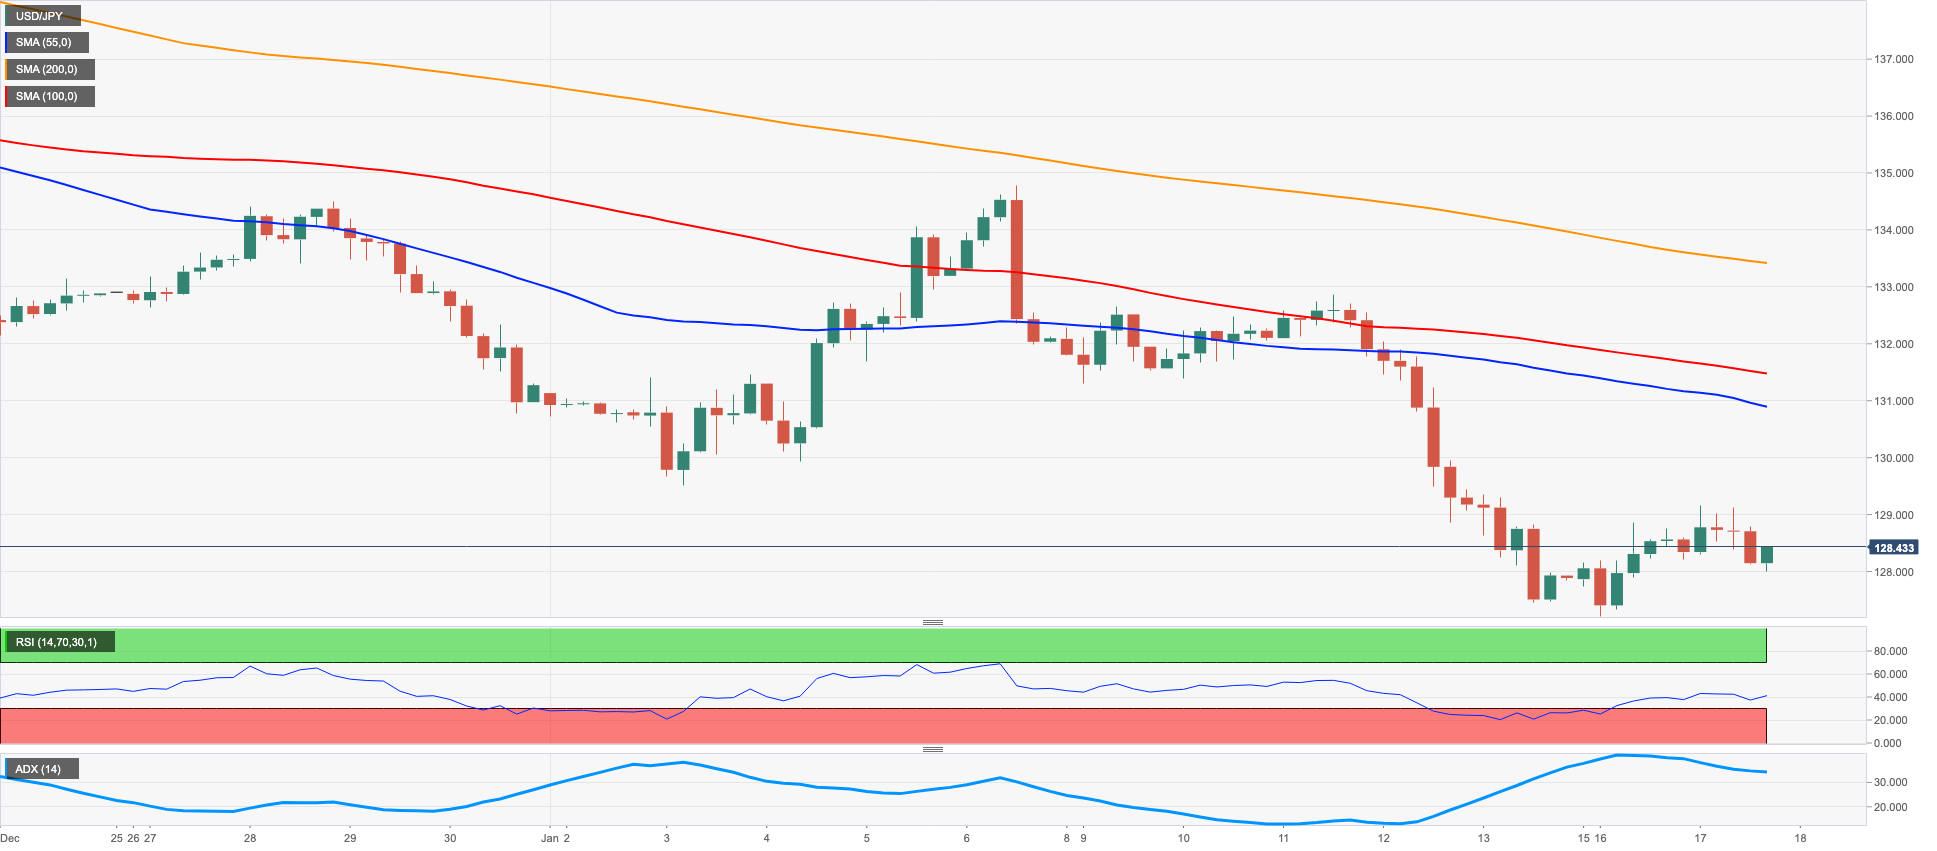
USDJPY
The improved appetite for the risky assets puts the Japanese yen under pressure, although USD/JPY ended up giving away the initial climb to the area beyond the 129.00 mark on Tuesday, fading part of Monday’s advance.
The pair reversed Monday’s gains after briefly trespassing the key 129.00 hurdle on the back of the intense downside in the dollar and the downside bias in US yields across the curve.
In the Japanese money market, the 10-year JGB yields climbed to fresh tops in the boundaries of the 0.60% level, an area last seen back in June 2014, just to return to the 0.50% neighbourhood afterwards and ahead of the key BoJ event due later in the week.
In the Japanese docket, the Tertiary Industry Index disappointed traders after it contracted at a monthly 0.2% in November.
USD/JPY could see its losses accelerate in case it breaks below the January low at 127.21 (January 16), which should open the door to a visit to the May 2022 low at 126.36 (May 24) prior to the weekly low at 121.27 (March 31 2022). On the flip side, the next up barrier aligns at the January peak at 134.77 (January 6). The surpass of this level could prompt the key 200-day SMA at 136.65 to emerge on the horizon seconded by weekly highs at 138.17 (December 15 2022) and 139.89 (November 30 2022), all preceding the key round level at 140.00. The daily RSI debilitated slightly to the 33 zone.
Resistance levels: 129.16 131.05 132.87 (4H chart)
Support levels: 127.21 126.36 125.08 (4H chart)
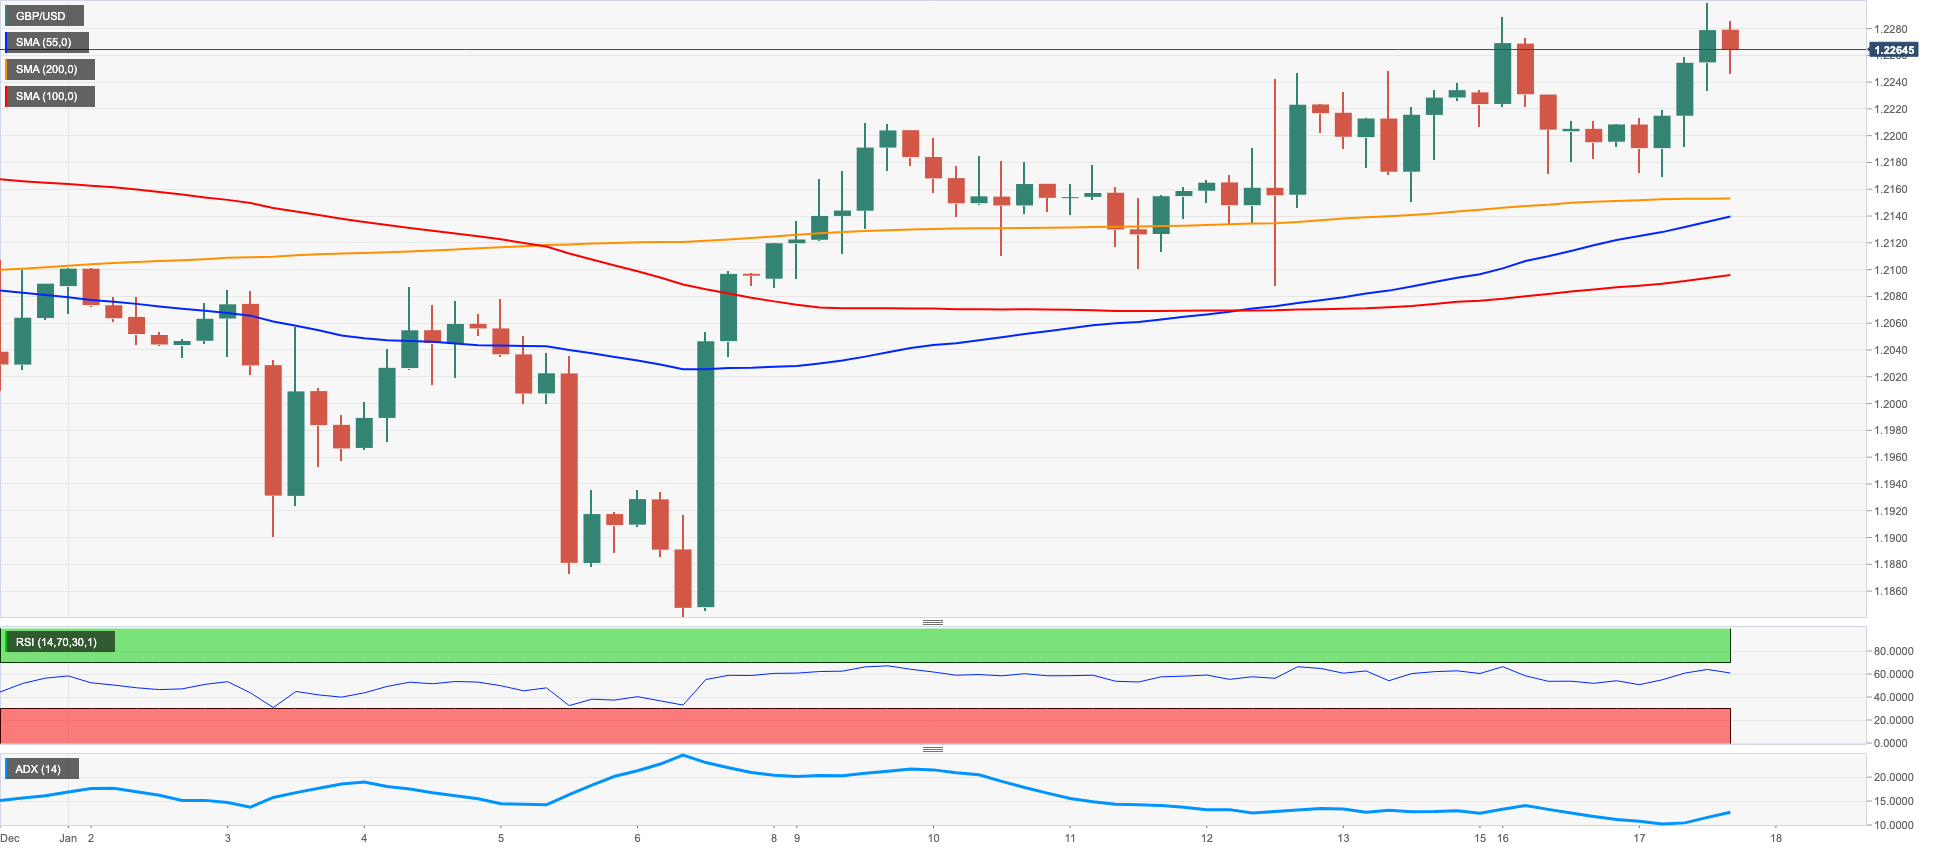
GBPUSD
The resumption of the selling bias in the US dollar lent further legs to the recovery in the risk-linked galaxy on Tuesday and sparked a marked move higher in GBP/USD, this time revisiting 1.2300 the figure.
In fact, the risk complex saw its buying interest reinvigorated in response to better-then-expected results from the Chinese calendar early on Tuesday, helping Cable to reverse the pessimism seen at the beginning of the week and favour the continuation of the so far multi-day consolidative move in the upper end of the range.
The upbeat mood around the Sterling was also underpinned by positive data releases from the UK labour market report, where the jobless rate held steady at 3.7% in November and the Employment Change rose by 27K people in the same month, more than initially estimated. More from the report saw Average Earnings inc Bonus expand 6.4% YoY in the three months ended in November and the Claimant Count Change rose by 19.7K persons in December.
The January peak at 1.2300 (January 17) is now deemed as the next hurdle of note for GBP/USD in case the rebound picks up a more serious pace. Once the pair clears that level, it could then challenge the December 2022 high at 1.2446 (December 14) prior to the May 2022 top at 1.2666 (May 27). North from here comes the key 200-week SMA at 1.2908 just ahead of the psychological 1.3000 level. By contrast, a drop below the key 200-day SMA at 1.1985 could spark a deeper decline to the January low at 1.1841 (January 6) ahead of the provisional 100-day SMA, today at 1.1696. The daily RSI improved to the proximity of 60.
Resistance levels: 1.2300 1.2446 1.2599 (4H chart)
Support levels: 1.2152 1.2084 1.1841 (4H chart)
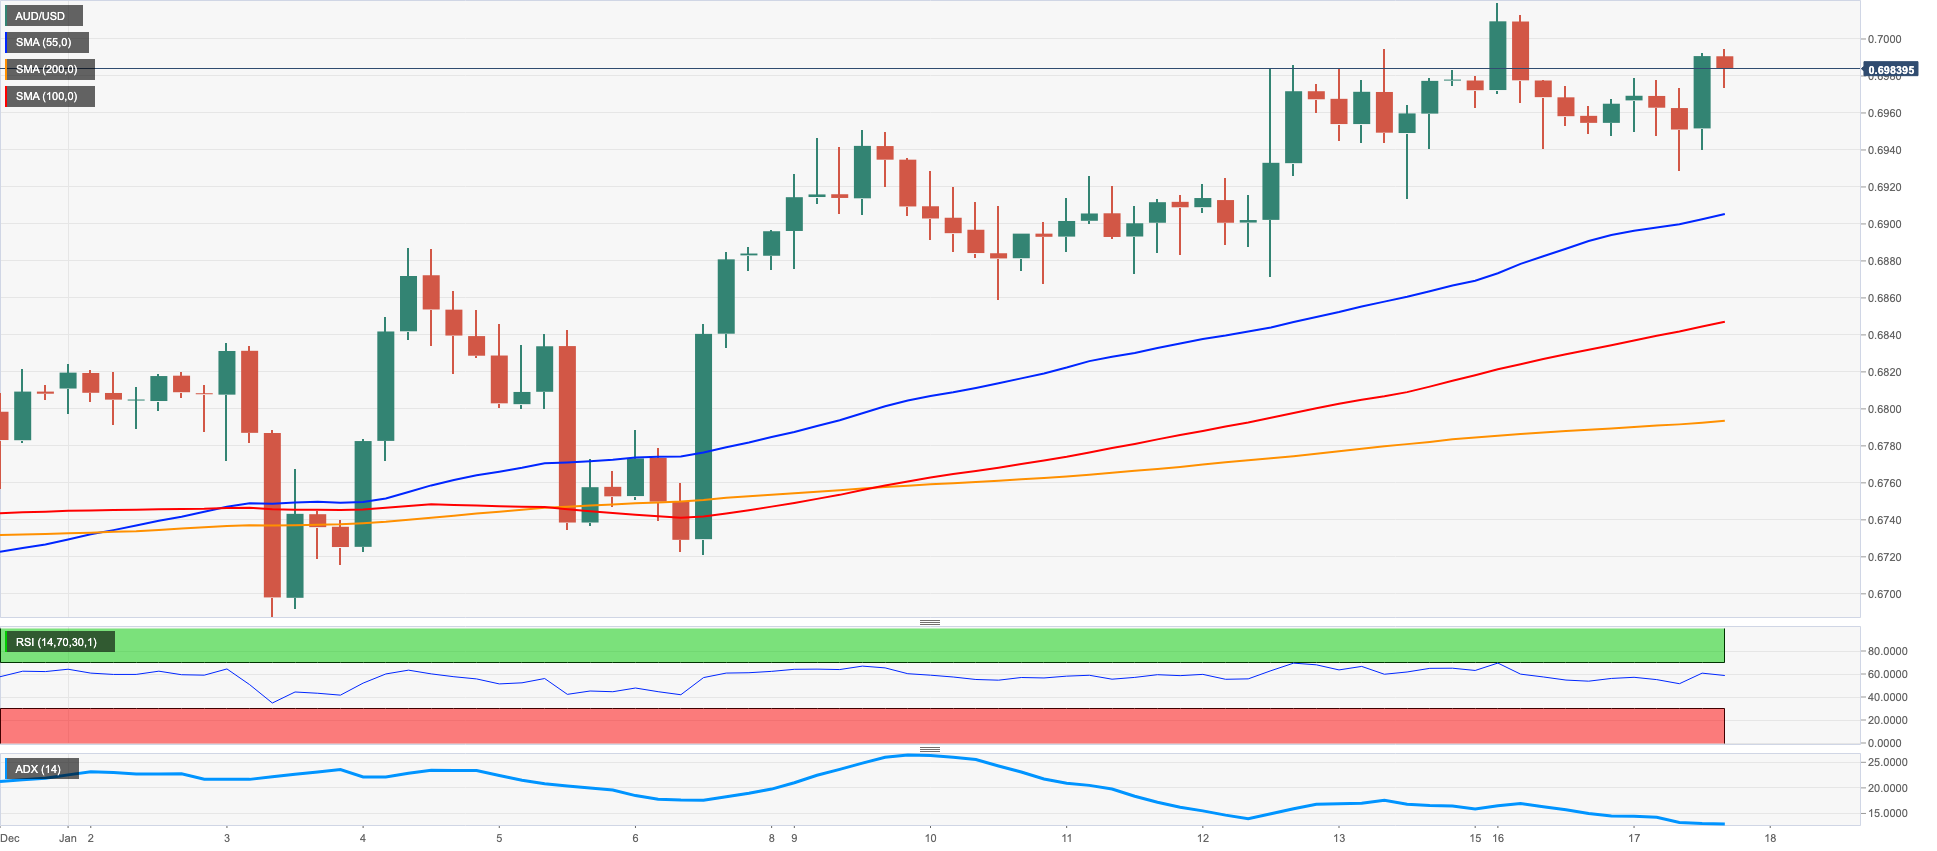
AUDUSD
AUD/USD resumed the December-January rally and re-targeted the key 0.7000 mark on the back of the intense sell-off in the greenback on Tuesday.
Indeed, the greenback saw its losses gather further pace against the backdrop of further improvement in the risk complex, which in turn morphed into extra legs for the Aussie dollar.
Other than the favourable risk-on mood, the AUD derived extra strength from the positive results from the Chinese calendar released earlier on Tuesday, while the mixed tone in the risk complex saw copper prices trim a small part of the ongoing rally and the iron ore extended the positive tone for the second day in a row.
In Oz, the always relevant Consumer Confidence Index tracked by Westpac improved to 84.3 for the month of January (from 80.3).
If AUD/USD breaks above the January top at 0.7019 (January 16) it could then shift its focus to the August 2022 peak at 0.7136 (August 11) prior to the June 2022 high at 0.7282 (June 3). In the opposite direction, the key 200-day SMA at 0.6824 continues to offer firm support before the 55-day SMA at 0.6726 and the January low at 0.6688 (January 3). A deeper drop could see the December low at 0.6629 (December 20) revisited ahead of weekly lows at 0.6584 (November 21) and 0.6386 (November 10). The daily RSI advanced past the 64 level.
Resistance levels: 0.6993 0.7019 0.7136 (4H chart)
Support levels: 0.6929 0.6915 0.6869 (4H chart)
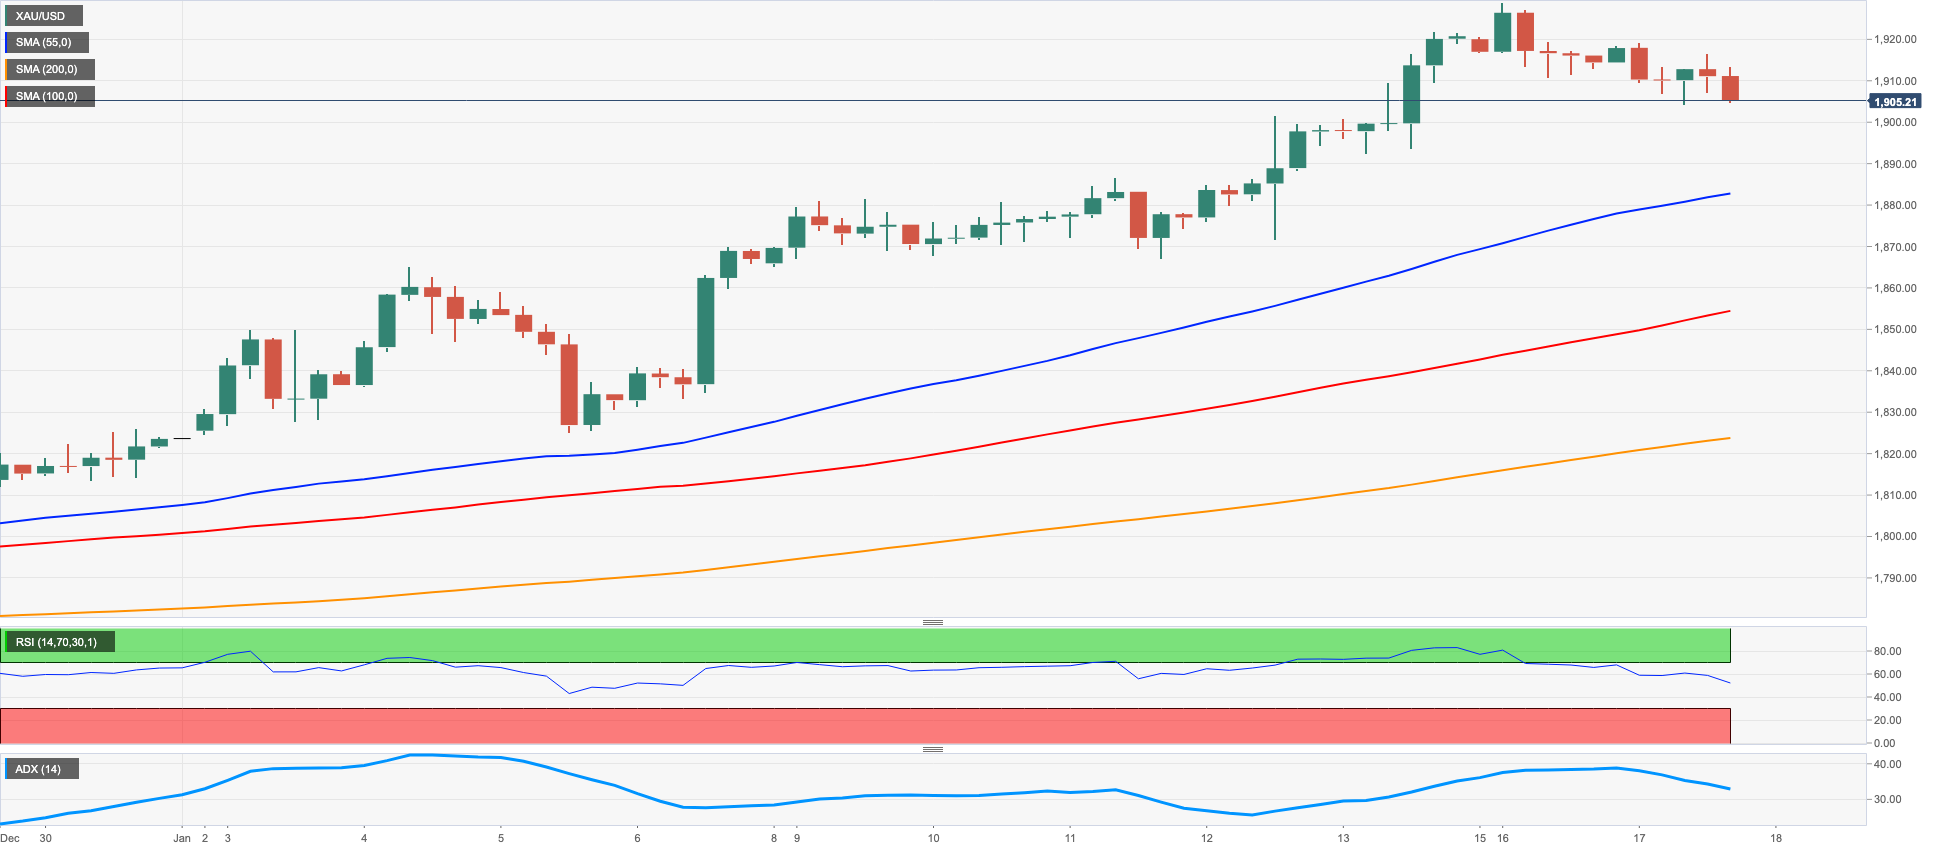
GOLD
Prices of the ounce troy of the precious metal added to Monday’s decline and put the $1900 mark to the test on turnaround Tuesday.
In fact, price action around bullion remained choppy and grinder lower in response to the late rebound in the greenback following dovish comments from ECB rate setters, who hinted at the likelihood of a 25 bps rate hike at the March event.
In addition, the yellow metal failed to capitalize on the corrective downside in US yields across the curve, while yields in the German 10-year benchmark also reversed the earlier uptick in the wake of those comments.
Immediately to the upside in gold remains the January peak at $1929 (January 16) ahead of the April 2022 high at $1998 (April 18), which is closely followed by the psychological $2000 level. The breakout of the latter could put a potential move to the 2022 top at $2070 (March 8) back on the traders’ radar. Contrarily, there are minor support levels at $1867 (January 11) and $1825 (January 5) followed by the key 200-day SMA at $1778, just ahead of the weekly low at $1773 (December 15). Extra losses from here should target the December low at $1765 (December 5) before the weekly low at $1727 (November 23).
Resistance levels: $1929 $1955 $1982 (4H chart)
Support levels: $1904 $1880 $1867 (4H chart)
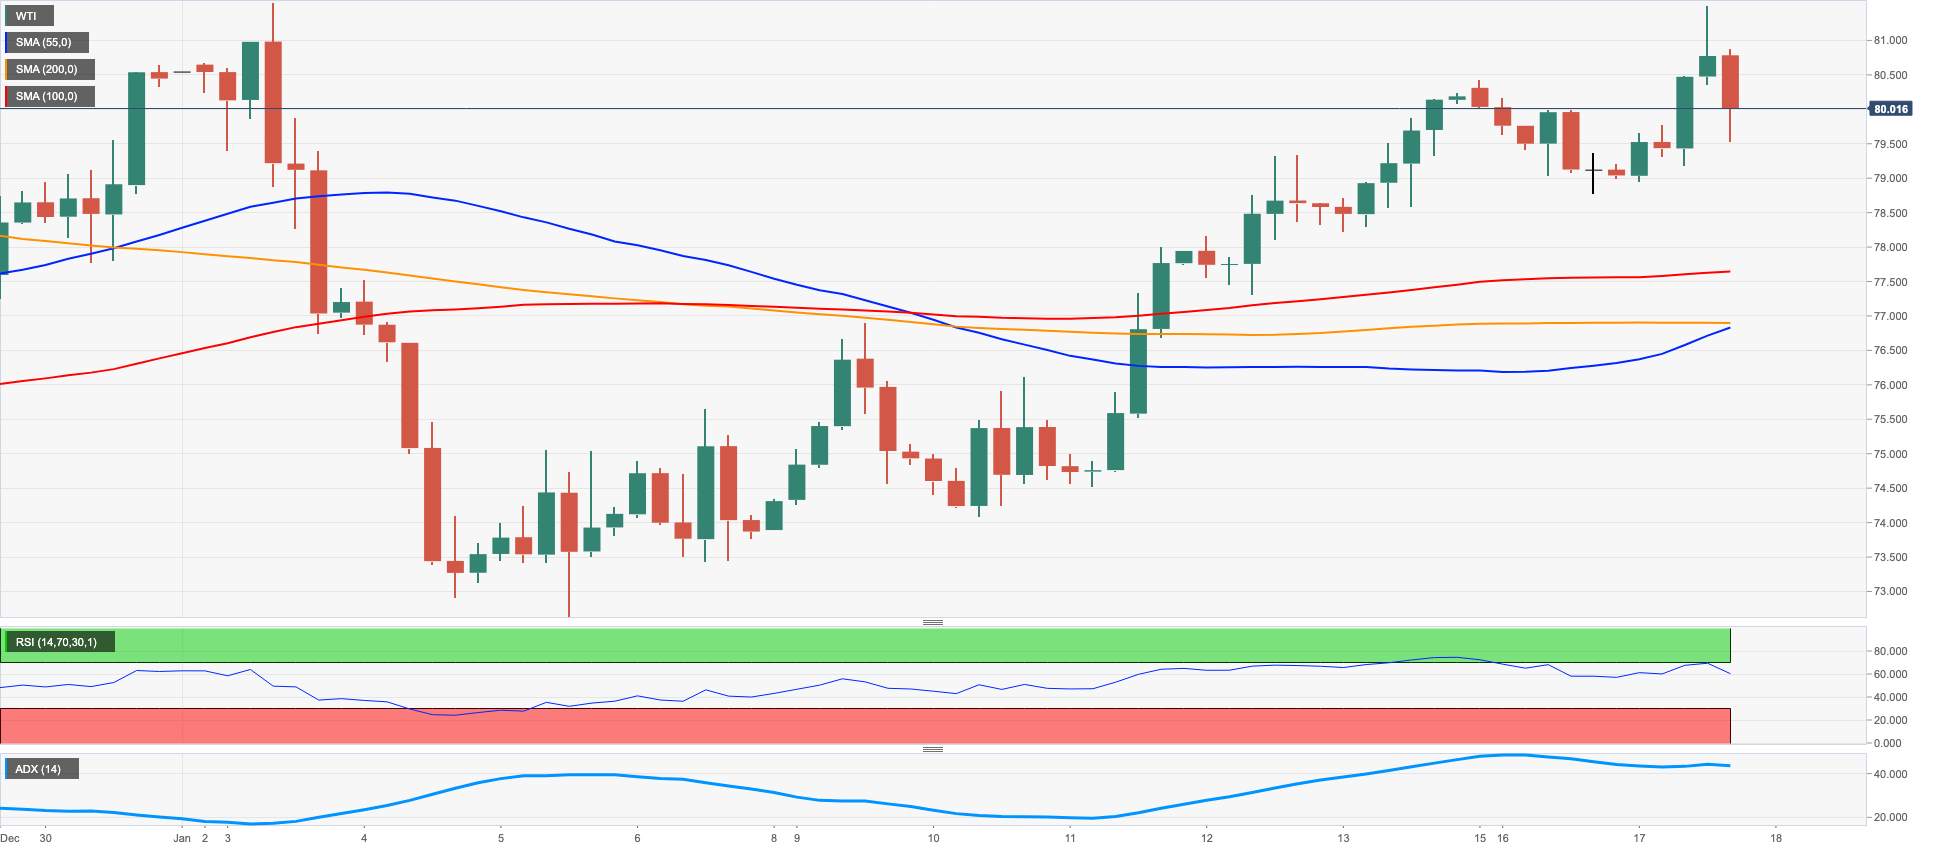
CRUDE WTI
Prices of the barrel of the WTI printed new weekly highs near $81.20 before triggering a knee-jerk to the sub-$80.00 region on Tuesday.
The resumption of the buying pressure around the commodity came on the back of auspicious prints from the Chinese docket early in the Asian session, which reinforced the positive prospects for the demand for crude oil along with further reopening of the economy in the post-zero COVID policy era.
In addition, the weaker dollar also bolstered another firm performance of the WTI, while extra legs came after the EIA said in its monthly report that the Chinese demand for crude oil is expected to increase by around 500 kbpd in 2023.
Extra upside in the WTI should leave behind the January top at $81.44 (January 3) to then confront the December 2022 peak at $83.32 (December 1) ahead of the $90.08 level (November 11 2022). Beyond this level comes the 200-day SMA at $93.13 prior to the November 2022 high at $93.73. Conversely, the January low at $72.50 (January 5) remains the initial contention zone before the 2022 low at $70.10 (December 9) and the key round level at $70.00. The breach of the latter could prompt the weekly low at $66.15 (December 20 2021) to emerge on the horizon followed by the 200-week SMA at $65.61 and the December 2021 low at $62.46 (December 2).
Resistance levels: $81.19 $81.44 $83.32 (4H chart)
Support levels: $78.50 $77.94 $76.90 (4H chart)
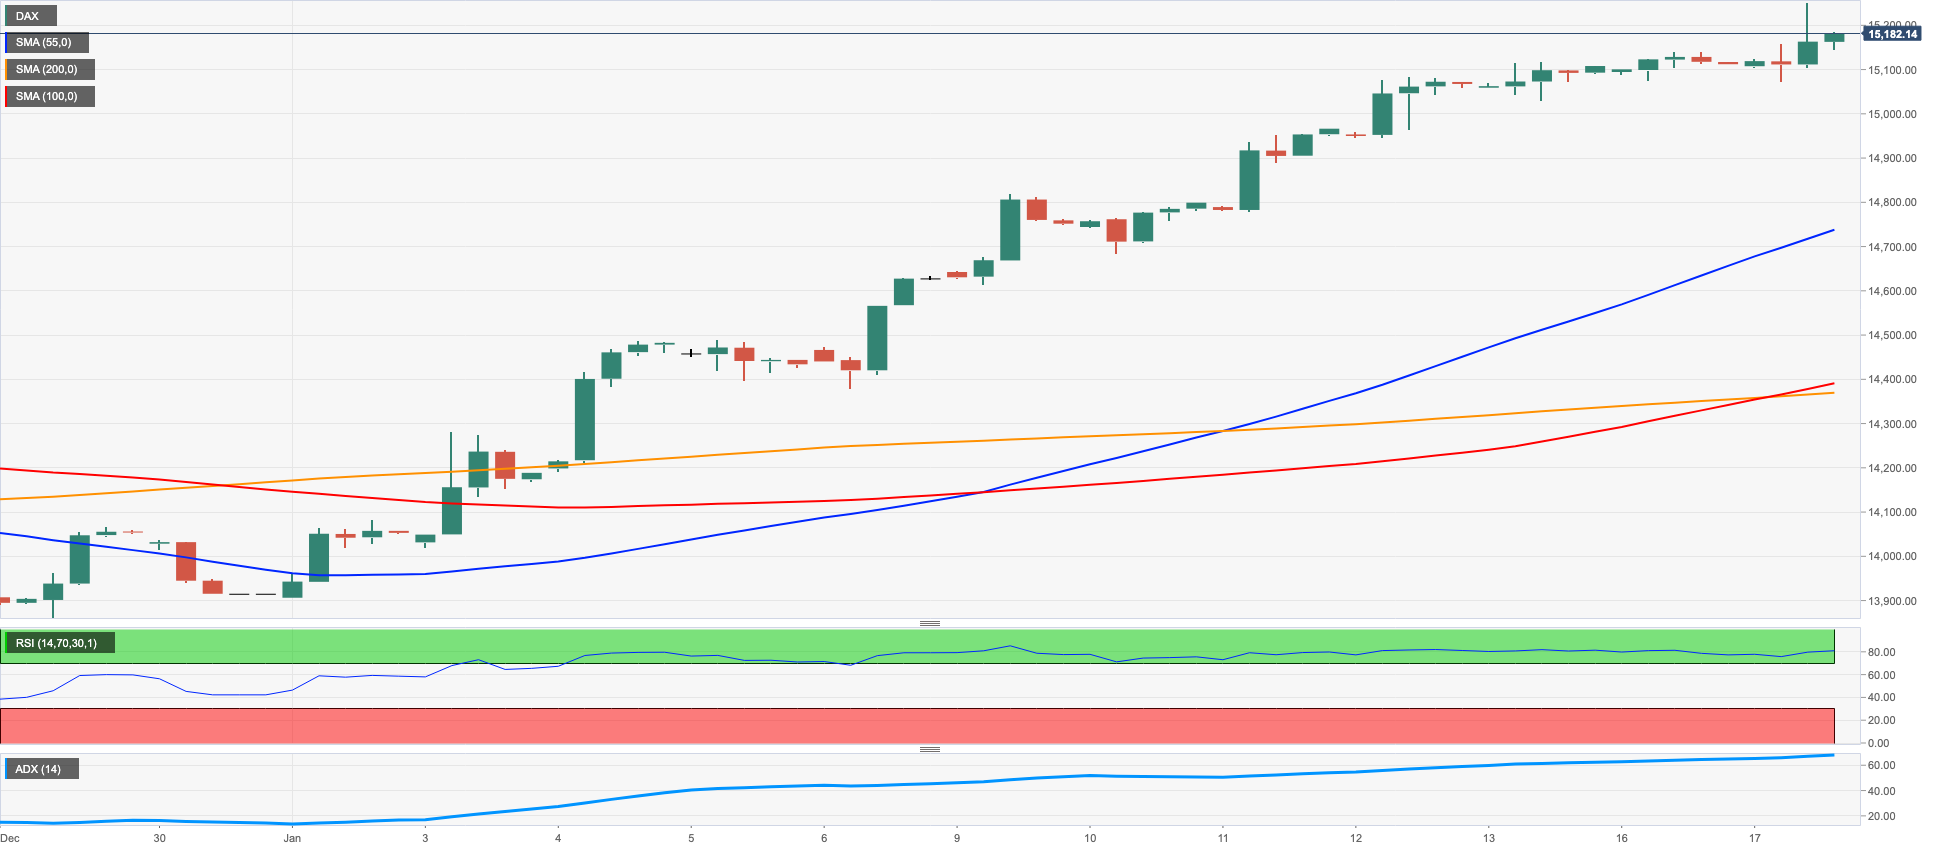
GER40
The rally in the German benchmark DAX 40 remains everything but abated.
Indeed, German equities advanced for the fifth consecutive session and extended further last week’s breakout of the ley 15000 barrier on Tuesday, this time on the back of the broad-based optimism in the risk complex and in line with most of its European peers.
Additionally, promising results from the German docket propped up the upbeat mood in stocks after the final CPI contracted 0.8% MoM in December and rose 8.6% vs. December 2021, while the Economic Sentiment tracked by the ZEW Institute improved to 16.9 in January, returning to the positive territory for the first time since February 2022.
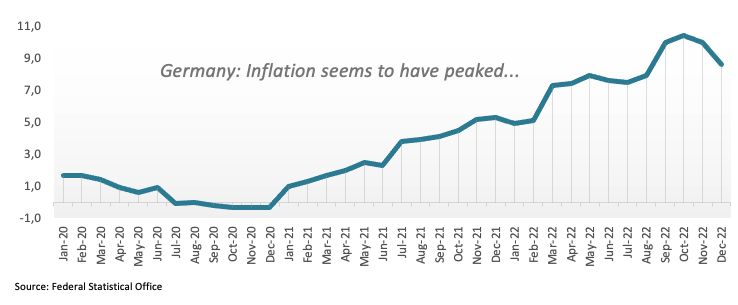
On the latter, ZEW officials highlighted the extra, albeit marginal, recovery in the German economy, adding that the export conditions are improving in response to further curbing of COVID restrictions in China.
Daily gains in stocks came in contrast to the negative performance of the German 10-year Bund yields, which eroded the earlier advance in response to dovish comments from ECB officials.
The DAX 40 now faces the immediate up barrier at the January peak at 15262 (January 17). The surpass of this level could put the index en route to a potential test of the 2022 high at 16285 (January 5). Just the opposite, temporary contention emerges at the 55-day SMA at 14251 followed by the December 2022 low at 13791 (December 20) and the key 200-day SMA at 1`3578. Just below the latter turns up the 100-day SMA at 13550 prior to the November 2022 low at 13022 (November 3) and the minor support at 12548 (October 21 2022). The daily RSI remained in the overbought territory above the 74 yardstick.
Best Performers: Dr Ing hc F Porsche Ag, Deutsche Post, MTU Aero
Worst Performers: Zalando SE, Sartorius AG VZO, Merck
Resistance levels: 15269 15542 15614 (4H chart)
Support levels: 14692 14465 14388 (4H chart)
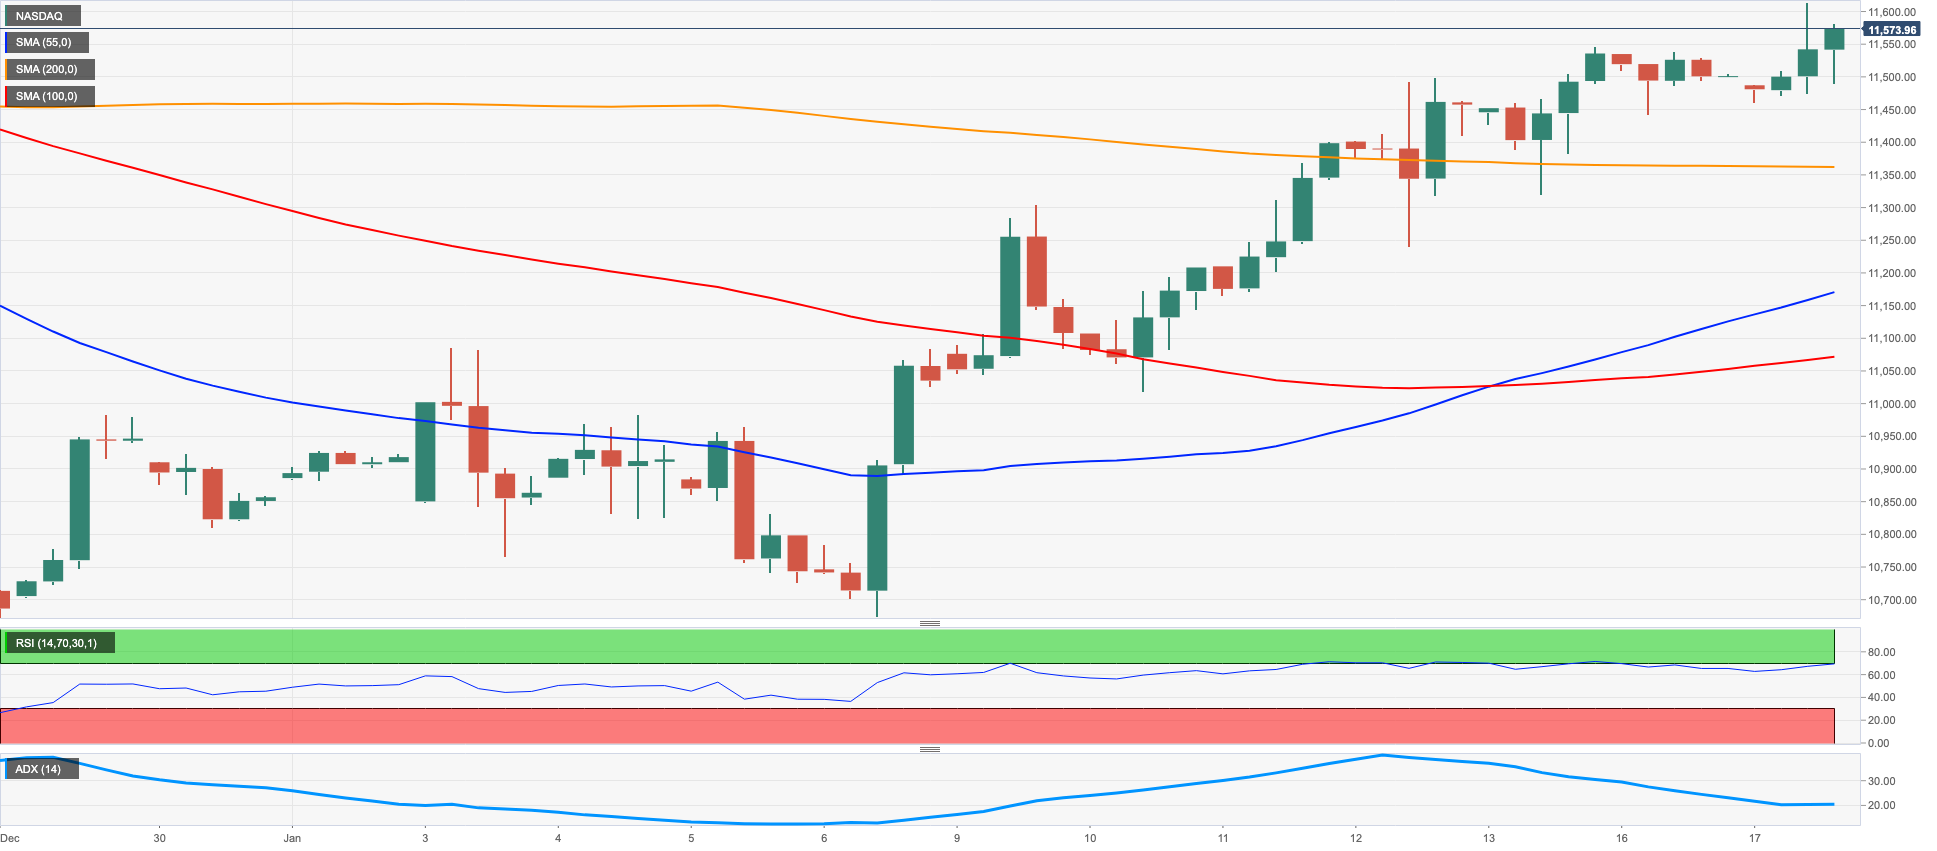
NASDAQ
Another positive session saw the Nasdaq 100 advance for the 7th session in a row and clinch new 5-week highs on turnaround Tuesday.
Indeed, the index picked up extra upside traction as investors favoured the risk-associated assets on Tuesday, while the offered stance in the dollar and declining US yields also collaborated with the continuation of the uptrend.
The upbeat tone in the tech sector remained once again bolstered by unabated speculation of a pivot in the Fed’s monetary stance, at the time when a 25 bps interest rate hike remained the preferred outcome among investors.
Next on the upside for the Nasdaq 100 lines up the key 200-day SMA at 12117 prior to the December 2022 high at 12166 (December 13) and the September 2022 top at 12752 (September 12). On the other hand, the interim 55-day SMA at 11368 should hold the initial downside test followed by the January low at 10696 (January 6) and the December 2022 low at 10671 (December 22). A deeper retracement from here could put the November 2022 low at 10632 (November 4) back on the investors’ radar ahead of the 2022 low at 10440 (October 13). The daily RSI flirted with the 60 region.
Top Gainers: Tesla, Zscaler, Crowdstrike Holdings
Top Losers: JD.com Inc Adr, Pinduoduo, ADP
Resistance levels: 11615 11941 12166 (4H chart)
Support levels: 11246 11050 10696 (4H chart)
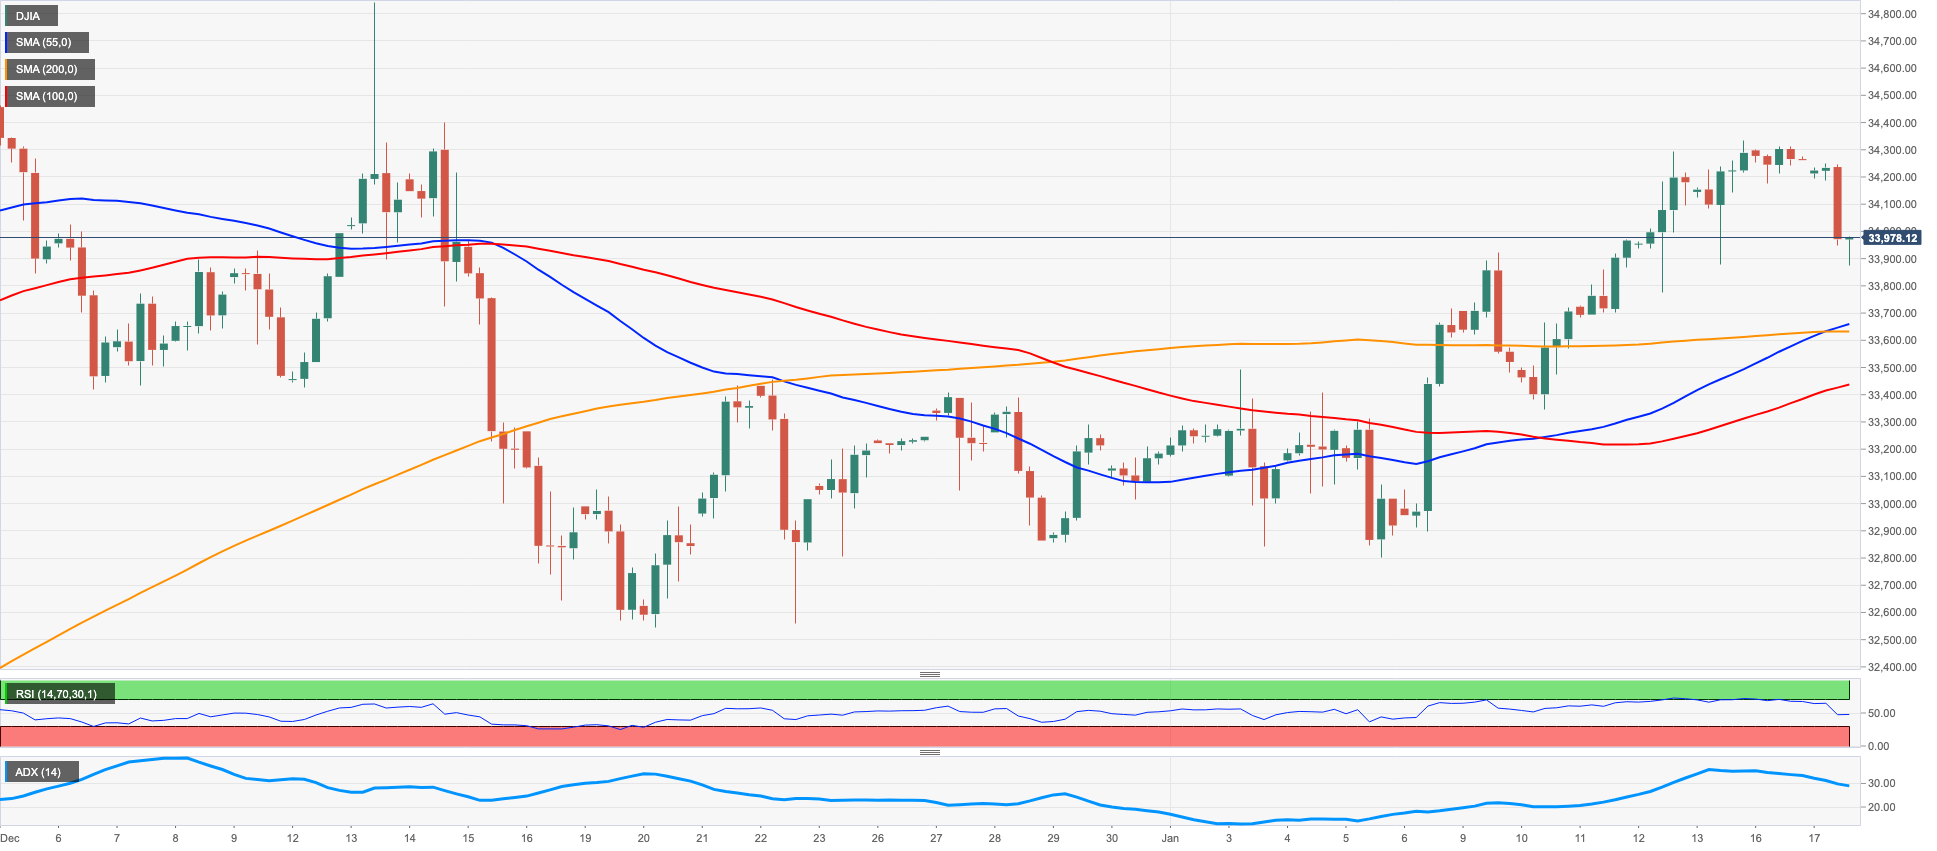
DOW JONES
US markets returned to normal activity on Tuesday.
That said, stocks tracked by the reference Dow Jones reversed four consecutive daily gains and slipped back into the negative ground mainly in response to disappointing quarterly results from Goldman Sachs.
The prevailing risk-on mood in the global markets failed to lend further oxygen to the ongoing positive streak in the index, while market participants also showed some prudence ahead of key data releases later in the week as well as the key monetary policy meeting by the BoJ.
Overall , the Dow Jones dropped 0.93% to 33984, the S&P500 rose 0.04% to 4000 and the tech-reference Nasdaq Composite gained 0.20% to 11101.
If bulls regain control of the sentiment, Dow Jones should revisit the January peak at 34342 (January 13) ahead of the December 2022 high at 34712 (December 13). A move beyond this level could pave the way for a test of the April 2022 top at 35492 before the February 2022 peak at 35824 (February 9). On the opposite side, temporary support comes at the 55-day SMA at 33439 prior to the December 2022 low at 32573 (December 22) and the key 200-day SMA at 32392. Once the latter is breached, the index could challenge the November 2022 low at 31727 (November 3) ahead of the minor support at 30206 (October 21 2022) and the 2022 low at 28660 (October 13). The daily RSI grinded lower to the sub-57 area.
Top Performers: McDonald’s, Chevron, Apple
Worst Performers: Goldman Sachs, Travelers, Verizon
Resistance levels: 34342 34712 35492 (4H chart)
Support levels: 33448 32812 32573 (4H chart)
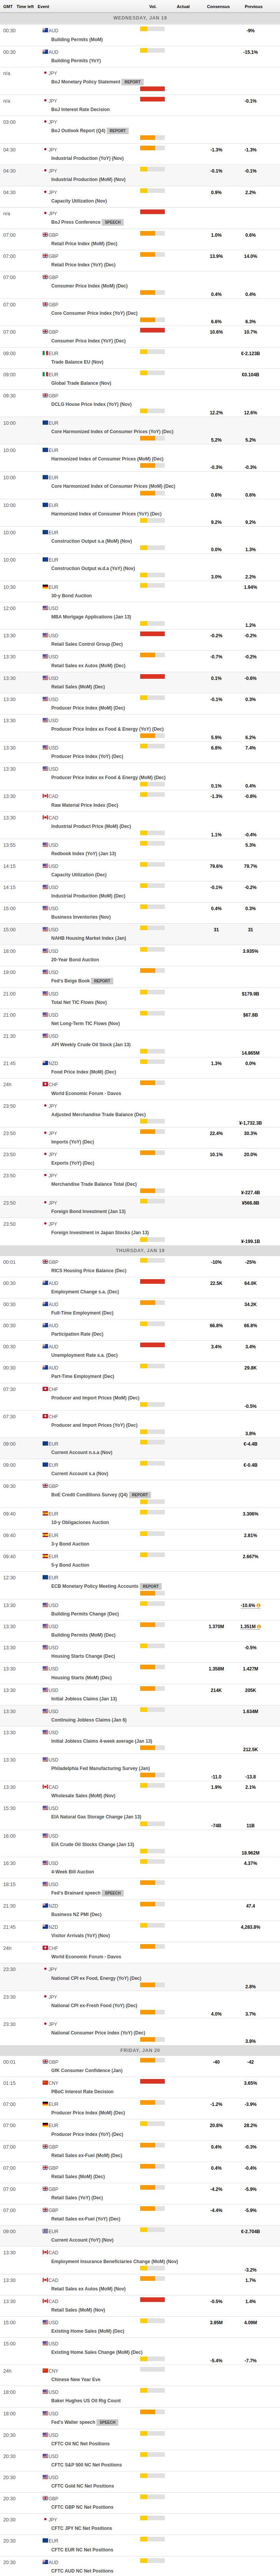
MACROECONOMIC EVENTS
All Information & Updates provided by:

All information relating to the financial markets available on this page has been prepared and issued by FXStreet (Forexstreet SL, Spain, Reg: B62498233) on the basis of publicly available information and all information believed to be reliable and does not conflict with Kuwaiti local laws, and all necessary care has been taken to before the company to ensure that the facts mentioned are correct from the source.
NCM Investment nor any of its directors or employees shall in any way be held responsible for the contents of this news, and the information contained on this page is intended only to provide clients with publicly available information and should not be construed as investment advice, report or analysis and/or constitute an offer or invitation to buy or sell financial instruments of any kind.
RISK WARNING: Forex and CFDs are highly risky leveraged products, as losses can exceed deposits. Please ensure you understand all the risks and take independent advice if necessary. NCM will segregate the clients based on the criteria of the regulator and its bylaws. NCM does not provide any advisory service; the material published does not constitute advice or a recommendation for a transaction in any financial instrument. NCM accepts no responsibility for any use of the content presented and any consequences of that use. Anyone acting on the information provided does so at their own risk.