
- Contact Us:
-

-

-

-


Daily Market Updates
19 Jan 2023
USDJPY
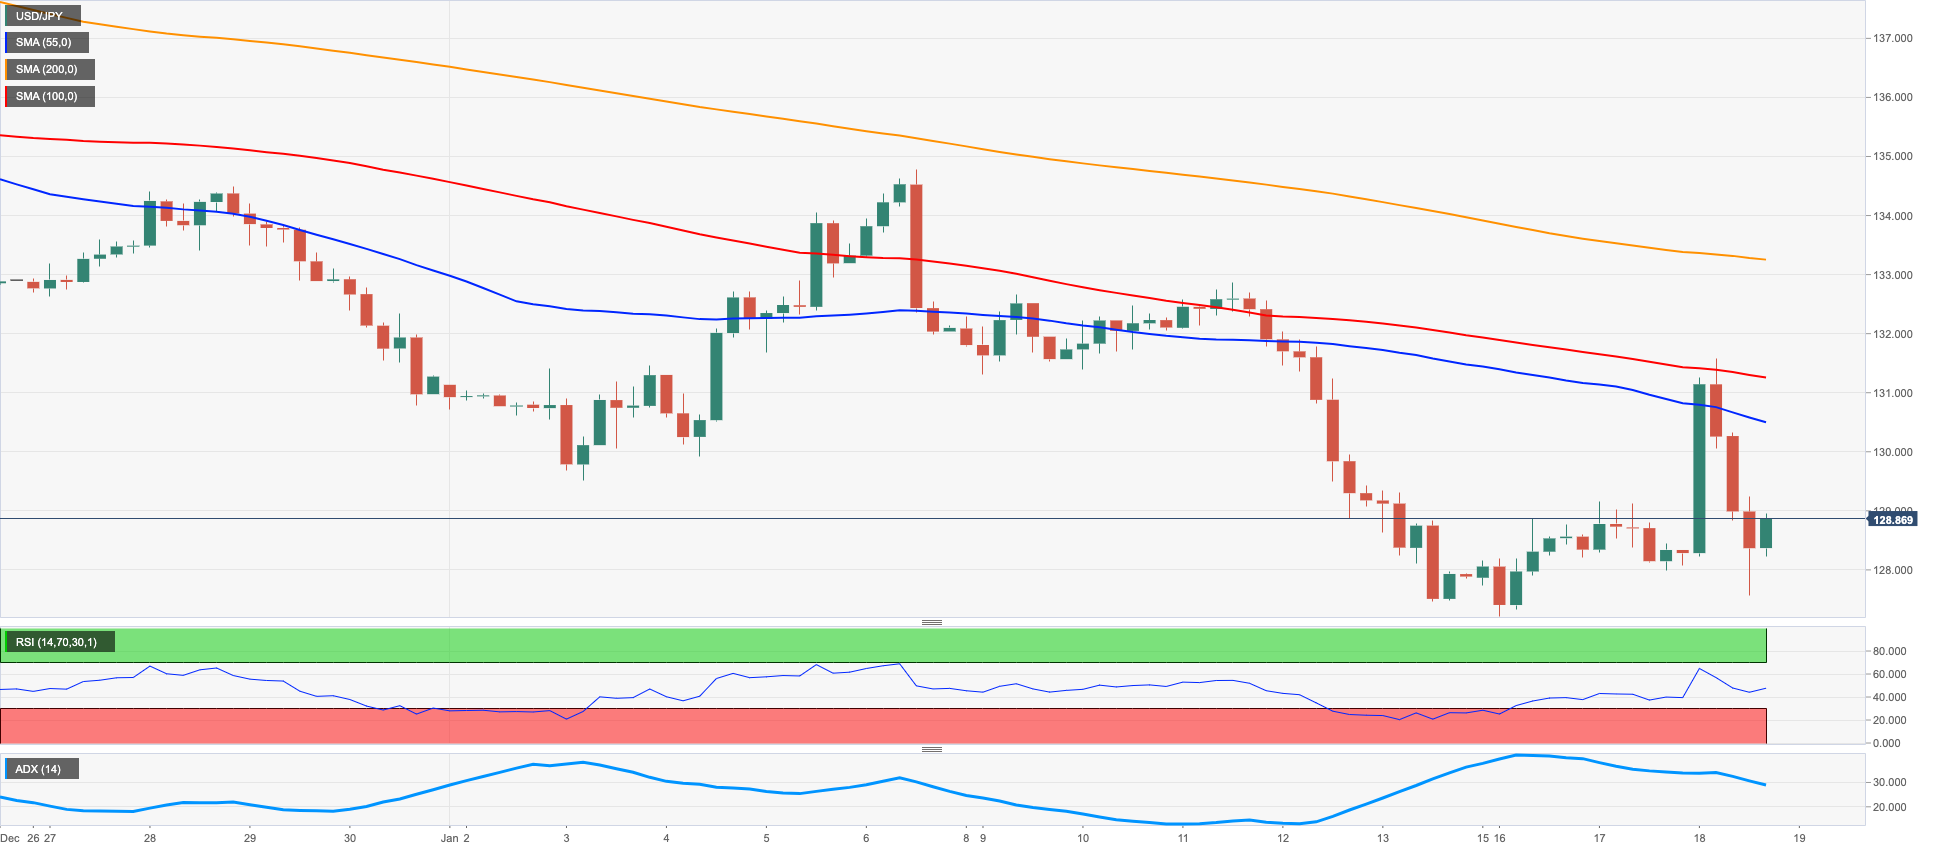
USD/JPY rose sharply to 4-day highs past the 131.00 hurdle soon after the BoJ kept its monetary stance unchanged at its gathering earlier on Wednesday.
The abrupt depreciation of the Japanese yen followed an equally strong disappointment among many investors, who were betting on some announcement regarding further tweak of the YCC or any hint about an exit strategy of the bank’s ultra-accommodative stance.
Well, neither of that happened and the yen collapsed to fresh lows vs. the greenback, although it regained some poise towards the end of the NA session .
Still around the BoJ, Governor Kuroda reiterated the bank’s readiness to ease the policy further if needed, while he ruled out further widening of the bond yields band and suggested that there is no special risk to the increase in the purchases of bonds.
Furthermore, Japan’s trade and industry minister Nishimura suggested the phase when the current monetary easing can be stopped could be near.
In the wake of the BoJ gathering, the 10-year JGB yields plummeted to the 0.36% region, just to bounce afterwards.
In Japan, and other than the BoJ event, the Reuters Tankan Index deteriorated to -6 in January, Machinery Orders contracted 3.7% in the year to November and final figures saw Industrial Production contract 0.9% YoY also in November.
USD/JPY navigates under heavy pressure and a breach of the January low at 127.21 (January 16) could leave the pair vulnerable to a deeper decline to the May 2022 low at 126.36 (May 24) ahead of the weekly low at 121.27 (March 31 2022). By contrast, the so far weekly high at 131.57 (January 18) emerges as a minor hurdle prior to the January high at 134.77 (January 6). Above this level, the pair could dispute the key 200-day SMA at 136.66 followed by weekly tops at 138.17 (December 15 2022) and 139.89 (November 30 2022), all ahead of the key round level at 140.00. The daily RSI lost some ground and slipped back to the 32 region.
Resistance levels: 131.57 132.87 134.77 (4H chart)
Support levels: 127.21 126.36 125.08 (4H chart)
GBPUSD
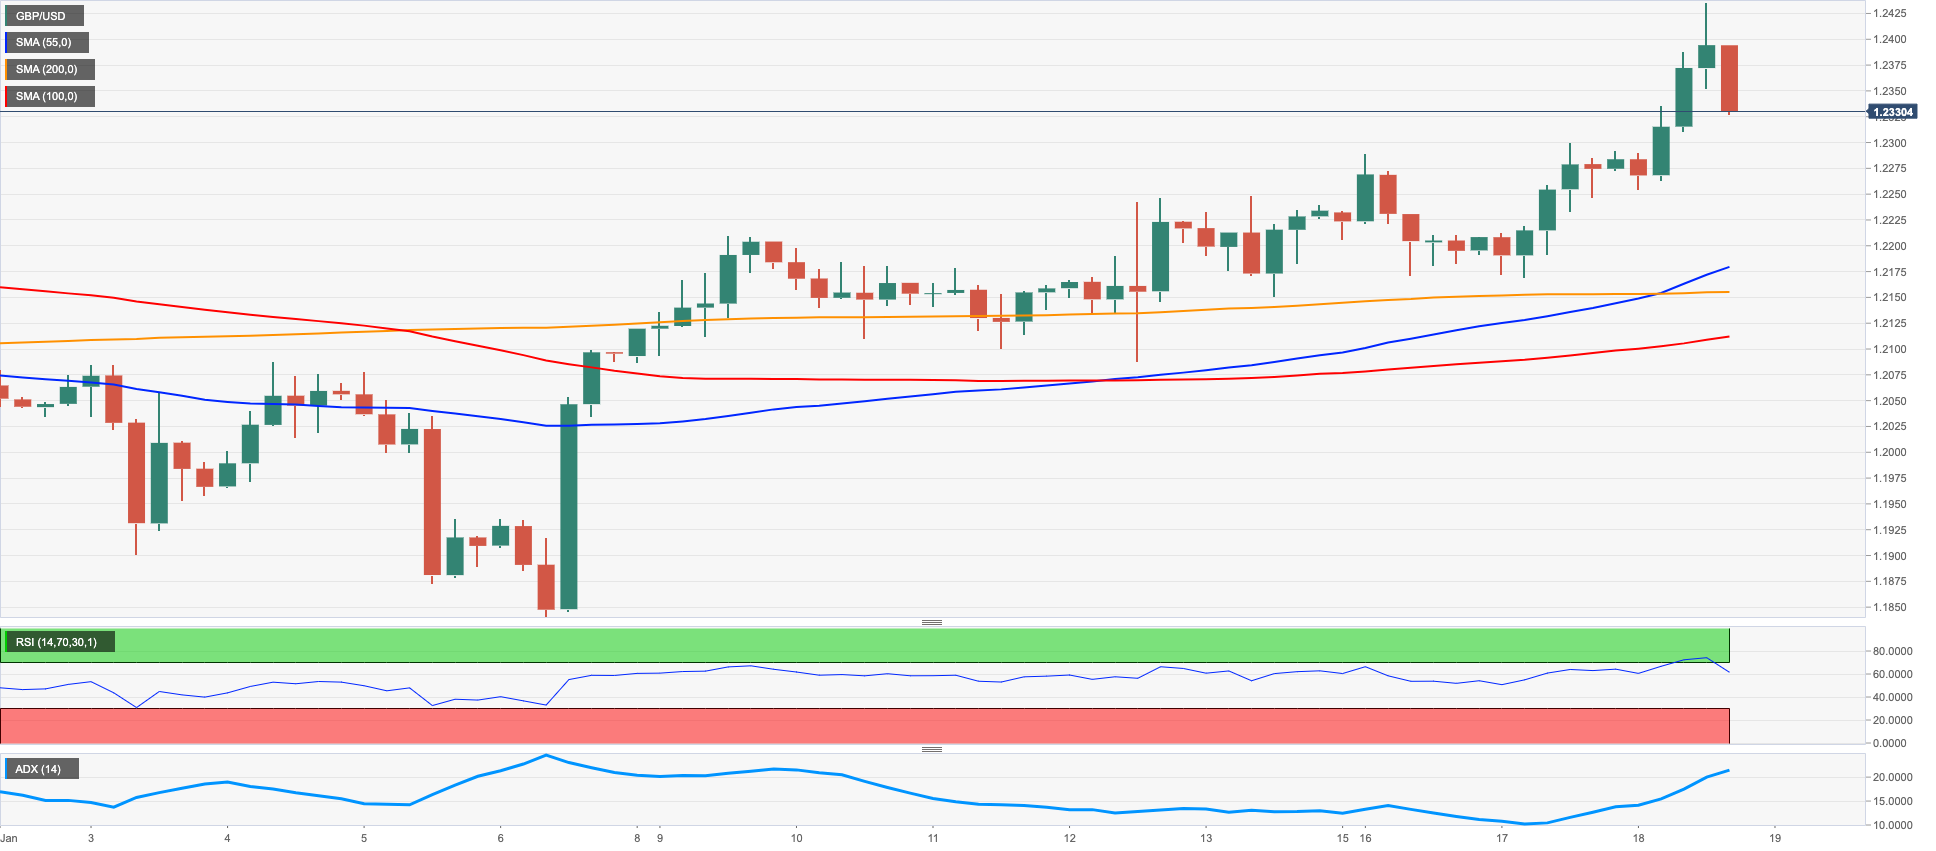
GBP/USD saw its weekly bounce reinvigorated on the back of the renewed and quite strong selling pressure in the greenback. Against that, Cable rose to fresh 5-week highs well north of 1.2400 the figure on Wednesday and shifted its focus to the December peak near 1.2450 (December 14).
Also collaborating with the upbeat mood in the quid, and according to the docket, inflation remained elevated in December, which should support further tightening by the BoE for the time being.
Indeed, the headline CPI rose 10.5% YoY in the last month of 2022 and 0.4% vs. the previous month. Furthermore, the Core CPI advanced 6.3% from a year earlier.
GBP/USD now needs to clear the January high at 1.2435 (January 18) to then confront the December 2022 top at 1.2446 (December 14) ahead of the May 2022 peak at 1.2666 (May 27). The surpass of this level could open the door to a potential test of the key 200-week SMA at 1.2909 prior to the psychological 1.3000 mark. On the contrary, there is an initial contention at the key 200-day SMA at 1.1982 before the January low at 1.1841 (January 6) and the interim 100-day SMA, today at 1.1704. The daily RSI picked up pace and trespassed 62.
Resistance levels: 1.2435 1.2446 1.2599 (4H chart)
Support levels: 1.2168 1.2154 1.2084 (4H chart)
AUDUSD
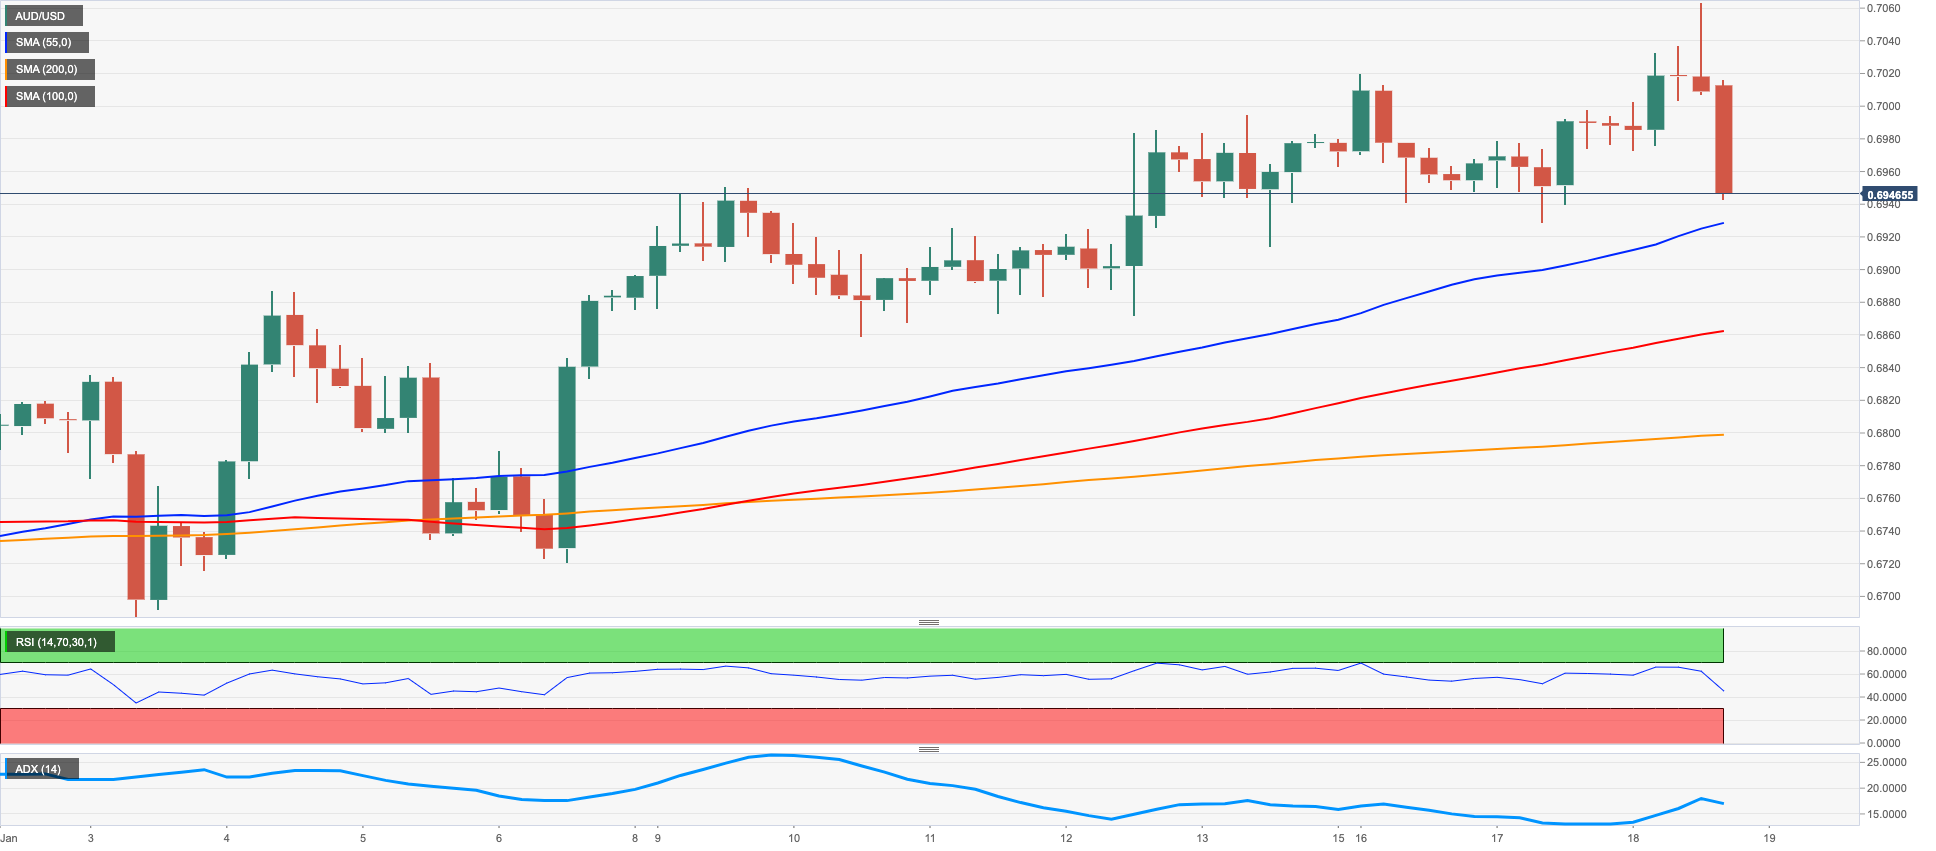
AUD/USD quickly faded the uptick to new 5-month highs in the 0.7060/65 band on Wednesday, receding to the mid-0.6900s afterwards in response to the rebound in the greenback.
Indeed, the pronounced drop in the greenback earlier in the day facilitated the continuation of the uptrend in spot to levels last seen back in mid-August well north of the 0.7000 mark, while generalized gains in the commodity universe also sustained the solid buying interest around the Aussie dollar.
There were no data releases scheduled Down Under on Wednesday, leaving all the attention to Thursday’s publication of the always relevant labour market report as well as Consumer Inflation Expectations.
The breakout of the January peak at 0.7063 (January 16) could motivate AUD/USD to attempt a visit to the August 2022 high at 0.7136 (August 11) ahead of the June 2022 top at 0.7282 (June 3) and the round level at 0.73000. On the flip side, initial and decent contention aligns at the key 200-day SMA at 0.6822 ahead of the temporary 55-day SMA at 0.6739 and the January low at 0.6688 (January 3). Extra losses from here are expected to put the December low at 0.6629 (December 20) to the test prior to weekly lows at 0.6584 (November 21) and 0.6386 (November 10). The daily RSI debilitated to the 60 zone.
Resistance levels: 0.7063 0.7136 0.7247 (4H chart)
Support levels: 0.6929 0.6915 0.6869 (4H chart)
GOLD
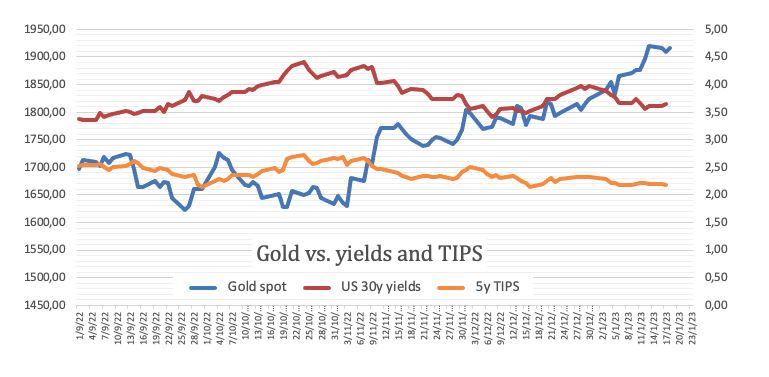
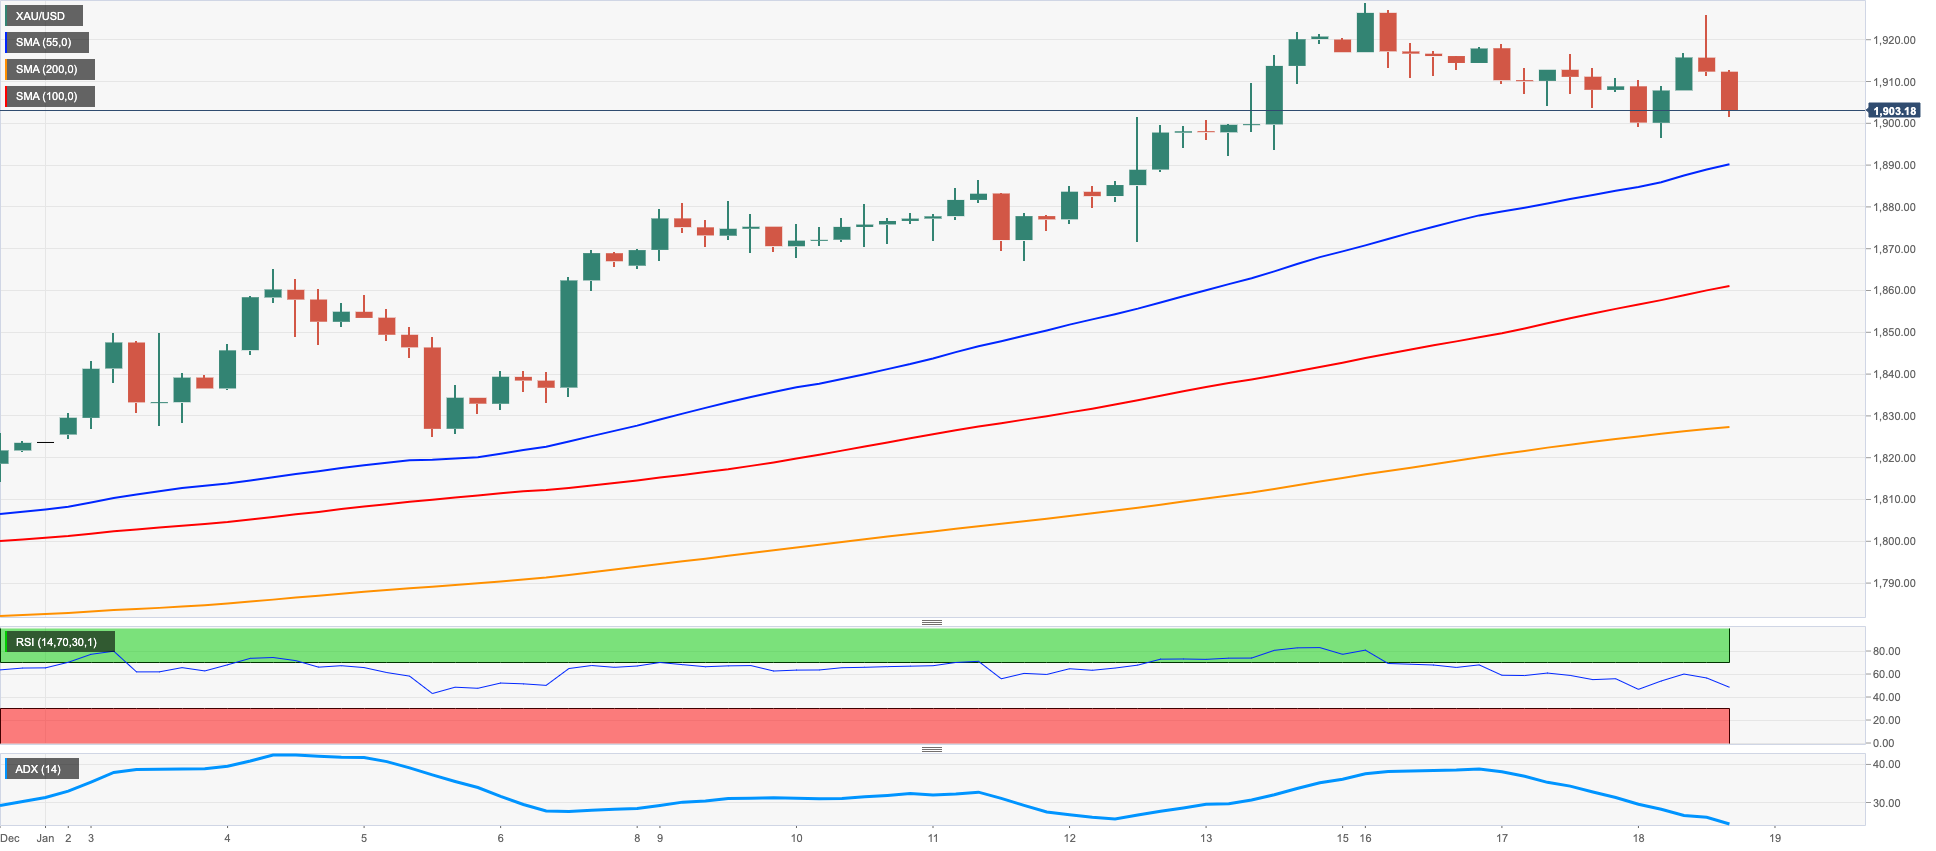
The U-turn in the dollar forced the precious metal to drop for the third session in a row after once again visiting the area of recent peaks past the $1920 mark per ounce troy on Wednesday.
In fact, the greenback reversed its early downside after bottoming out in levels last seen in late May 2022 around 101.50 when measured by the USD Index (DXY) in a context largely favoured to the risk-linked galaxy.
Somewhat limiting the downside in the yellow metal appeared the intense pullback in US yields, particularly in the belly and the long end of the curve.
Initial support for bullion came from the BoJ and the utter absence of any surprise at its event during early trade vs. market expectations of announcements regarding the YCC or a potential plan to start abandoning the ultra-loose stance.
Gold bulls face the next hurdle at the January high at $1929 (January 16). Once this level is cleared, the metal could then attempt a move to the April 2022 top at $1998 (April 18) just before the psychological $2000 mark and the 2022 peak at $2070 (March 8). In the opposite direction, minor support levels appear at $1867 (January 11) and $1825 (January 5) ahead of the more relevant 200-day SMA at $1778, which precedes the weekly low at $1773 (December 15). The breach of this level could spark a deeper decline to the December low at $1765 (December 5) ahead of the weekly low at $1727 (November 23).
Resistance levels: $1929 $1955 $1982 (4H chart)
Support levels: $1896 $1867 $1825 (4H chart)
CRUDE WTI
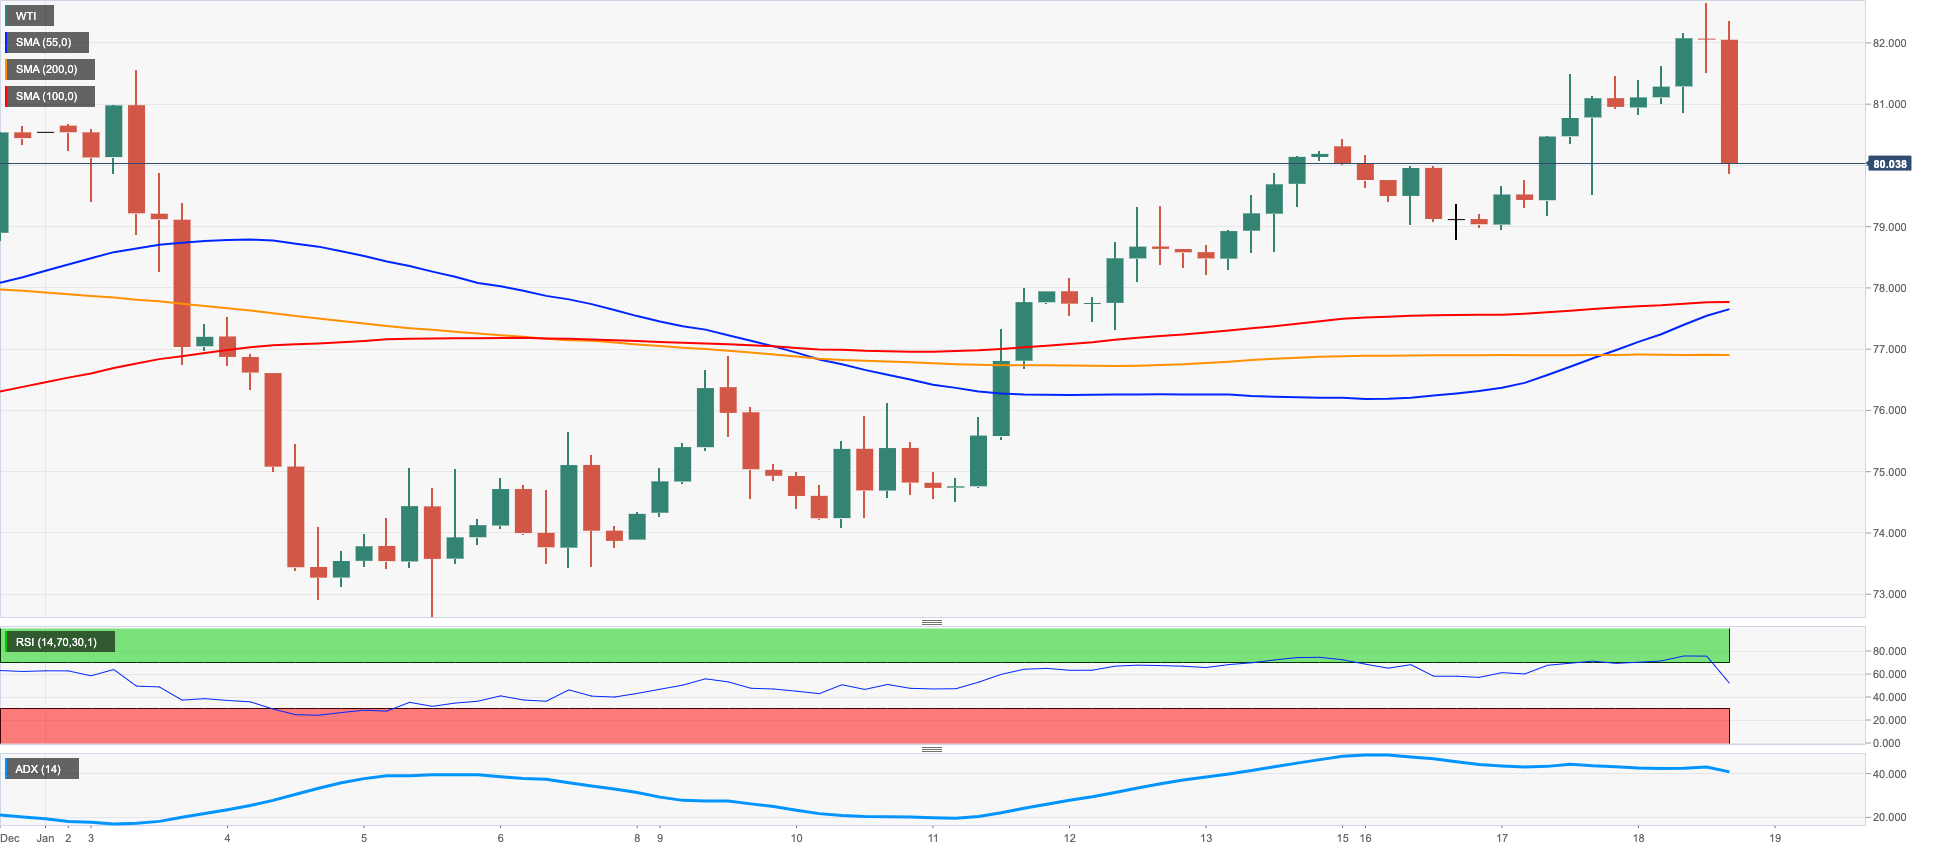
Prices of the American reference for the sweet light crude oil could not sustain the earlier advance to the new YTD high at $82.35 per barrel, an area coincident with the 100-day SMA.
Indeed, the late bounce in the greenback weighed on traders’ sentiment and sparked a corrective move despite the Chinese reopening continued to provide support for positive prospects when it came to the future demand for crude oil, as it has been the main factor behind the recent strong bounce in prices.
From the IEA, Executive Director Birol suggested that crude oil prices are expected to rise in line with the recovery in China, at the time when he added that consumers could struggle with prices above $70-$75 per barrel.
Later in the NA session, the API will report on the US crude oil supplies in the week to January 13
Prices of the WTI now faces the next hurdle of note at the January peak at $82.35 (January 18), just ahead of the December 2022 high at $83.32 (December 1). North from here aligns the $90.08 level (November 11 2022) prior to the 200-day SMA at $93.05 and the November 2022 top at $93.73. Inversely, there is initial support at the January low at $72.50 (January 5), while the breach of the latter could put the 2022 low at $70.10 (December 9) back on the traders’ radar just before the key round level at $70.00 and the weekly low at $66.15 (December 20 2021). The loss of this level could open the door to a probable test of the 200-week SMA at $65.61 seconded by the December 2021 low at $62.46 (December 2).
Resistance levels: $82.35 $83.32 $88.65 (4H chart)
Support levels: $79.97 $78.50 $76.96 (4H chart)
GER40
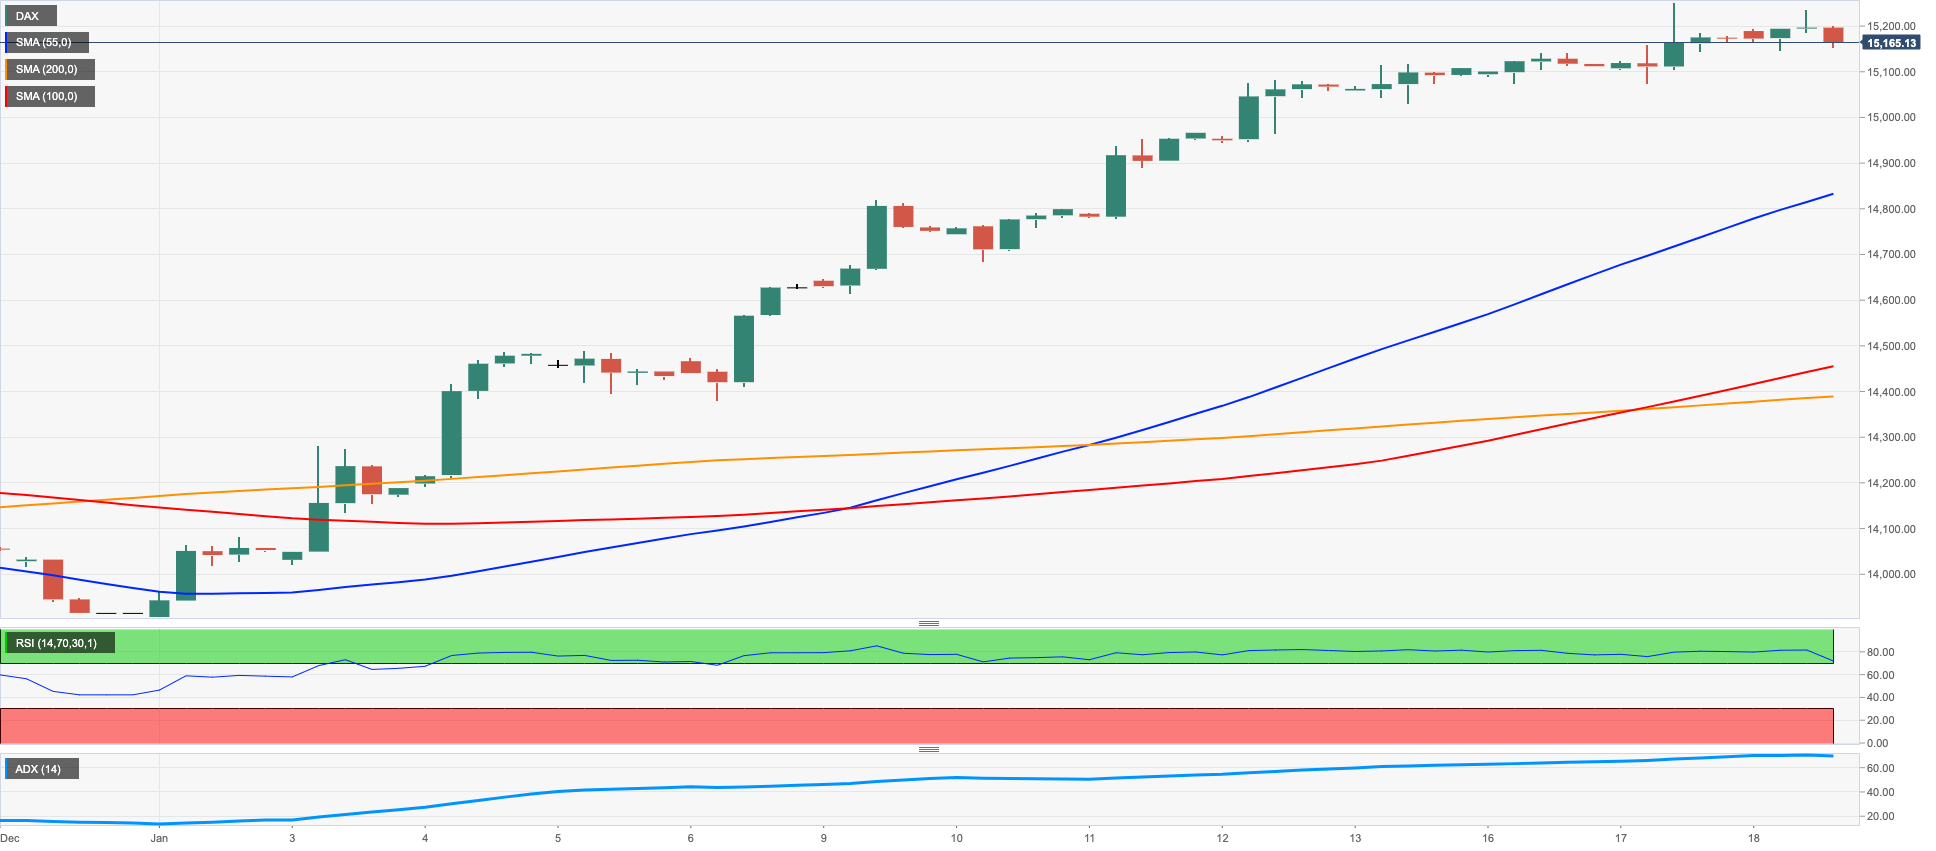
German equities charted a vacillating session and prompted the stock reference DAX 40 to close around Tuesday’s zone around 15180 midweek.
The index alternated gains with losses on Wednesday, as market participants digested the dovish surprise from the BoJ early in the session, while final inflation figures in the broader Euroland still remained elevated in December.
In the meantime, some hawkish remarks from ECB-speakers earlier in the session left the door open to extra tightening from the ECB, and this appears to have somewhat undermined the recent optimism among traders.
On the positive side, Germany is expected to avoid recession in 2023 by a small margin, while the economy is seen expanding 1.8% in 2024. Regarding inflation, consumer prices are expected to gain 6.0% this year and 2.8% in 2024.
Data wise in Germany, New Car Registrations expanded 38.1% in the year to December.
From the German money market, further weakness in the 10-year Bund yields put the 2.0% level to the test for the first time since mid-December, in line with their US peers.
The January high at 15262 (January 17) emerges as the next up barrier for bulls in the DAX 40 followed by the 2022 top at 16285 (January 5). On the opposite side, there is a provisional support at the 55-day SMA at 14285 ahead of the December 2022 low at 13791 (December 20) and the key 200-day SMA at 13583. This region also appears bolstered by the 100-day SMA at 13572. Below the latter comes the November 2022 low at 13022 (November 3) prior to the minor support at 12548 (October 21 2022). The daily RSI eased a tad below 74, still in the overbought territory.
Best Performers: Covestro, Hannover Rueck SE, Airbus Group
Worst Performers: Continental AG, Vonovia, Merck
Resistance levels: 15269 15542 15614 (4H chart)
Support levels: 14692 14526 14401 (4H chart)
NASDAQ
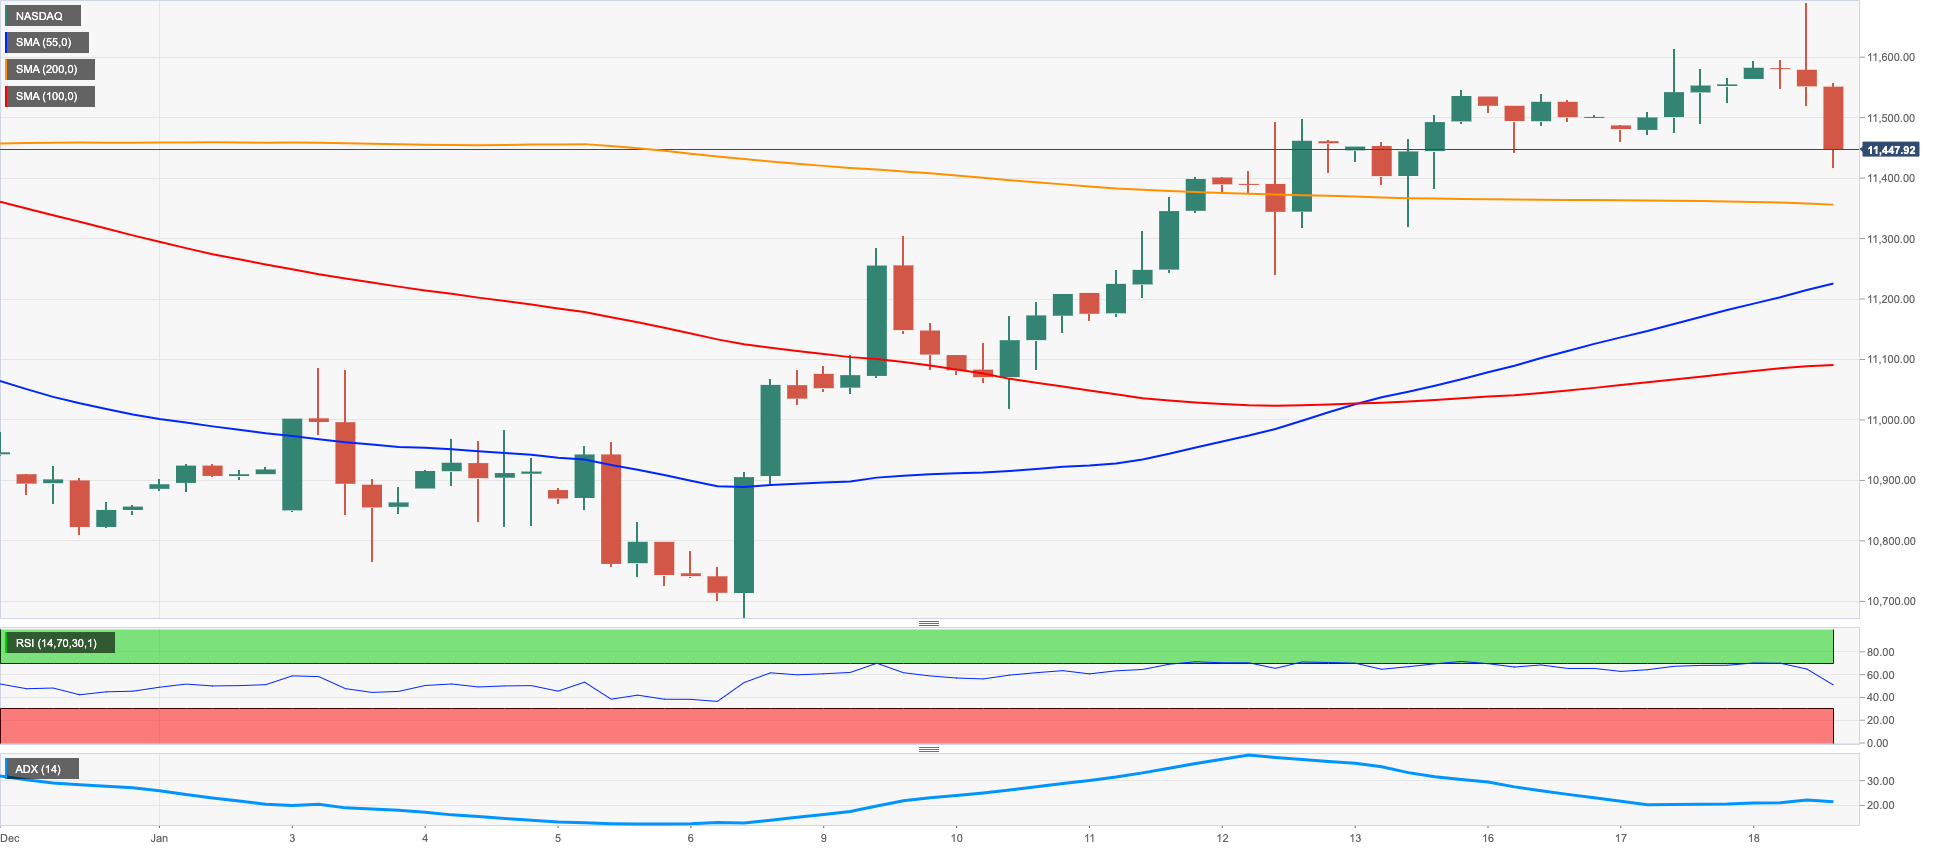
The Nasdaq 100 halted its multi-session positive streak and dropped to 2-day lows near the 11400 level on Wednesday.
In fact, the mood among market participants suddenly deteriorated after FOMC’s speakers poured (very) cold water over expectations of a slower pace of the future interest rate hikes by the Federal reserve.
Indeed, members Mester and Bullard advocated for a rapid move to the Fed Funds to levels above 5% and stay there based on data results, showing once again the stark contrast between what markets expect and the mood among Fed’s policy makers.
The initial up barrier for the Nasdaq 100 remains at the January high at 11690 (January 18). The breakout of this level could encourage the index to revisit the key 200-day SMA at 12100 ahead of the December 2022 top at 12166 (December 13). Further up appears the September 2022 peak at 12752 (September 12). Just the opposite, there is a temporary contention at the 55-day SMA at 11373 before the January low at 10696 (January 6) and the December 2022 low at 10671 (December 22). Further losses from here expose the November 2022 low at 10632 (November 4) prior to the 2022 low at 10440 (October 13). The daily RSI dropped to the vicinity of 55.
Top Gainers: Moderna, Qualcomm, IDEXX Labs
Top Losers: Kraft Heinz, Warner Bros Discovery, Pinduoduo
Resistance levels: 11690 12166 12752 (4H chart)
Support levels: 11227 11050 10696 (4H chart)
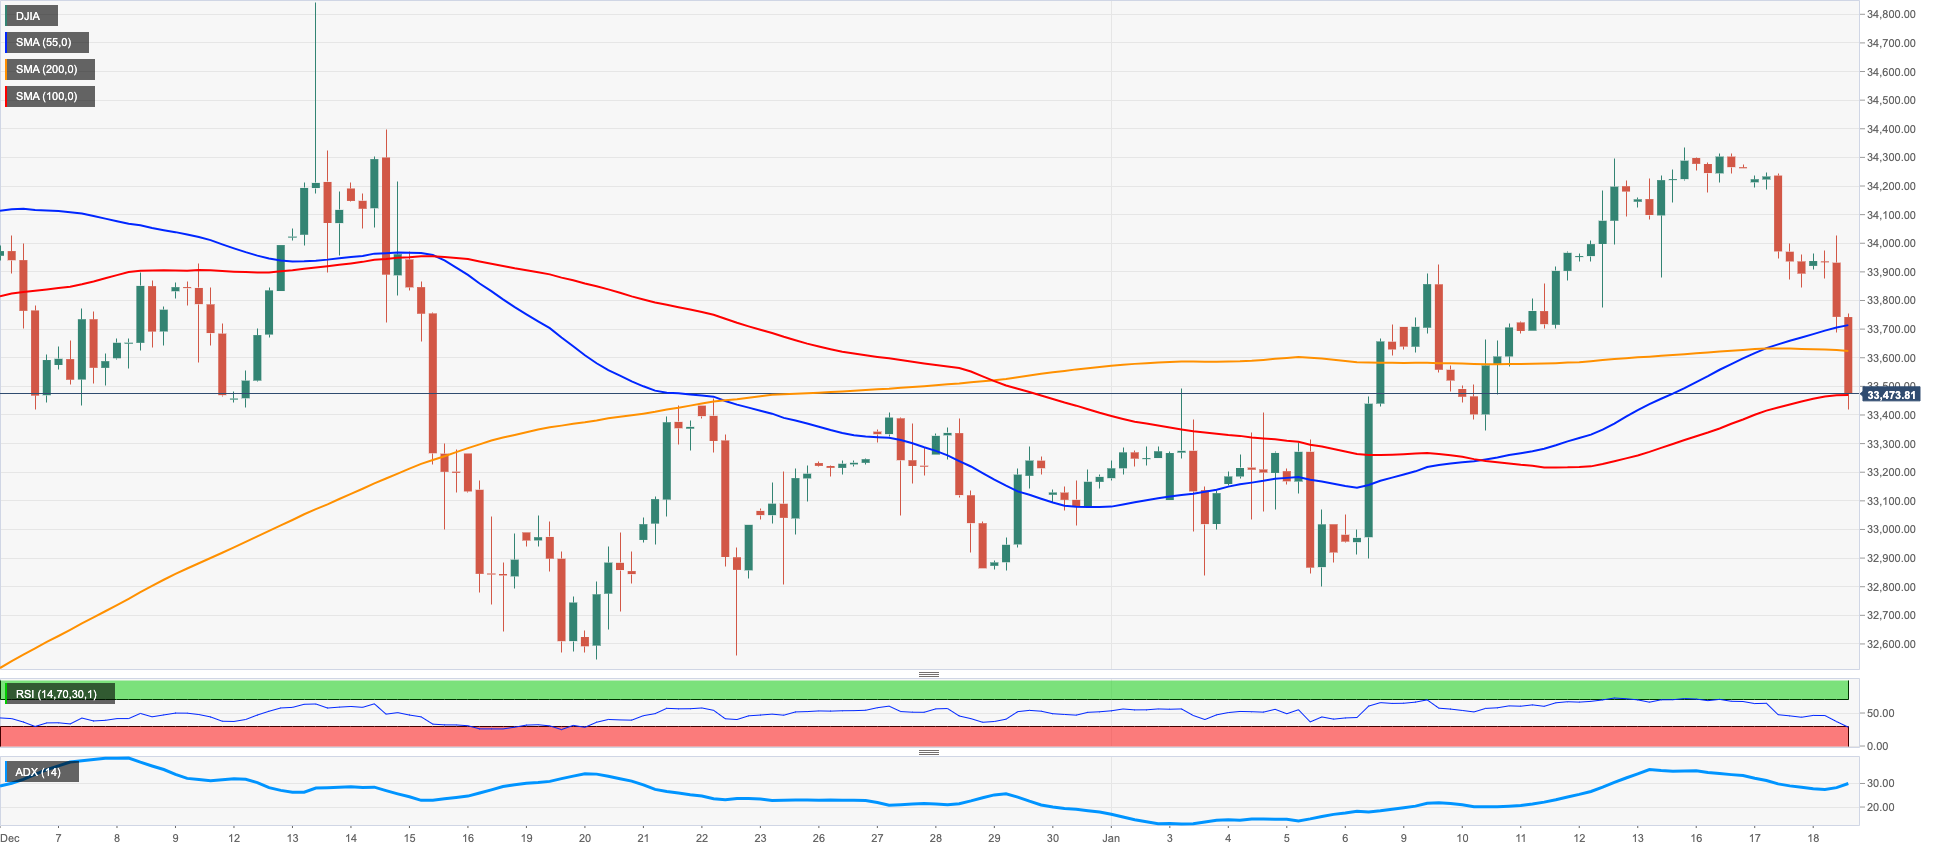
DOW JONES
US equities tracked by the Dow Jones extended the weekly leg lower and clinched new multi-day lows near the 33400 region on Wednesday.
In fact, the Dow Jones saw its losses magnified in response to hawkish comments from FOMC’s Mester (Cleveland) and Bullard (St. Louis), who suggested that rates need to rapidly advance past the 5% level and remain around that area for longer.
Sentiment among investors therefore soured and impacted on the stocks’ performance, as the view from Fed’s rate setters remained in collision course with those market expectations that expect a Fed’s pivot in the near term
All in all, the Dow Jones dropped 1.33% to 33462, the S&P500 eased 1.19% to 3943 and the tech-heavy Nasdaq Composite retreated 1.09% to 10974.
Further deterioration of the mood among traders could force the Dow Jones to retest the December 2022 low at 32573 (December 22) just ahead of the key 200-day SMA at 32385. The loss of this region could spark a deeper decline to the November 2022 low at 31727 (November 3) prior the minor support at 30206 (October 21 2022) and the 2022 low at 28660 (October 13). Conversely, the next resistance of significance comes at the January high at 34342 (January 13) before the December 2022 top at 34712 (December 13). Once this level is cleared, the index could confront the April 2022 peak at 35492 ahead of the February 2022 high at 35824 (February 9). The daily RSI deflated to the area below 50.
Top Performers: Travelers, Goldman Sachs, Home Depot
Worst Performers: Honeywell, IBM, Coca-Cola
Resistance levels: 34342 34712 35492 (4H chart)
Support levels: 33425 32812 32573 (4H chart)
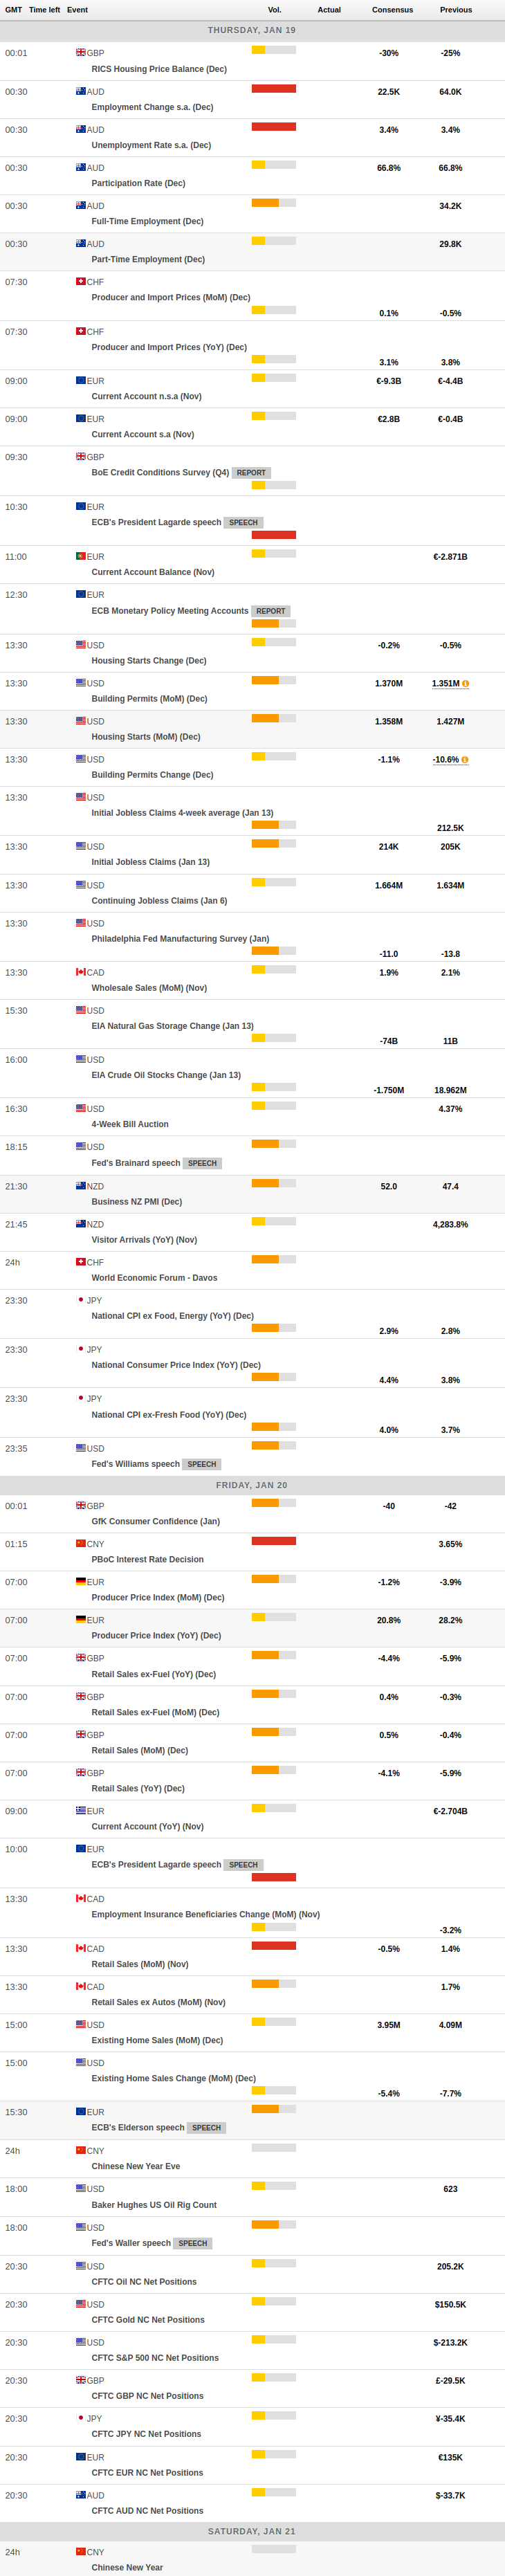
MACROECONOMIC EVENTS
All Information & Updates provided by:

All information relating to the financial markets available on this page has been prepared and issued by FXStreet (Forexstreet SL, Spain, Reg: B62498233) on the basis of publicly available information and all information believed to be reliable and does not conflict with Kuwaiti local laws, and all necessary care has been taken to before the company to ensure that the facts mentioned are correct from the source.
NCM Investment nor any of its directors or employees shall in any way be held responsible for the contents of this news, and the information contained on this page is intended only to provide clients with publicly available information and should not be construed as investment advice, report or analysis and/or constitute an offer or invitation to buy or sell financial instruments of any kind.
RISK WARNING: Forex and CFDs are highly risky leveraged products, as losses can exceed deposits. Please ensure you understand all the risks and take independent advice if necessary. NCM will segregate the clients based on the criteria of the regulator and its bylaws. NCM does not provide any advisory service; the material published does not constitute advice or a recommendation for a transaction in any financial instrument. NCM accepts no responsibility for any use of the content presented and any consequences of that use. Anyone acting on the information provided does so at their own risk.