
- Contact Us:
-

-

-

-


Daily Market Updates
20 Jan 2023
USDJPY
USD/JPY extended the erratic performance so far this week, fading Wednesday’s uptick and returning to the negative territory after another failed attempt to retake the key 129.00 hurdle.
The pair’s negative price action was accompanied by further selling pressure in the greenback and a small bounce in US yields across the curve. Meanwhile, in the Japanese money market, the 10-year JGB yields remained on the defensive and probed once again the sub-0.40% area, as market participants continued to digest Wednesday’s BoJ gathering.
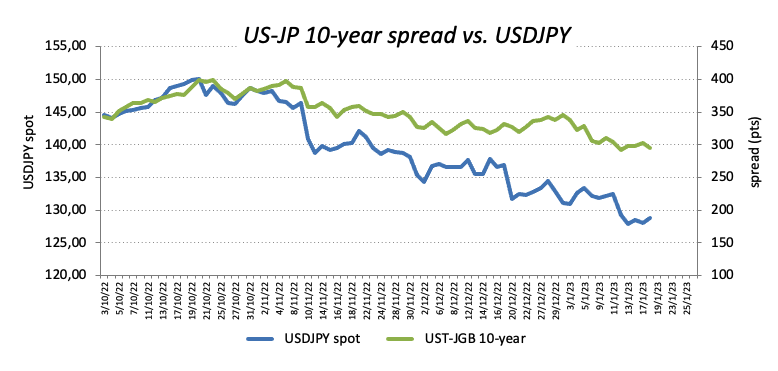
In Japan, the trade deficit shrank to ¥1448.5B in December (from ¥2029B) and Foreign Bond Investment rose to ¥1232.1B in the week to January 14.
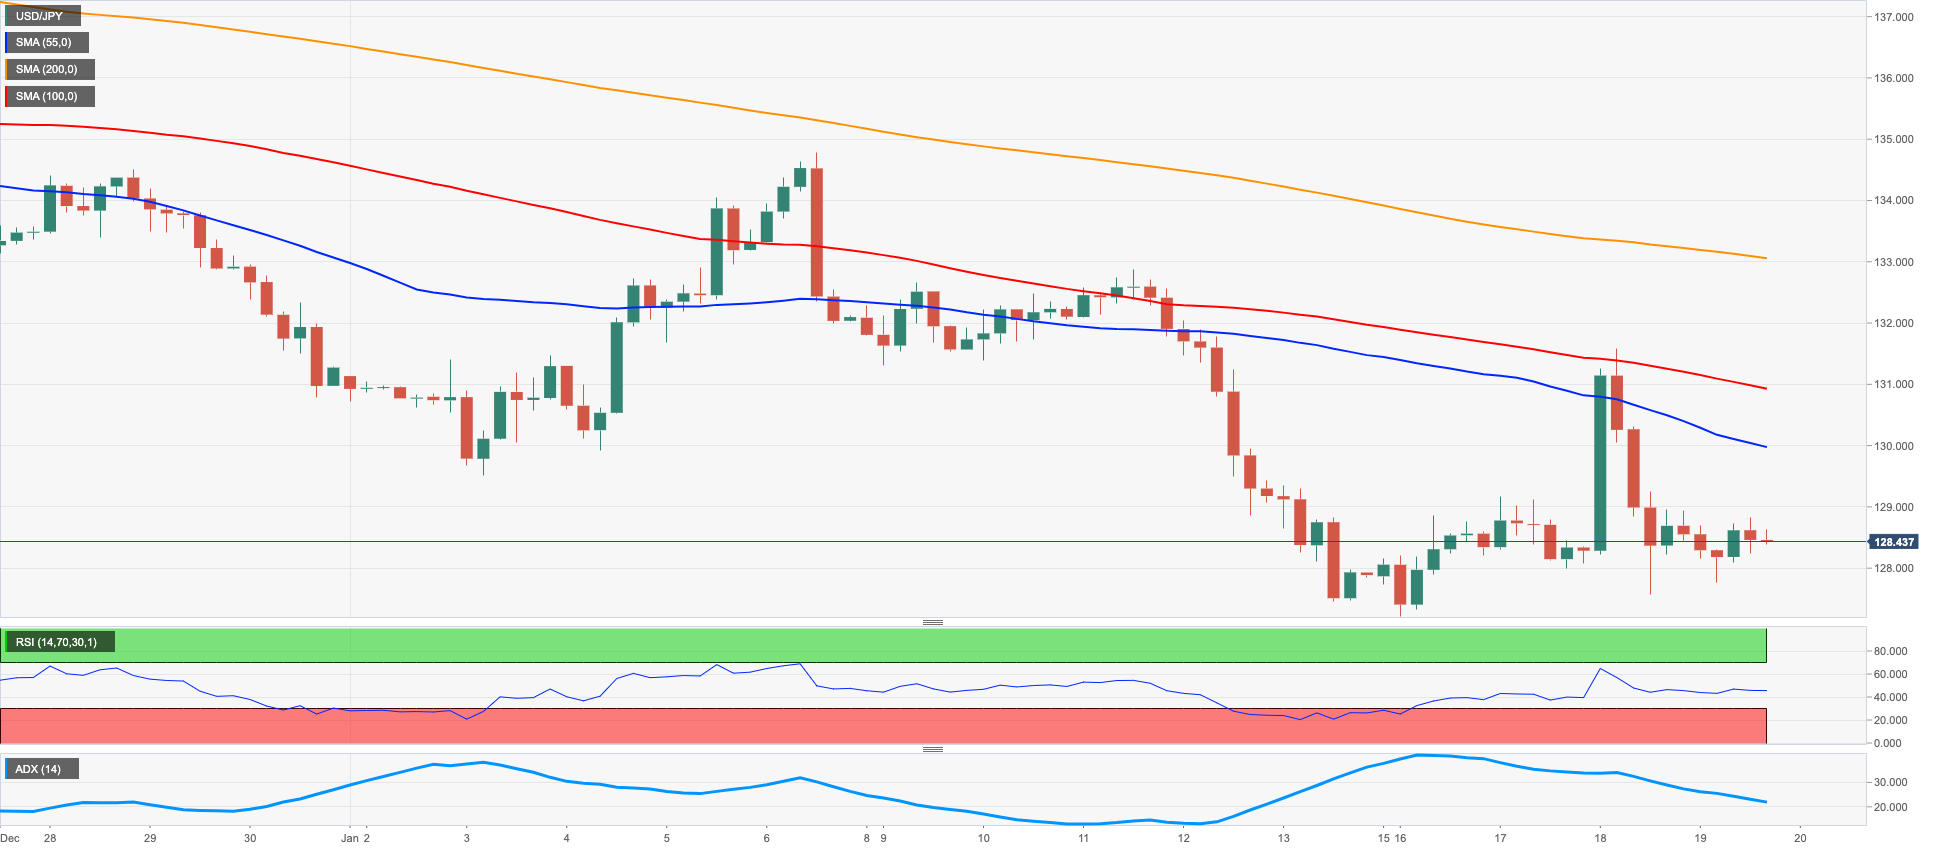
USD/JPY moved into a consolidative range so far this week. Against that, the breakout of the weekly top at 131.57 (January 18) could prompt the January peak at 134.77 (January 6) to emerge on the horizon ahead of the key 200-day SMA at 136.67. Beyond this region appears weekly peaks at 138.17 (December 15 2022) and 139.89 (November 30 2022) prior to the key round level at 140.00. On the contrary, if the pair breaks below the January low at 127.21 (January 16) it could open the door to a drop to the May 2022 low at 126.36 (May 24) before the weekly low at 121.27 (March 31 2022). The daily RSI deflated marginally to the 35 region.
Resistance levels: 130.03 131.57 132.87 (4H chart)
Support levels: 127.21 126.36 125.08 (4H chart)
GBPUSD
GBP/USD prolonged the weekly upside for the third session in a row on Thursday, although another test/surpass of the key 1.2400 hurdle remained elusive.
Indeed, extra gains in Cable remained propped up by the persistent weakness hurting the greenback and the consequent improvement in the risk-linked galaxy.
Around the BoE, Governor A.Bailey said that UK inflation is predicted to significantly drop this spring and suggested a long albeit shallow recession. In addition, Bailey indicated that the policy rate is likely to peak around 4.5% at the time when he reiterated that the labour market remains tight.
In the UK, the RICS House Price Balance dropped 42% in December in what was the only release across the Channel.
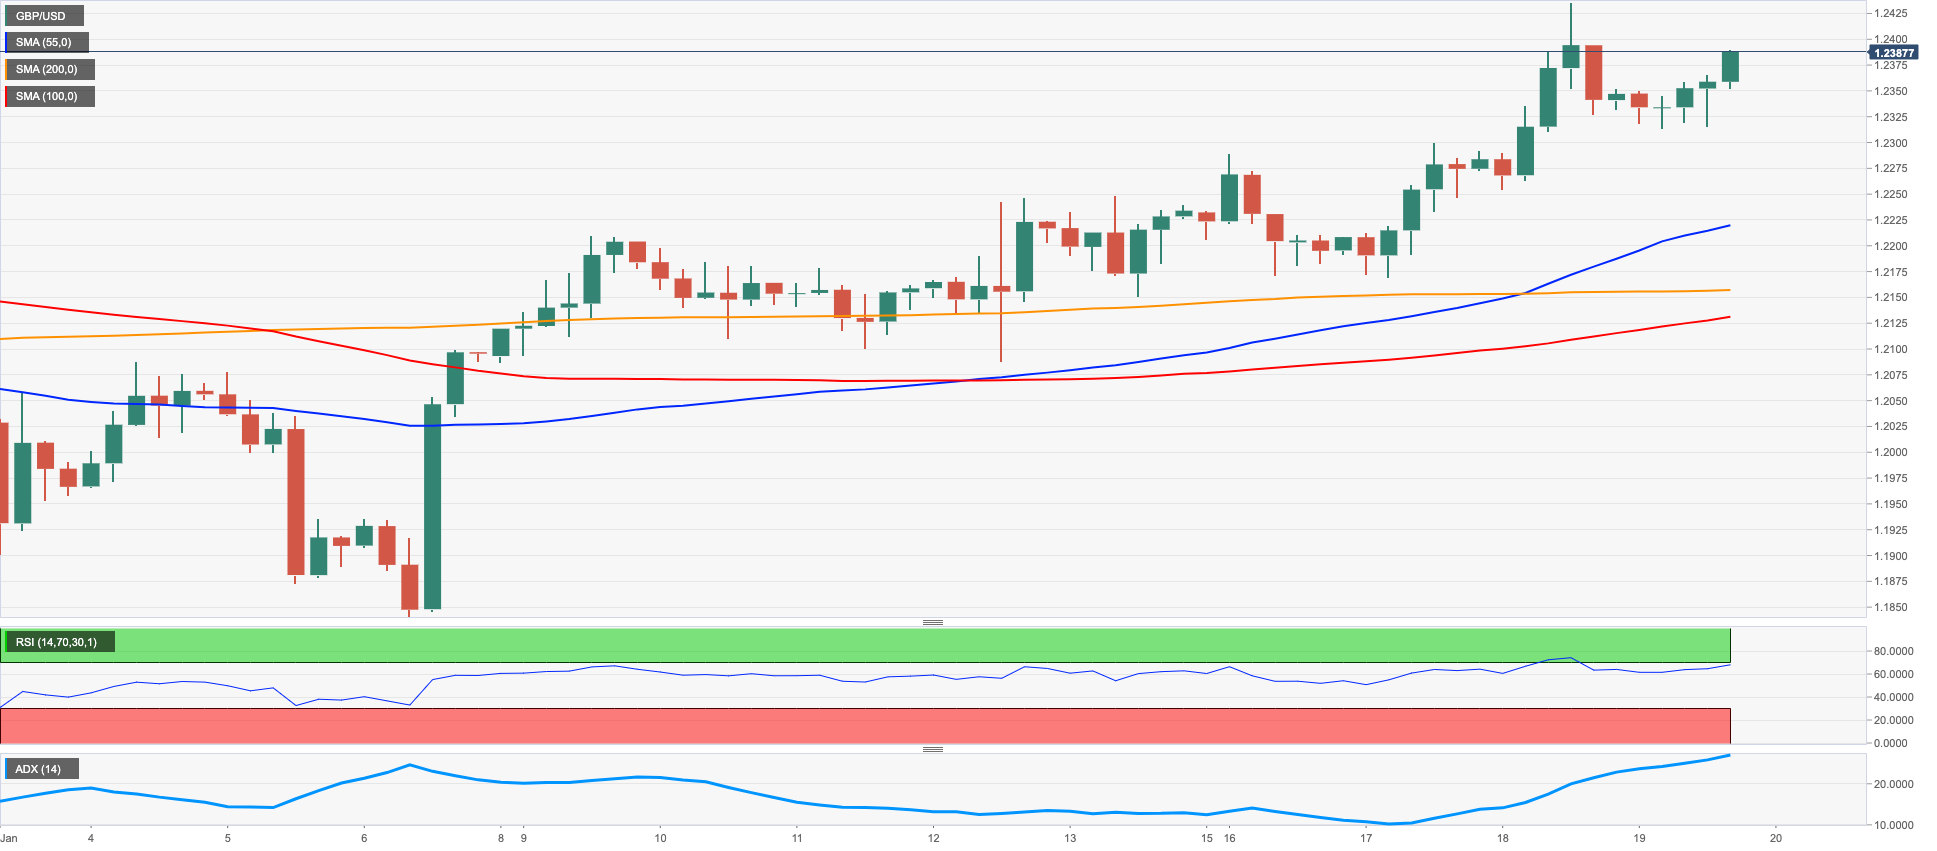
Considering the recent price action, GBP/USD continues to initially target the January top at 1.2435 (January 18) ahead of the December 2022 peak at 1.2446 (December 14). The surpass of this level could put a potential test of the May 2022 high at 1.2666 (May 27) back on the investors’ radar prior to the key 200-week SMA at 1.2909 and the psychological 1.3000 yardstick. On the other hand, the 55-day SMA comes first at 1.2042 closely followed by the key 200-day SMA at 1.1978. A deeper retracement could see the January low at 1.1841 (January 6) revisited before the interim 100-day SMA, today at 1.1712. The daily RSI advanced further and trespassed the 64 yardstick.
Resistance levels: 1.2390 1.2435 1.2446 (4H chart)
Support levels: 1.2253 1.2157 1.2084 (4H chart)
AUDUSD
Sellers appeared in control and dragged AUD/USD to multi-day lows near 0.6870 in what was the second consecutive daily pullback in the pair, which at the same time extended the rejection from Wednesday’s 5-month peaks north of the psychological 0.7000 mark.
In fact, the AUD seems to have suffered the pick-up in the selling pressure after disheartening figures from the Australian labour market report showed the Employment Change shrank by 14.6K people in December and the Unemployment Rate hold steady at 3.5% vs. expectations for a drop to 3.4% in the same month. Still in Oz, Consumer Inflation Expectations rose to 5.6% in January (from 5.2%).
Additionally, the inconclusive price action in the greenback looks to have sufficed to put the Aussie dollar under extra pressure despite another broad-based upbeat session in the commodity complex.
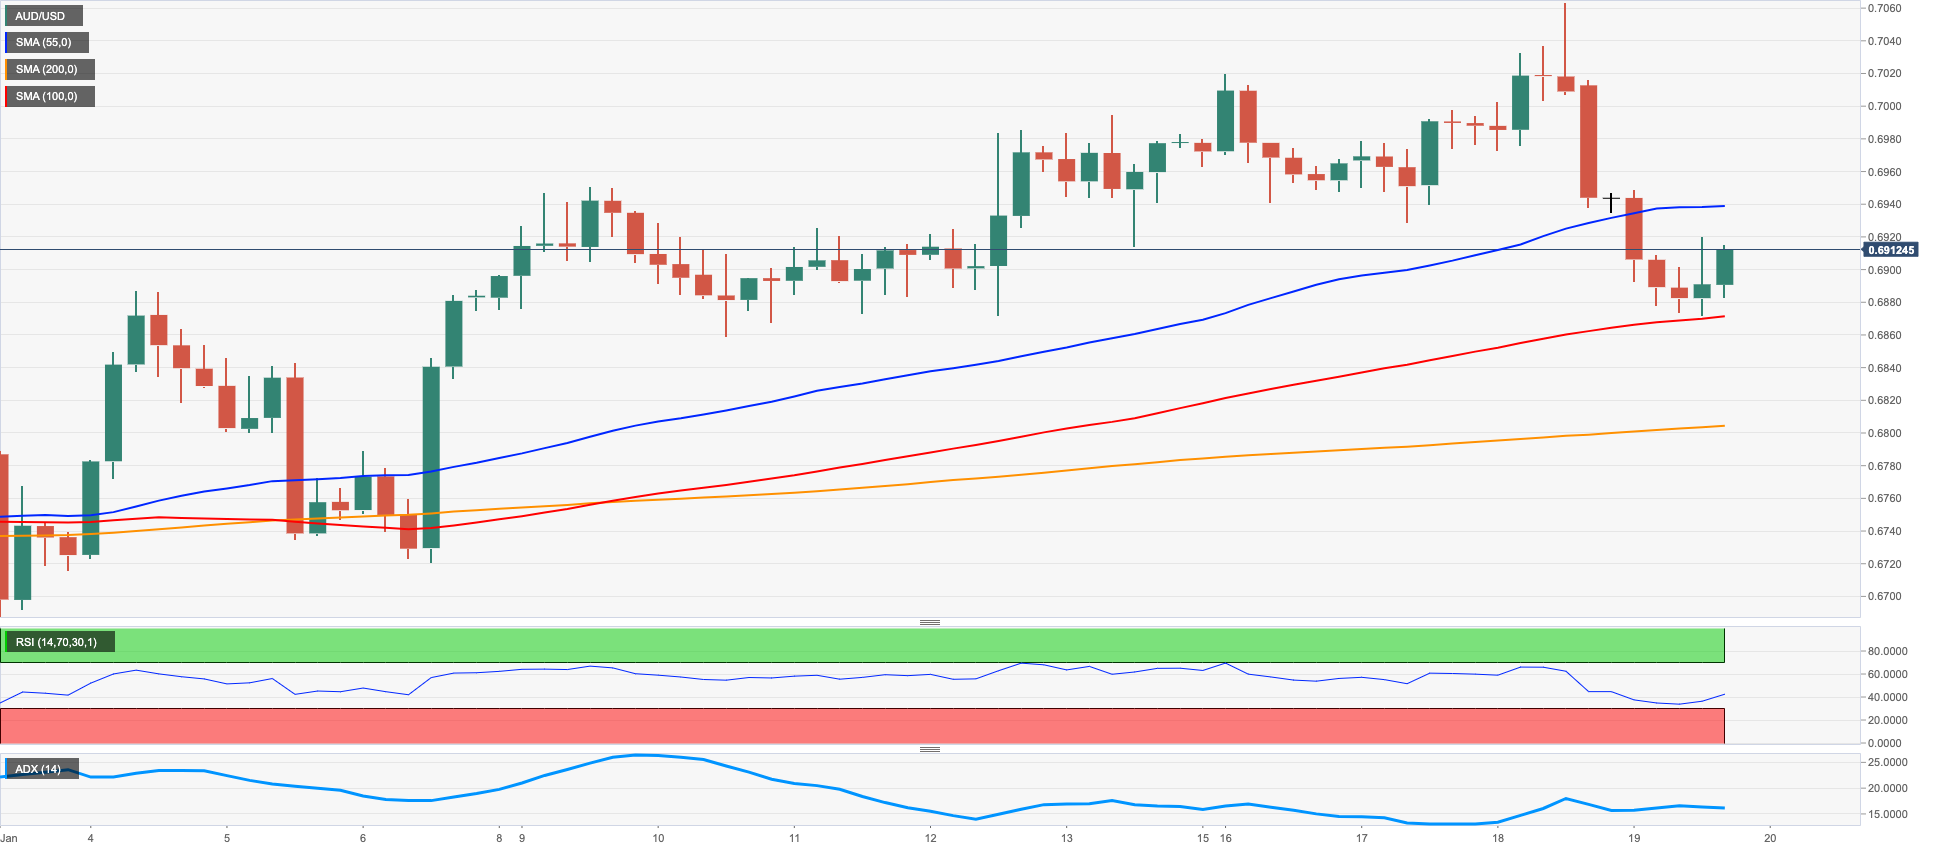
Extra losses in AUD/USD could now see the key 200-day SMA at 0.6819 revisited prior to the interim 55-day SMA at 0.6747 and the January low at 0.6688 (January 3). The loss of the latter exposes the December low at 0.6629 (December 20) ahead of weekly lows at 0.6584 (November 21) and 0.6386 (November 10). By contrast, a move above the 2023 high at 0.7063 (January 16) carries the potential to prompt the August 2022 top at 0.7136 (August 11) to emerge on the horizon before the June 2022 peak at 0.7282 (June 3) and the round level at 0.7300. The daily RSI lost further ground and tested the 56 zone.
Resistance levels: 0.6938 0.7063 0.7136 (4H chart)
Support levels: 0.6871 0.6802 0.6722 (4H chart)
GOLD
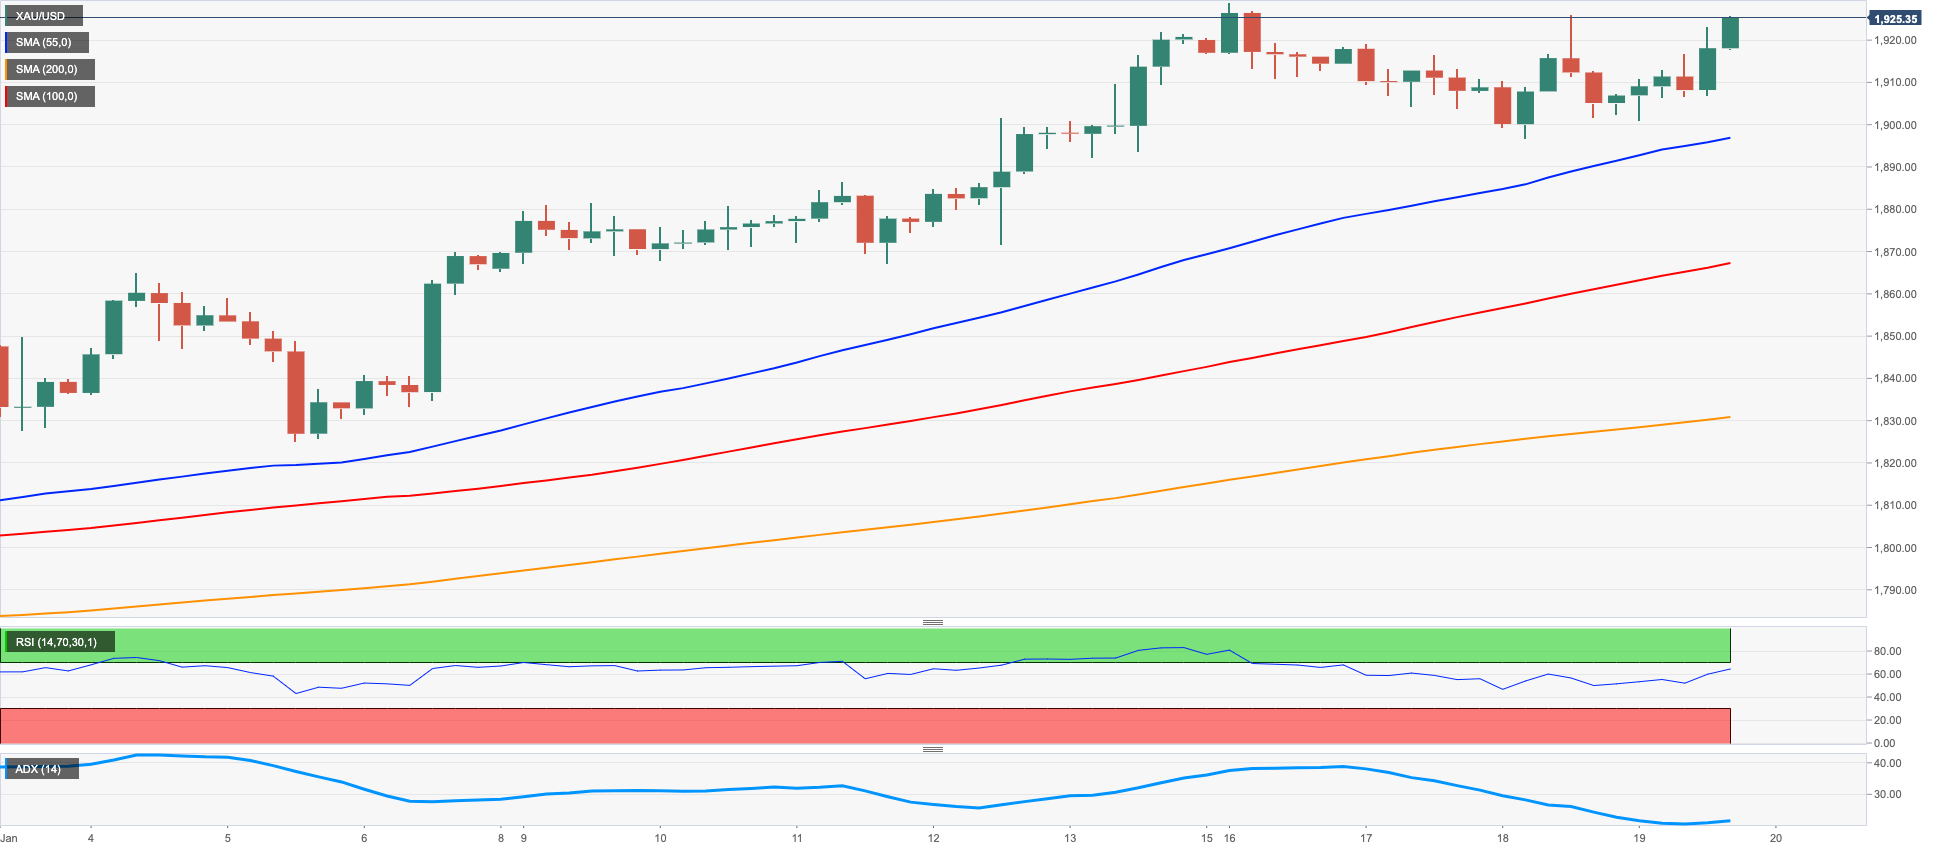
Gold prices reversed the recent 3-day weakness and poked once again with the upper end of the recent range around the $1920 region per ounce troy on Thursday.
Further downside pressure around the greenback fuelled the daily recovery in the yellow metal, while the bounce in US yields across the curve somewhat limited the upside potential.
Meanwhile, the precious metal continues to look to developments from current tightening cycles in major central banks (Fed, ECB and BoE), while the recent dovish surprise from the BoJ seems to have helped in the sentiment around bullion.
The YTD top at $1929 (January 16) remains as the big magnet for bulls for the time being. Once cleared, gold could challenge the April 2022 peak at $1998 (April 18) closely followed by the psychological $2000 yardstick and the 2022 high at $2070 (March 8). On the flip side, there are initial contention levels at $1867 (January 11) and $1825 (January 5) prior to the more relevant 200-day SMA at $1777. In the same line, the latter appears reinforced by the weekly low at $1773 (December 15) and comes ahead of the December low at $1765 (December 5) and the weekly low at $1727 (November 23).
Resistance levels: $1929 $1955 $1982 (4H chart)
Support levels: $1896 $1867 $1829 (4H chart)
CRUDE WTI
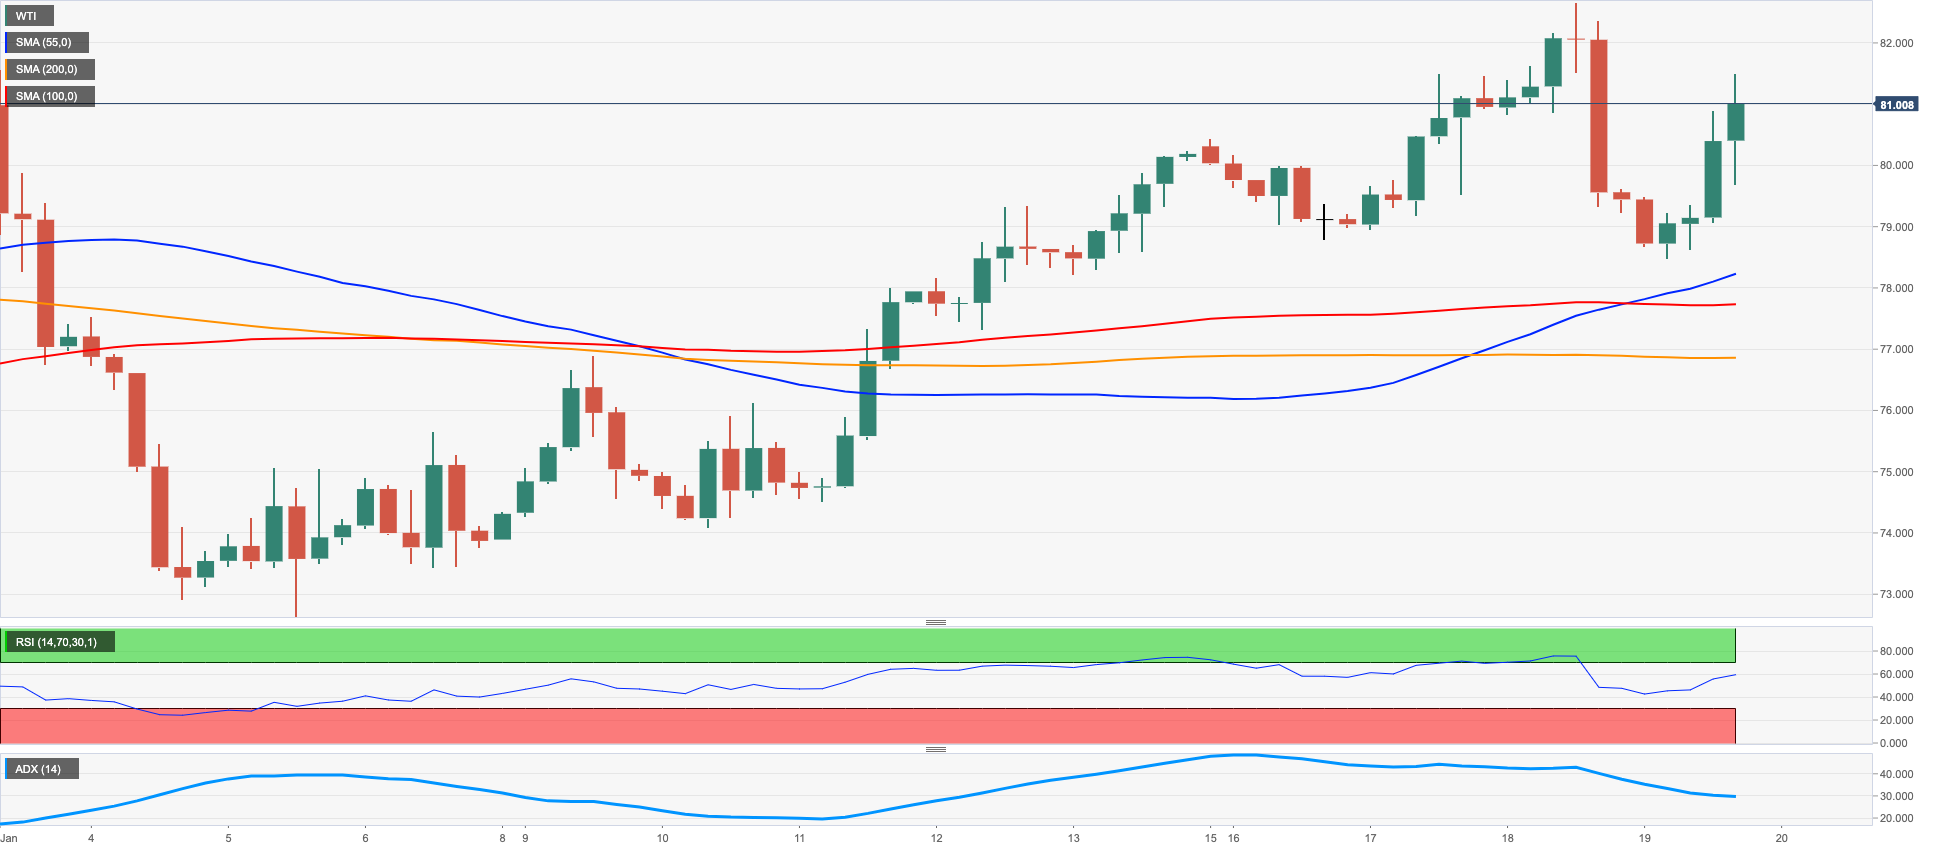
WTI prices managed to reverse an earlier drop to new weekly lows near $78.00 and advance past the $81.00 mark per barrel on Thursday.
The move higher in the commodity came amidst rising optimism surrounding the positive prospects for Chinese demand for crude oil.
The latter was underpinned by comments from IEA’s Executive Director Birol, who sees stronger demand for crude oil in line with the expected rebound in the Chinese economy. In addition, Birol suggested that markets may be tighter than predicted in 2023 at the time when he hinted at a deeper drop of Russian oil exports in Q1 and beyond.
Adding extra upside bias, US weekly distillate stocks shrank by 1.939M barrels in the week to January 13 according to the EIA’s report. In addition, US crude oil inventories rose by 8.408M barrels, supplies at Cushing went up by 3.646M barrels and gasoline stockpiles increased by 3.483M barrels.
The continuation of the uptrend in the WTI is expected to meet the next obstacle at the January high at $82.35 (January 18) prior to the December 2022 top at $83.32 (December 1). The breakout of this level could pave the way for a move to the $90.08 level (November 11 2022) followed by the 200-day SMA at $92.97 and the November 2022 peak at $93.73. Contrarily, the January low at $72.50 (January 5) offers initial contention seconded by the 2022 low at $70.10 (December 9) and just before the key round level at $70.00. South from here emerges the weekly low at $66.15 (December 20 2021) prior to the 200-week SMA at $65.61 and the December 2021 low at $62.46 (December 2).
Resistance levels: $81.44 $82.35 $83.32 (4H chart)
Support levels: $78.08 $76.92 $72.42 (4H chart)
GER40
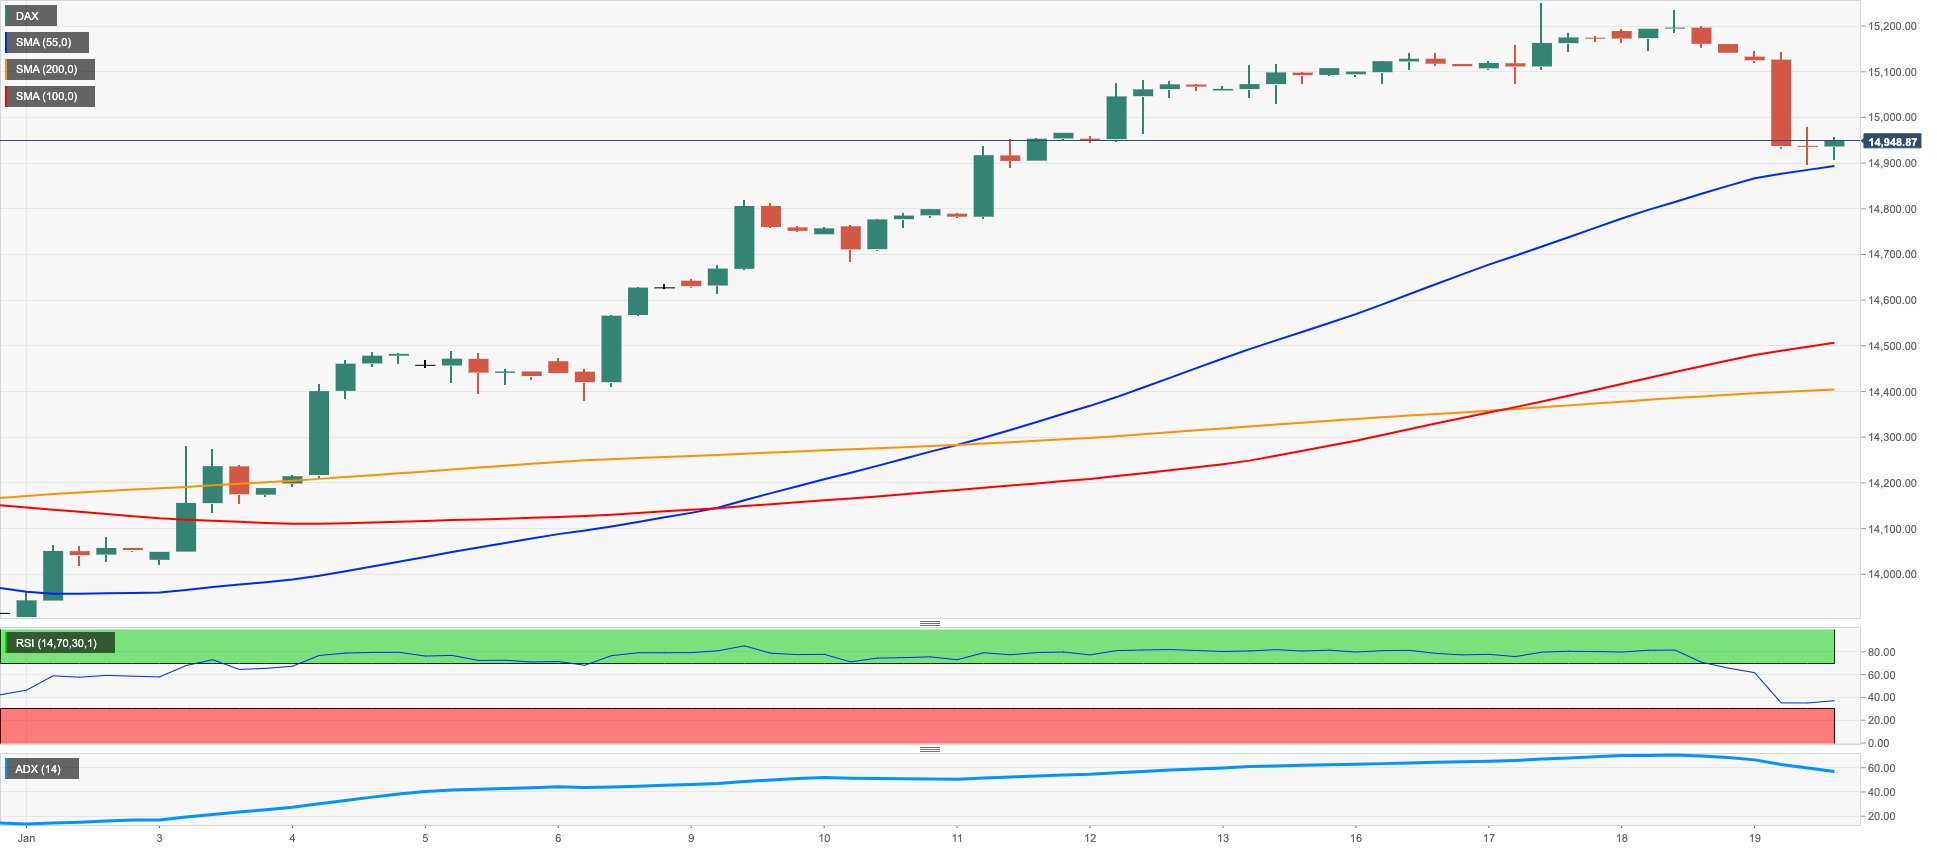
The German stock reference DAX 40 saw its weekly correction intensify on Thursday and revisit the sub-15000 mark on the back of the resumption of recession fears in the global markets.
In fact, the hawkish narrative from Fed speakers was followed by ECB officials, who advocated for the continuation of the tightening cycle by the ECB and even left the door open to extra 50 bps rate hikes at the future gatherings.
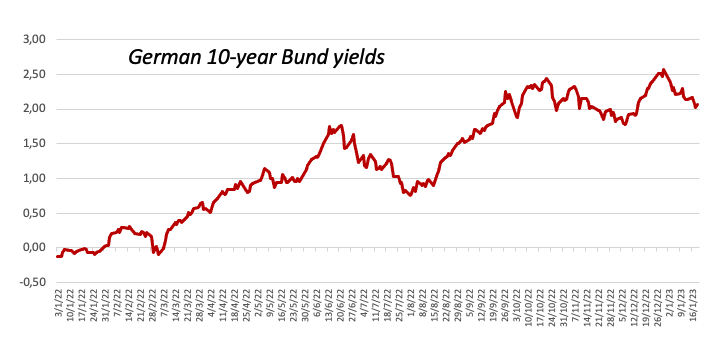
Following the above, the German money market showed the 10-year Bund yields recover some ground lost and flirt with the 2.10% region on Thursday.
Despite the knee-jerk, the outlook for the DAX appears constructive for the time being. Against that, the initial resistance remains at the 2023 top at 15262 (January 17) ahead of the 2022 peak at 16285 (January 5). Conversely, the 55-day SMA at 14315 offers interim contention prior to the December 2022 low at 13791 (December 20) and the key 200-day SMA at 13586, an area also reinforced by the 100-day SMA at 13593. The loss of this region could put a potential visit to the November 2022 low at 13022 (November 3) back on the investors’ radar ahead of the minor support at 12548 (October 21 2022). The daily RSI corrected lower and flirted with 61.
Best Performers: Beiersdorf AG, Hannover Rueck SE, E.ON SE
Worst Performers: Continental AG, Zalando SE, Adidas
Resistance levels: 15269 15542 15614 (4H chart)
Support levels: 14906 14582 14414 (4H chart)
NASDAQ
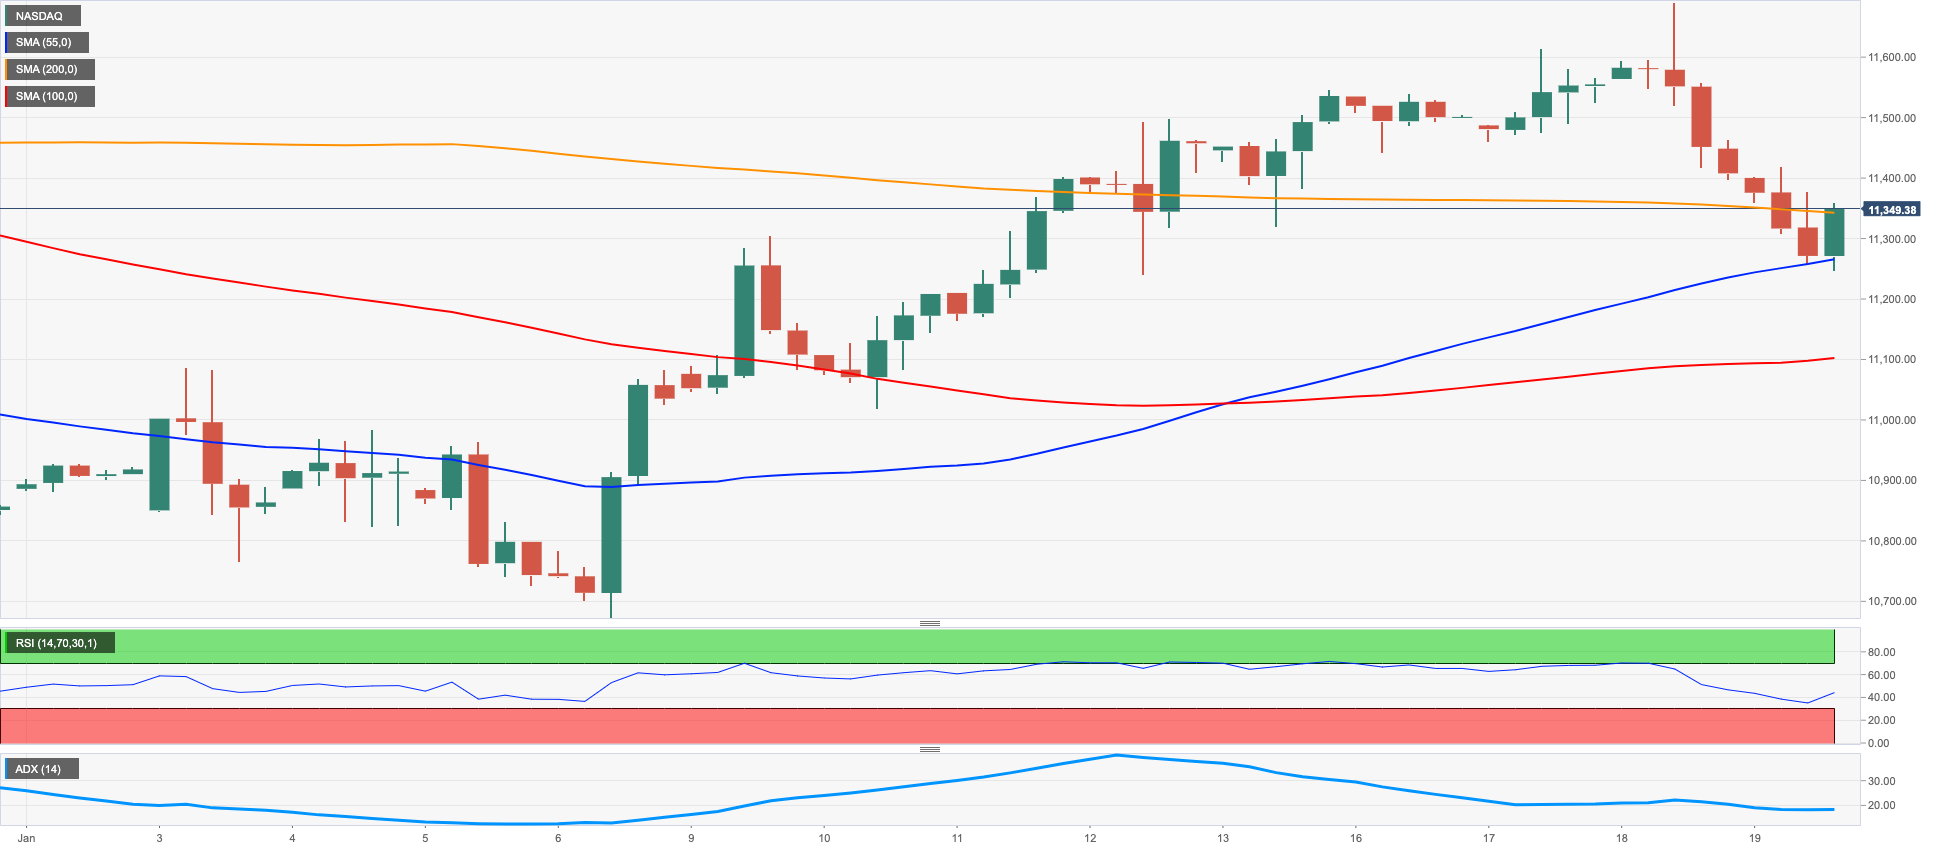
In line with the rest of its US peers, the Nasdaq 100 index retreated further, charted the third consecutive daily pullback and printed new multi-session lows, this time in the boundaries of the 11200 zone.
The rebound in US yields across the curve, hawkish Fedspeak and the resumption of recession fears fuelled the selling interest in the tech sector and dragged the index to the vicinity of the 55-day SMA (11221).
Despite market participants almost fully pricing in a 25 bps rate hike by the Fed at the February 1 meeting, it remains to be seen whether the central bank would introduce a pivot in its normalization process in the near term, something that still looks quite far away as per recent comments from Fed officials.
Occasional bouts of strength in the Nasdaq 100 are seen facing the next hurdle at the January top at 11690 (January 18) ahead of the key 200-day SMA at 12082 and the December 2022 peak at 12166 (December 13). The surpass of this level could encourage the index to confront the September 2022 high at 12752 (September 12). On the opposite side, the breach of the weekly low at 11384 (January 19) could put the January low at 10696 (January 6) to the test prior to the December 2022 low at 10671 (December 22). Extra losses could retest the November 2022 low at 10632 (November 4) before the 2022 low at 10440 (October 13). The daily RSI lost further ground and approached 50.
Top Gainers: Meta Platforms, Alphabet C, Pinduoduo
Top Losers: Lucid Group, Enphase, Rivian Automotive
Resistance levels: 11489 11690 12166 (4H chart)
Support levels: 11251 11050 10696 (4H chart)
DOW JONES
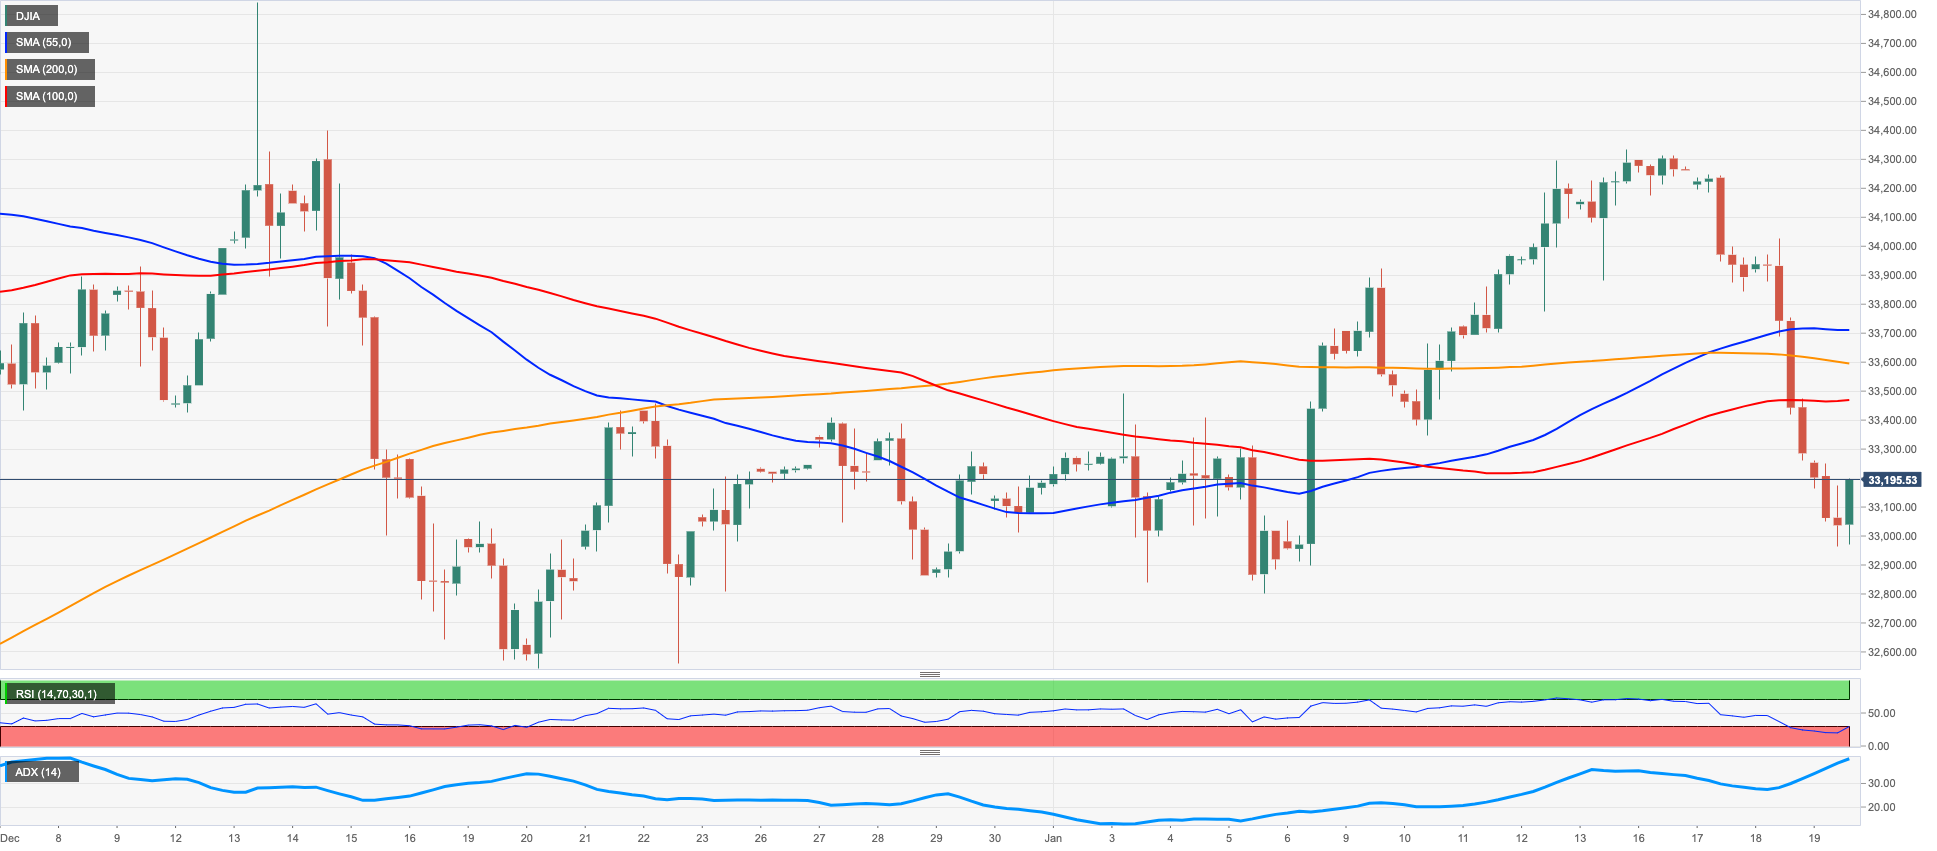
Equities measured by the Dow Jones added to the weekly decline and probed the area of multi-day lows just below the 33000 mark on Thursday.
Indeed, US stocks succumbed to recession concerns after another strong print from the weekly Claims reignited speculation that the Fed’s impasse in its tightening cycle remains a long shot.
Supporting the above appeared comments from Fed’s policy makers, who continued to favour a (rapid) move in rates to levels above 5.0% and to stay there for some time.
Overall, the Dow Jones deflated 0.55% to 33115, the S&P500 dropped 0.65% to 3903 and the tech-benchmark Nasdaq Composite surrendered 1.03% to 10844.
Losses in the Dow Jones are expected to gather further traction on a breakdown of the December 2022 low at 32573 (December 22), which precedes the key 200-day SMA at 32376. Further down emerges the November 2022 low at 31727 (November 3) before the minor support at 30206 (October 21 2022) and the 2022 low at 28660 (October 13). Inversely, there are no changes to the topside, where the January top at 34342 (January 13) appears as the immediate up barrier seconded by the December 2022 peak at 34712 (December 13). The breakout of the latter exposes is cleared the April 2022 high at 35492 seconded by the February 2022 top at 35824 (February 9). The daily RSI grinded lower to the sub-45 region.
Top Performers: UnitedHealth, Merck&Co, IBM
Worst Performers: Home Depot, 3M, American Express
Resistance levels: 34342 34712 35492 (4H chart)
Support levels: 32982 32573 32205 (4H chart)
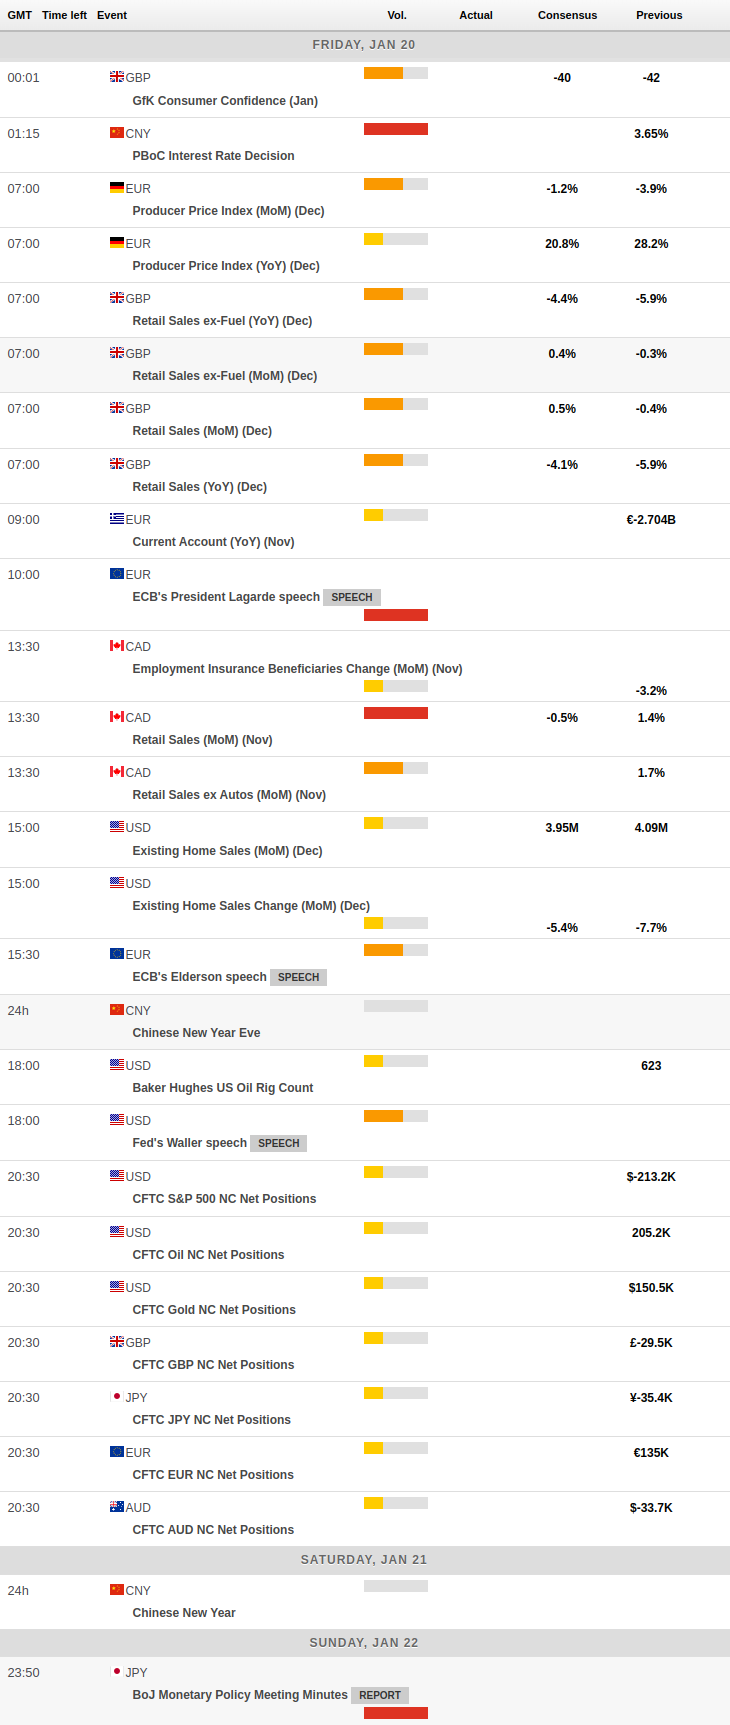
MACROECONOMIC EVENTS
All Information & Updates provided by:

All information relating to the financial markets available on this page has been prepared and issued by FXStreet (Forexstreet SL, Spain, Reg: B62498233) on the basis of publicly available information and all information believed to be reliable and does not conflict with Kuwaiti local laws, and all necessary care has been taken to before the company to ensure that the facts mentioned are correct from the source.
NCM Investment nor any of its directors or employees shall in any way be held responsible for the contents of this news, and the information contained on this page is intended only to provide clients with publicly available information and should not be construed as investment advice, report or analysis and/or constitute an offer or invitation to buy or sell financial instruments of any kind.
RISK WARNING: Forex and CFDs are highly risky leveraged products, as losses can exceed deposits. Please ensure you understand all the risks and take independent advice if necessary. NCM will segregate the clients based on the criteria of the regulator and its bylaws. NCM does not provide any advisory service; the material published does not constitute advice or a recommendation for a transaction in any financial instrument. NCM accepts no responsibility for any use of the content presented and any consequences of that use. Anyone acting on the information provided does so at their own risk.