
- Contact Us:
-

-

-

-


Daily Market Updates
23 Jan 2023
USDJPY
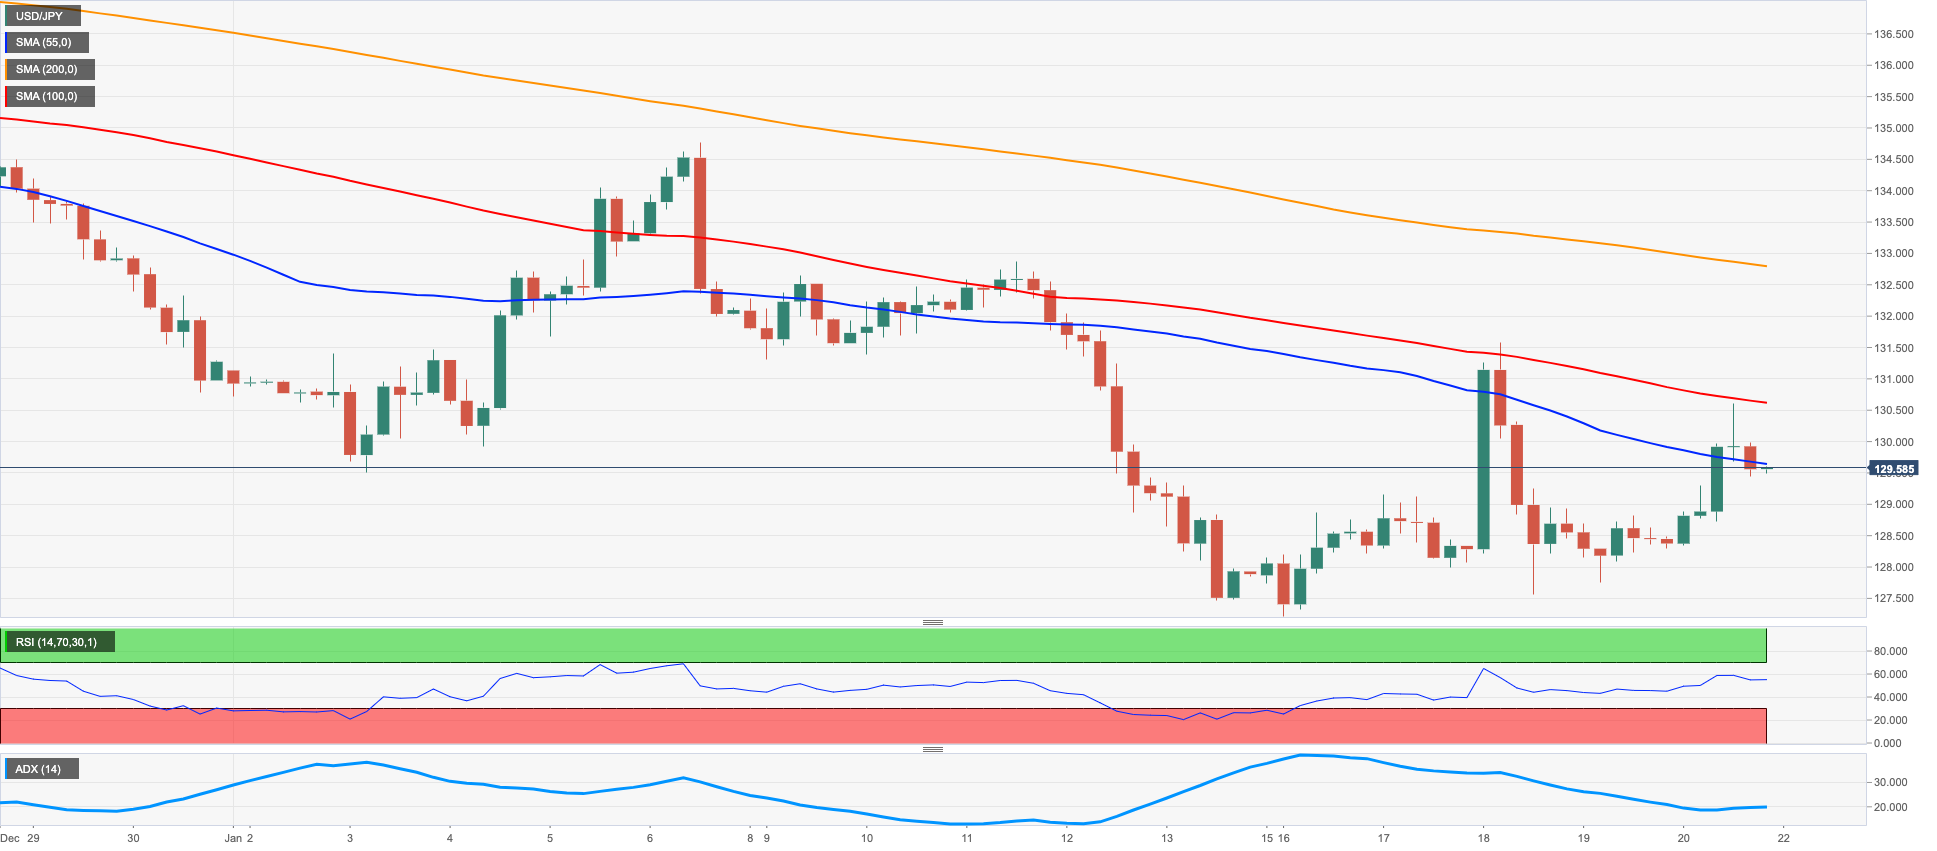
USD/JPY once again regained the key 130.00 mark and beyond on Friday, although it could not sustain that move and eventually ended the session in the mid-129.00s.
Last week was a very volatile one for the pair, which was particularly exacerbated by the BoJ event (January 18) and the subsequent sharp depreciation of the Japanese currency. All in all, spot closed the week in the positive territory and remains to be seen whether the so far 2023 low at 127.21 (January 16) now morphs into an interim low.
In the meantime, higher US yields across the curve also accompanied the uptick in the pair, while Japan 10-year JGB yields extended the leg lower to the vicinity of the 0.35% region.
From the BoJ, Governor Kuroda reiterated that the bank would continue with the expansionary policy, adding that inflation is seen starting to decline in February and could drop below 2% during this year.
In the Japanese docket, both the headline Inflation Rate and the Core Inflation Rate rose at an annualized 4.0% in December, while the inflation Rate Ex-Food and Energy advanced 3% YoY.
USD/JPY faces the next hurdle at the weekly peak at 131.57 (January 18) ahead of the January high at 134.77 (January 6). Further up comes the 55-day SMA at 135.60 seconded by the key 200-day SMA at 136.69 and weekly tops at 138.17 (December 15 2022) and 139.89 (November 30 2022), all ahead of the key round level at 140.00. On the other hand, the loss of the January low at 127.21 (January 16) could expose a deeper drop to the May 2022 low at 126.36 (May 24) ahead of the weekly low at 121.27 (March 31 2022). The daily RSI improved past the 40 mark.
Resistance levels: 130.61 131.57 132.85 (4H chart)
Support levels: 127.21 126.36 125.08 (4H chart)
GBPUSD
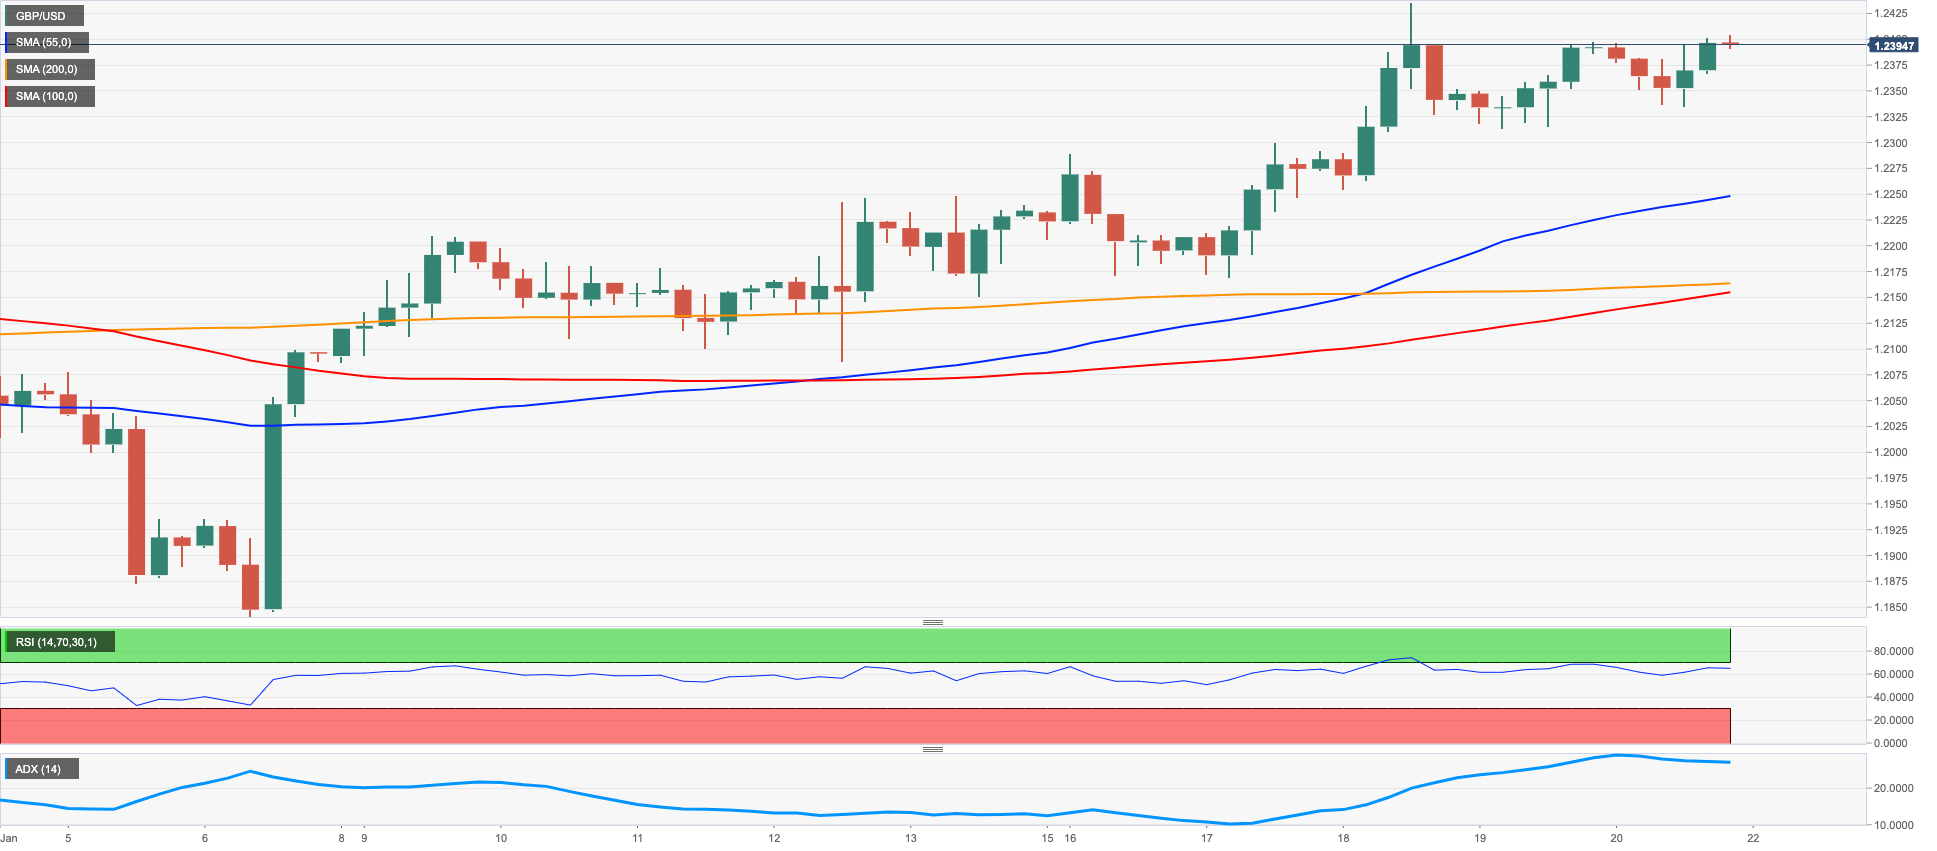
GBP/USD closed the fourth consecutive week with gains around the 1.2400 neighbourhood on Friday, up as well for the fourth session in a row and leaving the door open to the continuation of the uptrend in the short term.
The positive performance in cable during the past sessions was underpinned by the inconclusive activity in the greenback and the better tone in the risk complex in general, while comments from BoE’s Bailey earlier in the week somewhat lent legs to Sterling.
It is worth recalling that Governor A.Bailey expects a long and shallow recession this year and sees inflation significantly dropping this spring, while rates could peak around 4.5%.
In the UK calendar, Consumer Confidence tracked by Gfk deteriorated to -45 and Retail Sales contracted 1.0% MoM in December and 5.8% over the last twelve months.
Next on the upside for GBP/USD appears the 2023 peak at 1.2435 (January 18) prior to the December 2022 high at 1.2446 (December 14) and the May 2022 top at 1.2666 (May 27). Further north comes the key 200-week SMA at 1.2909 which precedes the psychological 1.3000 mark. Just the opposite, there is provisional support at the 55-day SMA at 1.2061, closely followed by the key 200-day SMA at 1.1975. South from here emerges the January low at 1.1841 (January 6) prior to the temporary 100-day SMA, today at 1.1721. The daily RSI consolidated around the 65 region.
Resistance levels: 1.2404 1.2435 1.2446 (4H chart)
Support levels: 1.2312 1.2257 1.2162 (4H chart)
AUDUSD
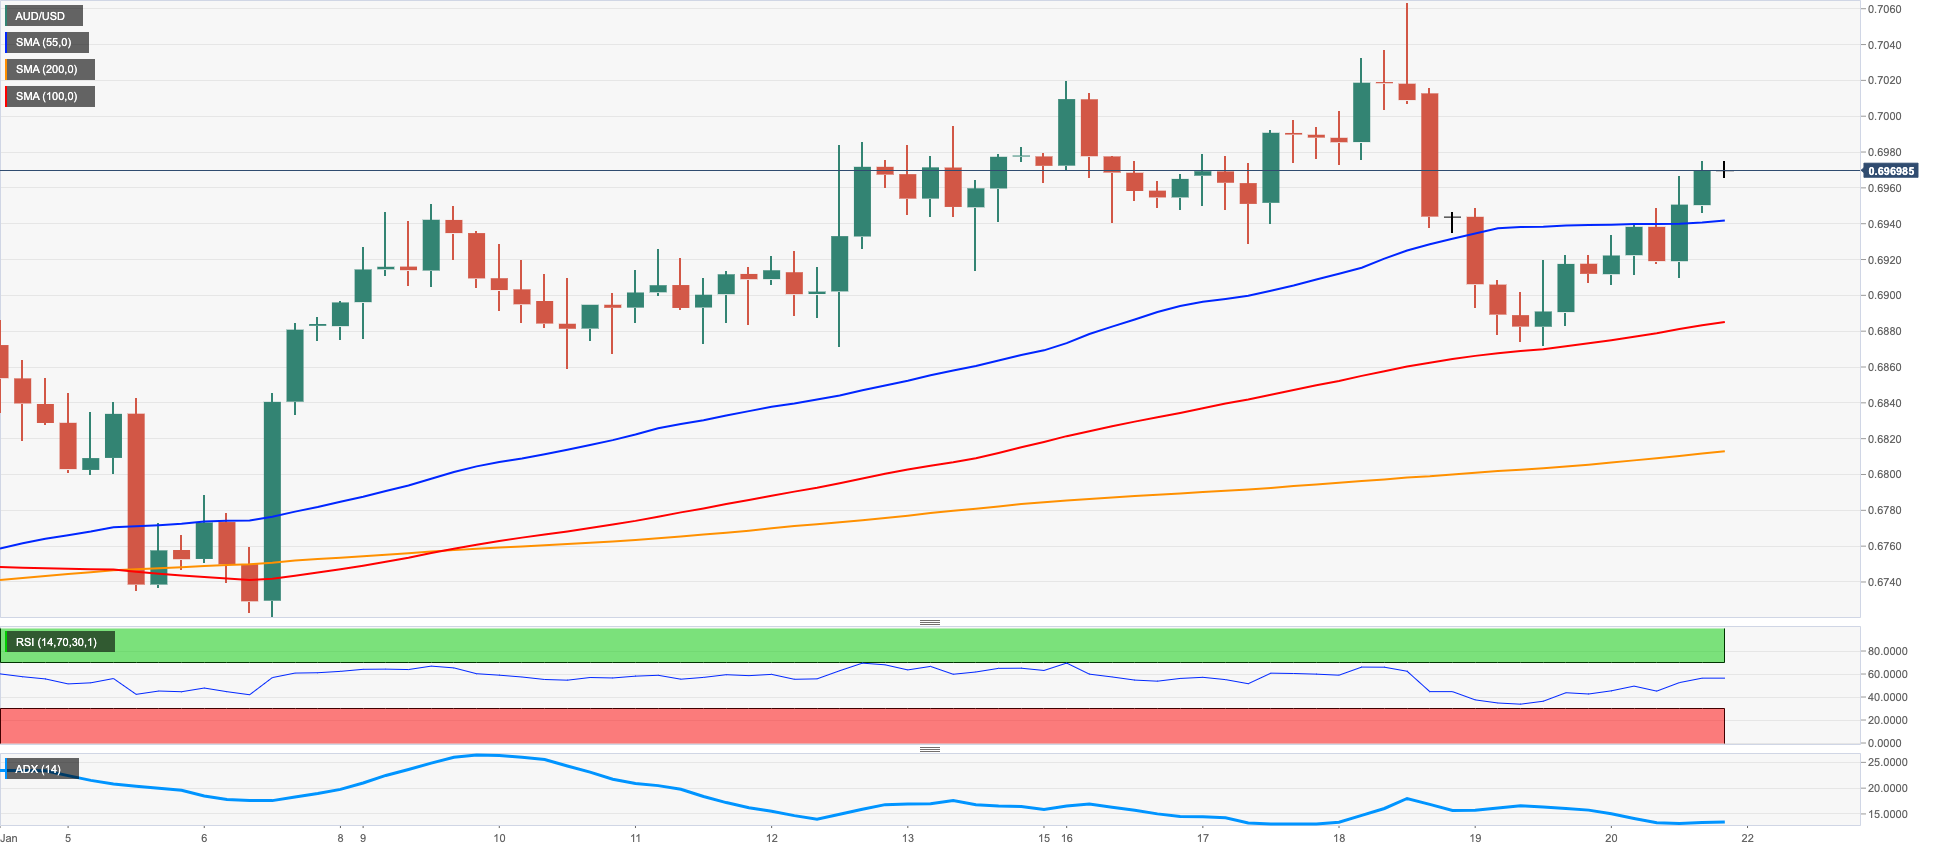
AUD/USD set aside two consecutive daily drops and posted strong gains on Monday, this time climbing to 2-day highs near the 0.6970 region.
The vacillating performance in the greenback supported the improvement in the risk-linked galaxy, while the broad-based mood in the commodity universe also lent wings to the Aussie dollar. On this, both copper prices and the tonne of iron ore extended the ongoing rally.
The Australian docket remained empty at the end of the week, whereas the next release of note will be the preliminary Manufacturing/Services PMI readings for the month of January.
The continuation of the uptrend in AUD/USD needs to clear the 2023 top at 0.7063 (January 16) to allow for a probable visit to the August 2022 peak at 0.7136 (August 11). The breakout of the latter could put the June 2022 high at 0.7282 (June 3) back on the investors’ radar prior to the round level at 0.7300. On the contrary, the breach of the weekly low at 0.6871 (January 19) could put the key 200-day SMA at 0.6817 to the test ahead of the temporary 55-day SMA at 0.6757 and the January low at 0.6688 (January 3). Down from here aligns the December low at 0.6629 (December 20) seconded by weekly lows at 0.6584 (November 21) and 0.6386 (November 10). The daily RSI gathered pace and trespassed 60.
Resistance levels: 0.6973 0.7063 0.7136 (4H chart)
Support levels: 0.6871 0.6859 0.6807 (4H chart)
GOLD
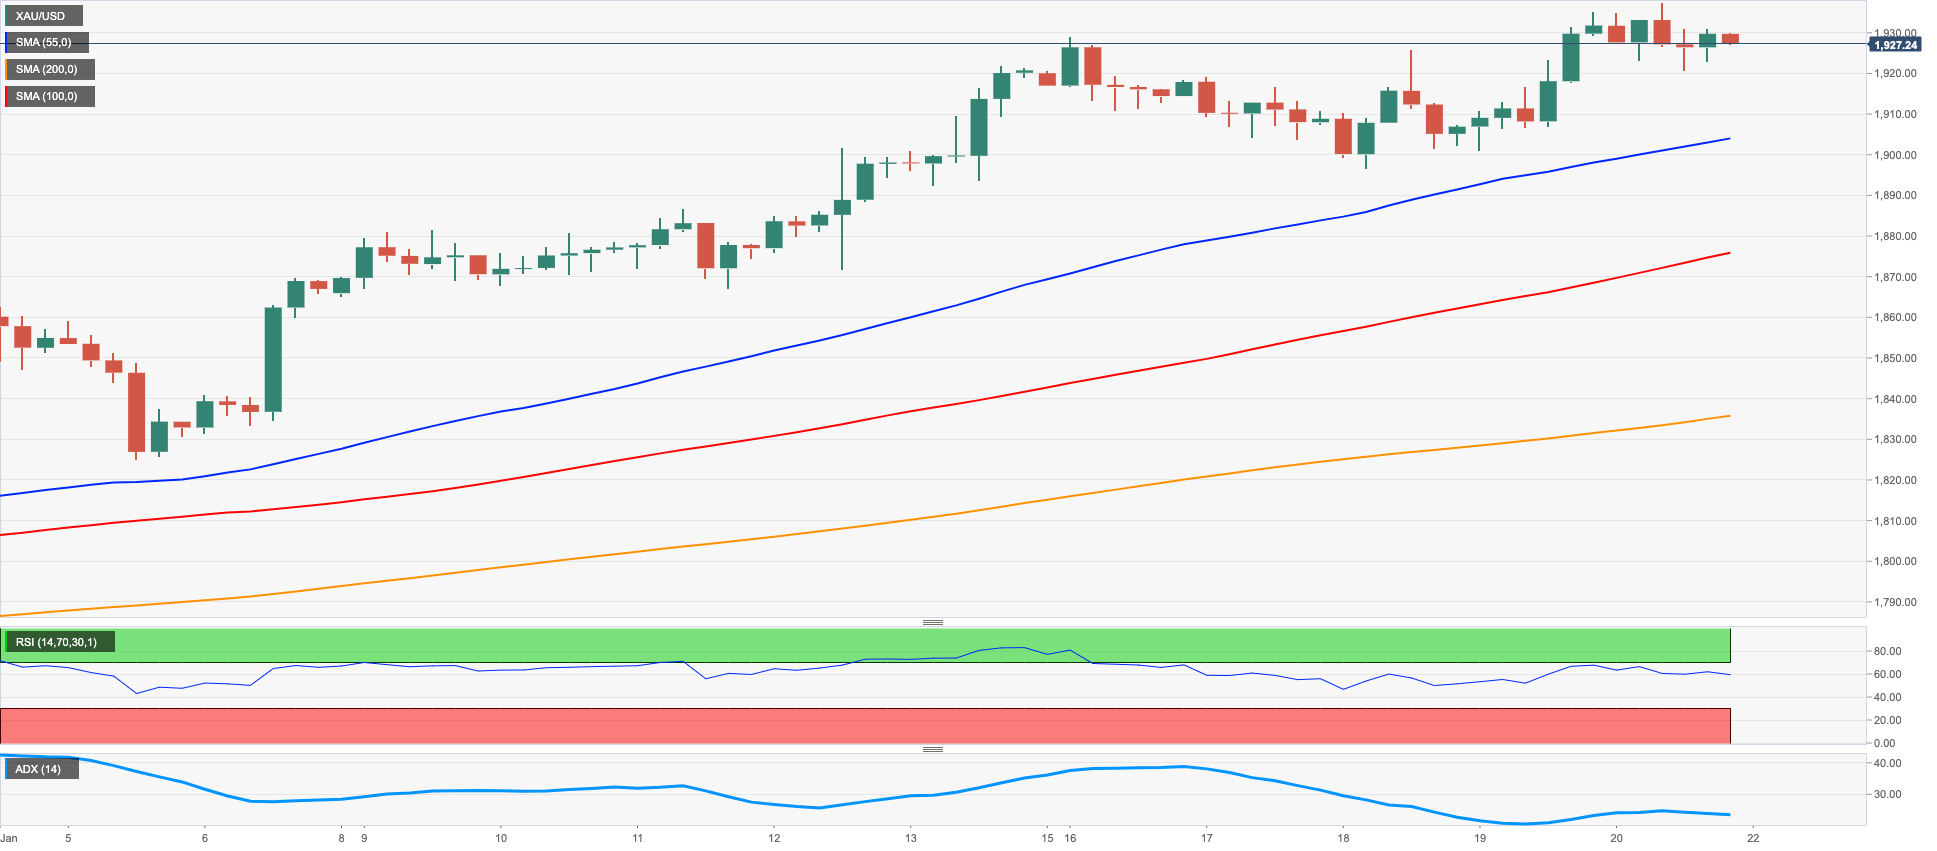
Some profit taking mood and higher US yields prompted prices of the ounce troy of the yellow metal to give away part of the previous day’s strong gains and ease to the vicinity of the $1920 mark on Friday.
Indeed, US yields added to Thursday’s gains and advanced on quite a firm note, always following the persevering hawkish rhetoric from Fed’s policy makers and their conviction that the tightening cycle should continue until rates surpass the 5% level.
In the meantime, bullion advanced for the fifth consecutive week and navigated an area last visited back in late April 2022 north of the $1900 mark.
Gold printed a new 2023 peak at $1937 (January 20). The surpass of this level could allow for a potential visit to the April 2022 high at $1998 (April 18) just ahead of the psychological $2000 mark and the 2022 top at $2070 (March 8). By contrast, weekly lows at $1896 (January 18) and $1867 (January 11) are expected to come first prior to the 55-day SMA at $1798 and the more relevant 200-day SMA at $1777. The loss of the latter could open the door to the 100-day SMA at $1742 before the weekly low at $1727 (November 23).
Resistance levels: $1937 $1955 $1982 (4H chart)
Support levels: $1920 $1902 $1896 (4H chart)
CRUDE WTI
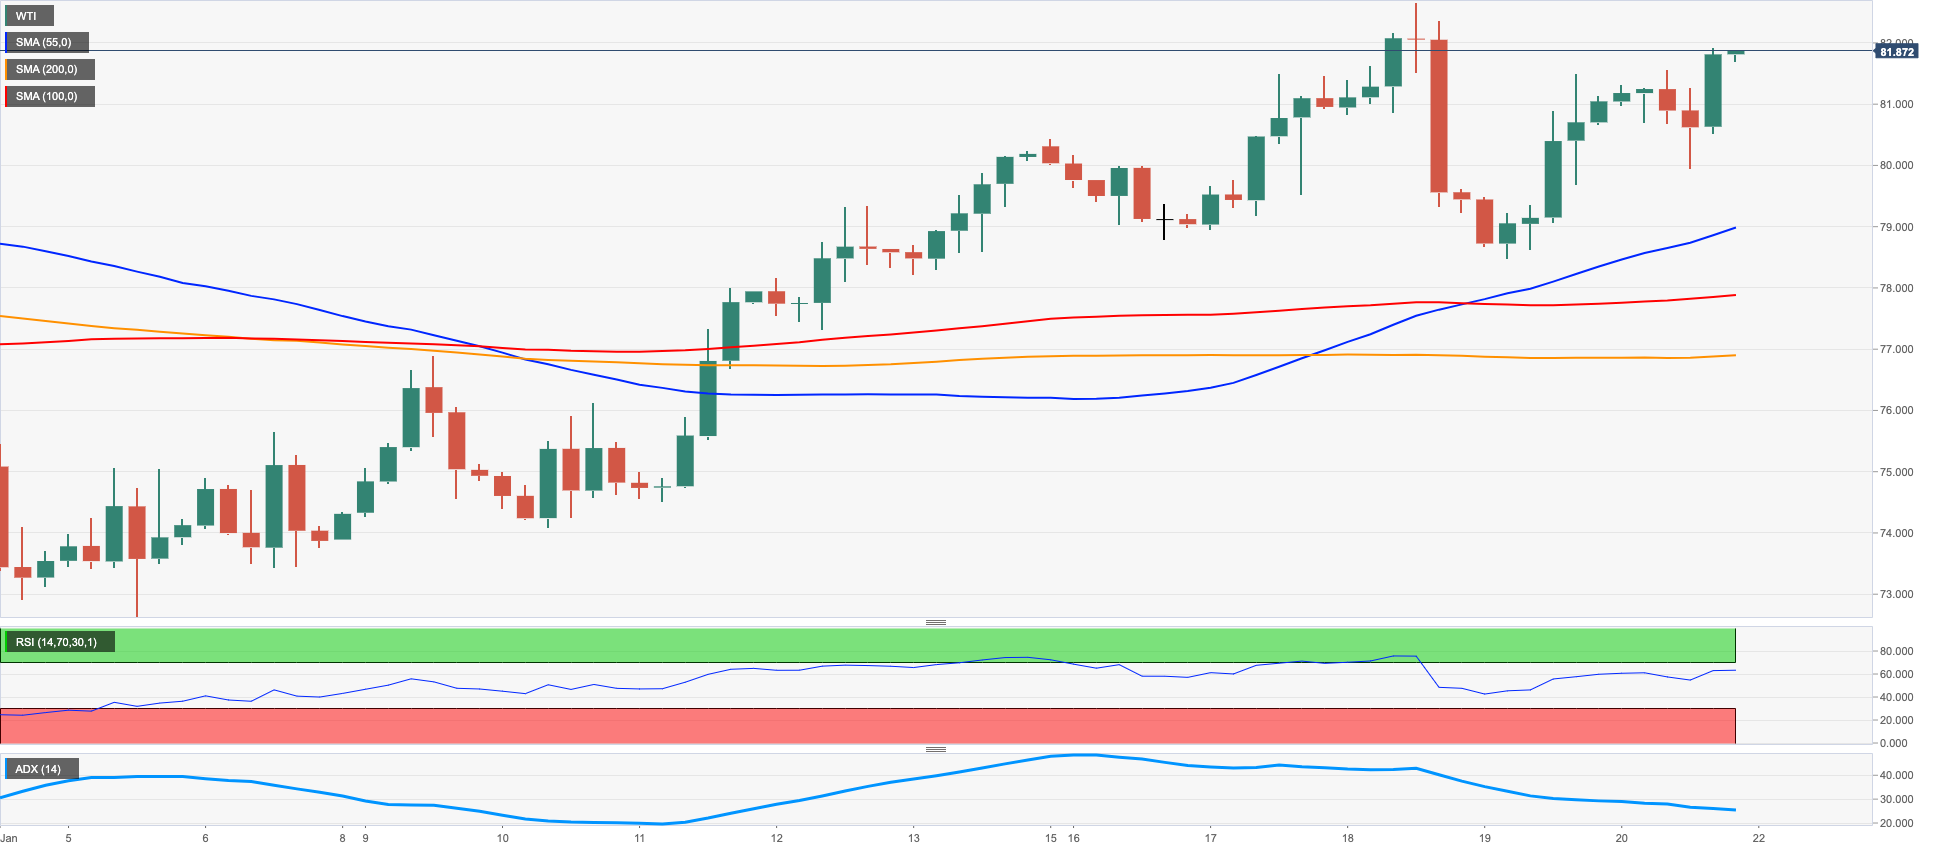
Prices of the American reference for the sweet light crude oil ended the week in an upbeat mood and closed the second consecutive week with gains, this time near the $82.00 mark per barrel.
The continuation of the firm note in the commodity was once again underpinned by prospects for a pickup in the demand for crude oil in line with further reopening in China.
Also collaborating with the improvement in prices appeared the increasing likelihood of a soft landing of the US economy at the time when market participants expect the Federal Reserve to slow the pace of future interest rate hikes, allowing a pause in the tightening cycle and thus alleviating recession fears.
In the calendar, driller Baker Hughes reported that the total US active oil rigs dropped to 613 in the week to January 20 (from 623).
WTI faces the next up barrier at the 2023 top at $82.35 (January 18) ahead of the December 2022 peak at $83.32 (December 1). The surpass of the latter could open the door to the $90.08 level (November 11 2022) prior to the 200-day SMA at $92.87 and the November 2022 high at $93.73. In the opposite direction, the 55-day SMA at $79.38 offers provisional support seconded by the January low at $72.50 (January 5) and the 2022 low at $70.10 (December 9). Immediately down from here turns up the key round level at $70.00 followed by the weekly low at $66.15 (December 20 2021) and the 200-week SMA at $65.62.
Resistance levels: $81.86 $82.35 $83.32 (4H chart)
Support levels: $79.88 $78.08 $76.90 (4H chart)
GER40
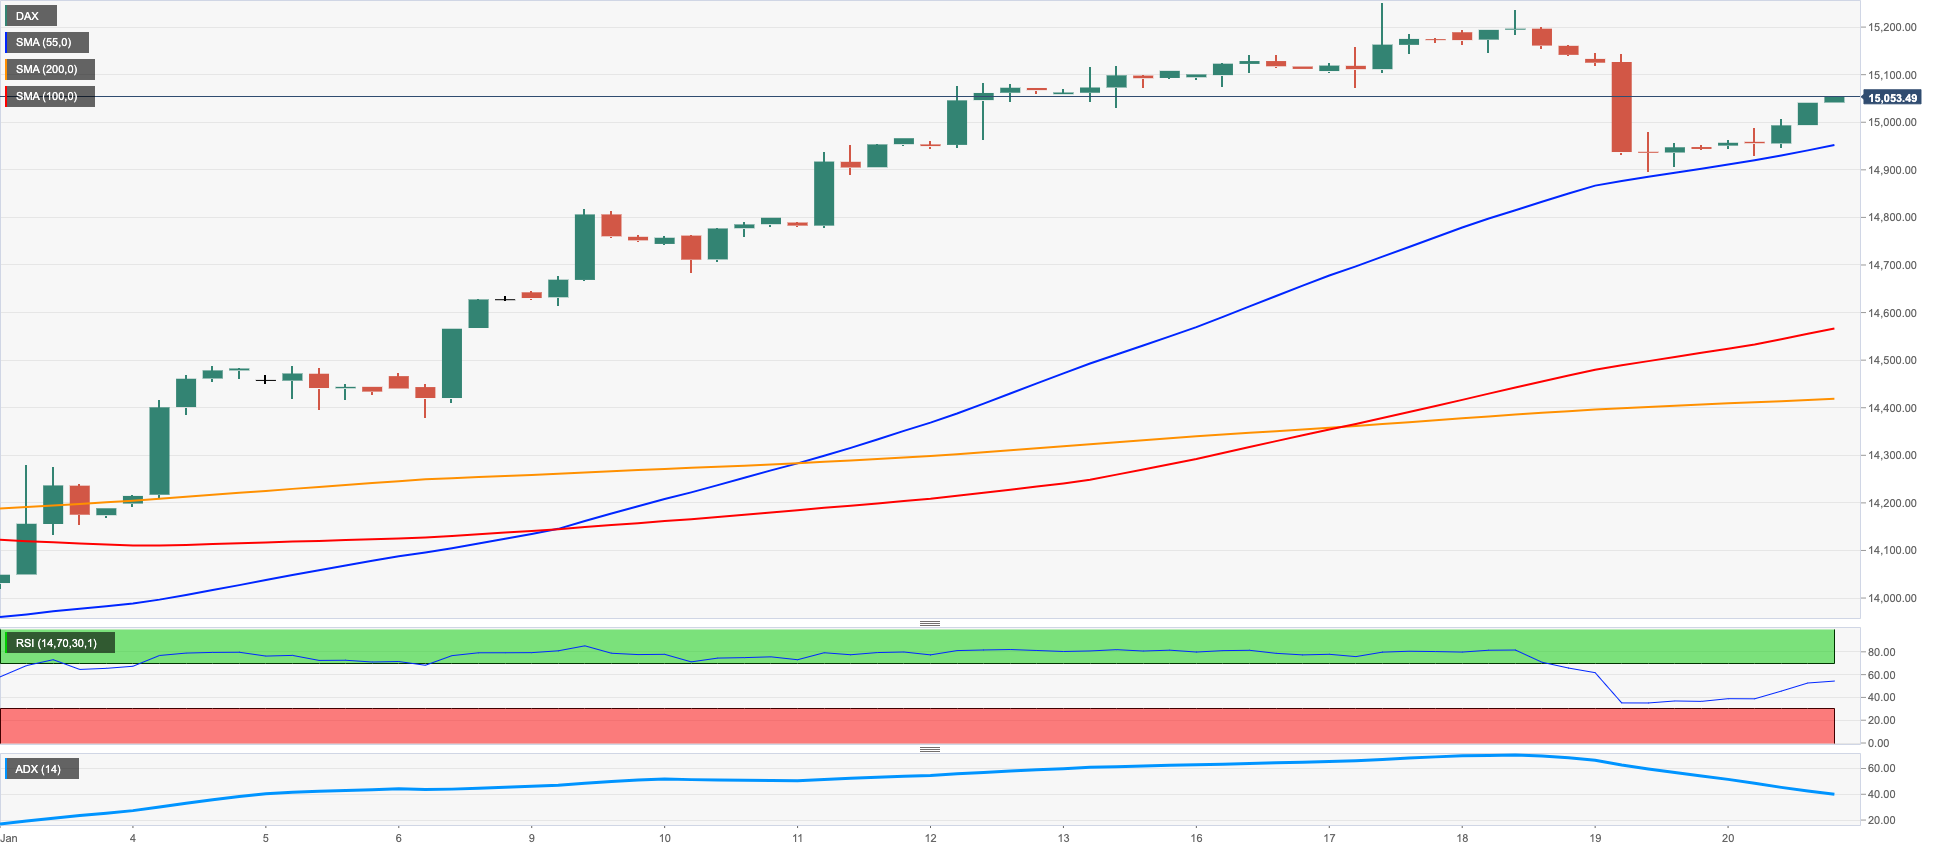
German equities regained the smile and the 15000 barrier as well at the end of the week. The daily advance, however, did not prevent the benchmark index to end the week with modest losses after two consecutive weekly gains.
Indeed, the broad-based optimism in the risk complex coupled with the persistent selling pressure around the greenback helped stocks reclaim some ground lost and reverse at the same time two daily pullbacks in a row.
So far, European stocks are expected to remain propped up by the Chinese reopening and speculation that the ECB could slow the pace of its rate path in the upcoming months.
In the money market, the 10-year Bund yields added to Thursday’s gains and approached the 2.20% level, or 3-day highs.
Data wise, Producer Prices in Germany contracted 0.4% MoM in December and rose 21.6% vs. the same month of 2021.
Initially, the DAX 40 kept targeting the 2023 peak at 15262 (January 17). If the index clears this level, it could then dispute the 2022 high at 16285 (January 5). Inversely, there is a temporary contention at the 55-day SMA at 14349 ahead of the December 2022 low at 13791 (December 20) and the key 200-day SMA at 13591. A deeper drop could motivate the November 2022 low at 13022 (November 3) to emerge on the horizon before the minor support at 12548 (October 21 2022). The daily RSI edged higher and flirted with 65.
Best Performers: Zalando SE, Covestro, Deutsche Bank AG
Worst Performers: Dr Ing hc F Porsche AG, Continental AG, Deutsche Boerse
Resistance levels: 15269 15542 15614 (4H chart)
Support levels: 14906 14637 14429 (4H chart)
NASDAQ
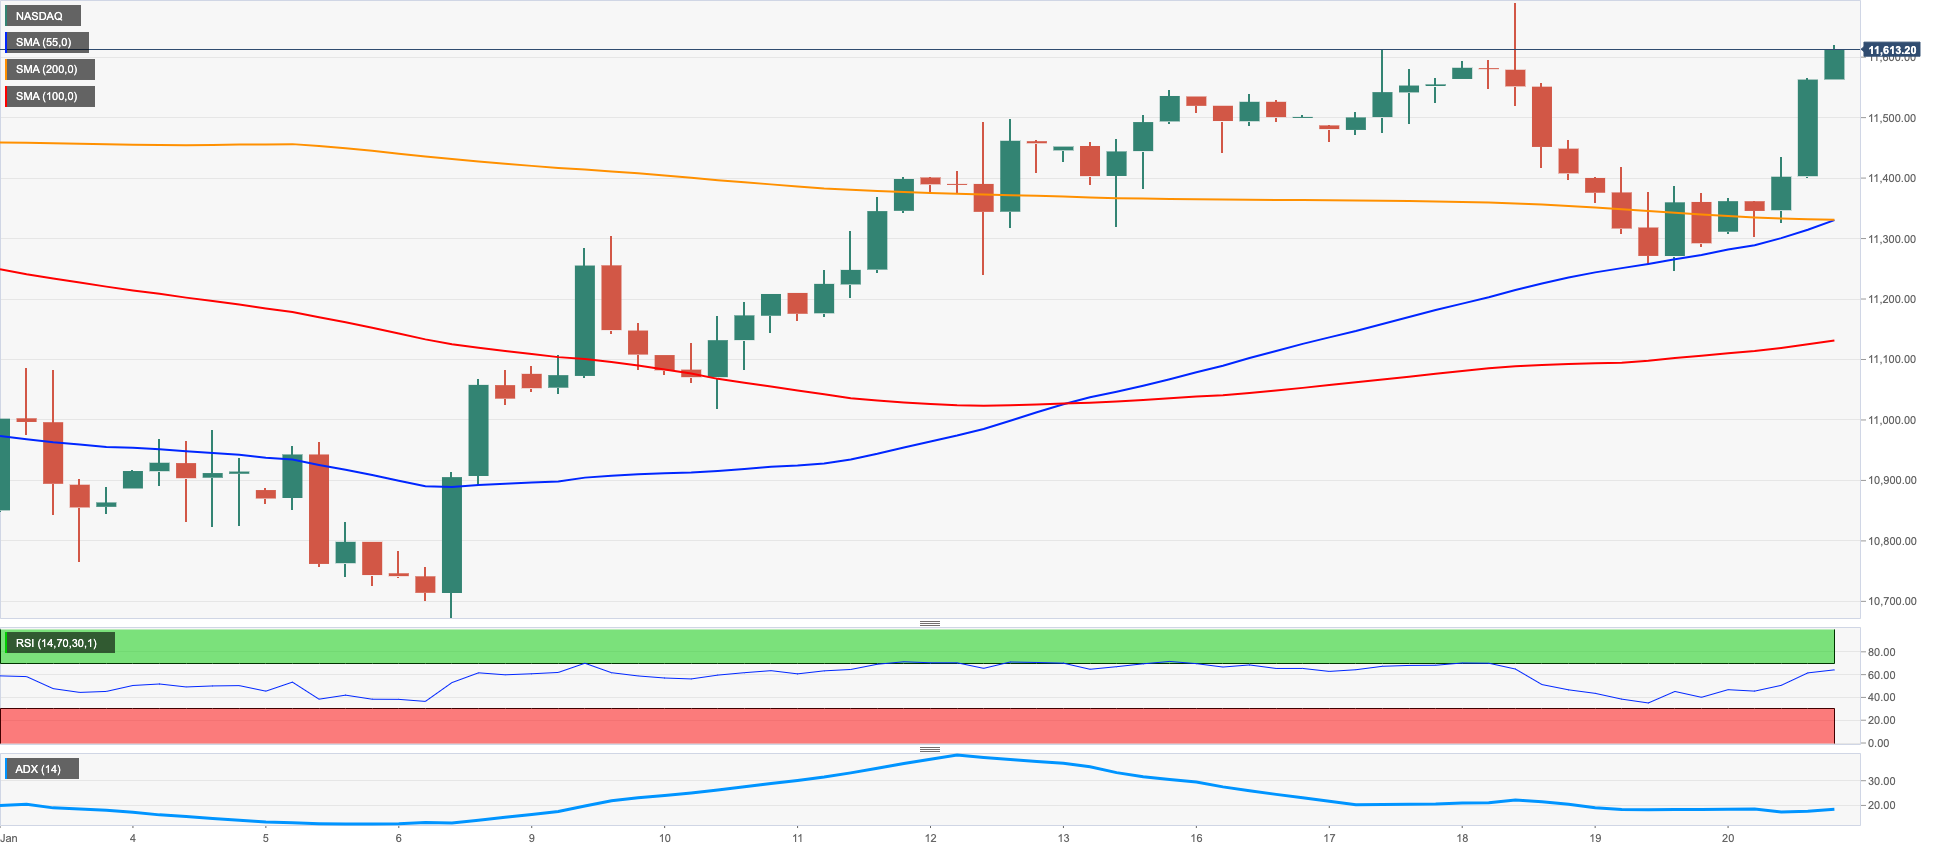
The benchmark index for the tech sector Nasdaq 100 advanced nearly 3% to the area above the 11600 mark on Friday, coming just short of the YTD peak near 11700 (January 18).
In fact, investors’ optimism gathered pace in response to better-than-expected results from streaming giant Netflix, while news of further job cuts by Alphabet was perceived as positive by market participants.
The soft note in the greenback also collaborated with the solid performance of the sector, which also managed to offset another uptick in US yields.
The upbeat sentiment among traders was also bolstered by rising hopes that the Fed may pause its hiking cycle in the not-so-distant future.
The Nasdaq 100 now trades at shouting distance from the 2023 peak at 11690 (January 18). The breakout of this level could motivate the index to challenge the key 200-day SMA at 12064 prior to the December 2022 high at 12166 (December 13). Further gains could see the September 2022 top at 12752 (September 12) revisited. Conversely, losses could accelerate on a breach of the weekly low at 11251 (January 19) and open the door to a decline to the January low at 10696 (January 6). Further south comes the December 2022 low at 10671 (December 22) before the November 2022 low at 10632 (November 4) and the 2022 low at 10440 (October 13). The daily RSI picked up extra pace and approached 59.
Top Gainers: Netflix, NVIDIA, Zscaler
Top Losers: AstraZeneca ADR, Gilead, Kraft Heinz
Resistance levels: 11623 11690 12166 (4H chart)
Support levels: 11251 11050 10696 (4H chart)
DOW JONES
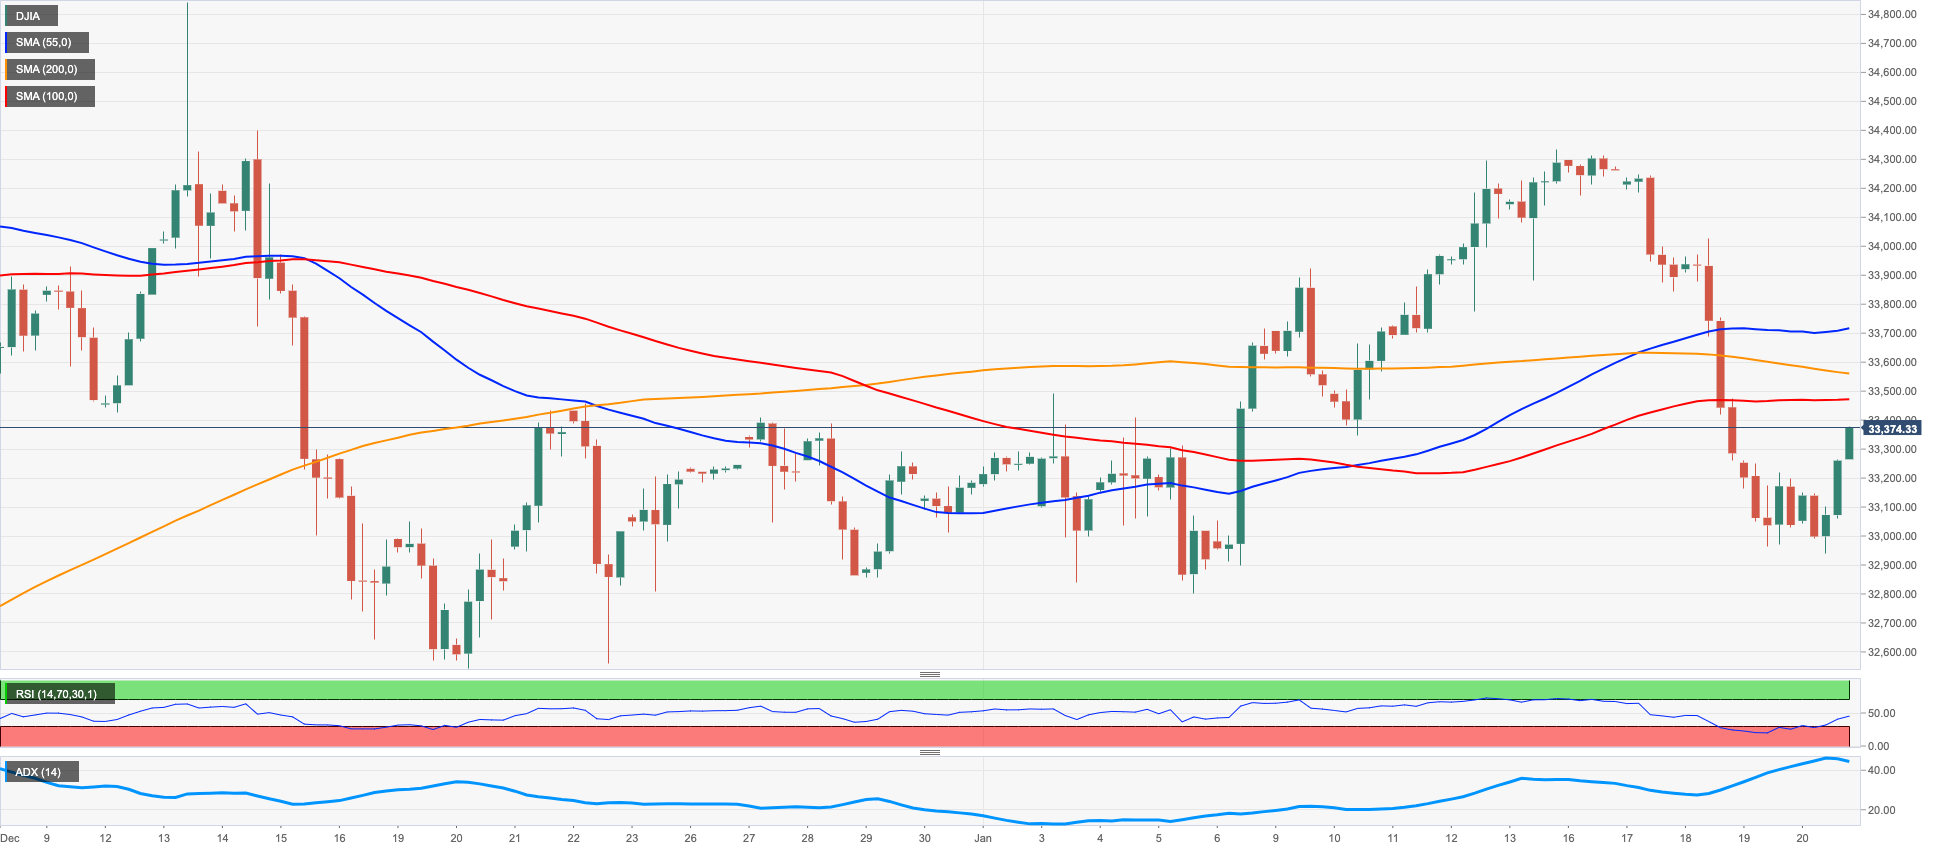
Finally, some respite for US equities, as the benchmark Dow Jones rose markedly to 2-day highs well past the 33000 yardstick at the end of the week. Despite Friday’s strong rebound, the index clinched the first week with losses after a promising start of the year.
Dip buyers in combination with the weak dollar and rising optimism around a soft landing in the US economy appear to have lifted spirits among investors and motivated US stocks to leave behind part of the recent leg lower.
Supporting the above turned up comments from FOMC’s C.Waller, who hinted at the idea that the current levels of the interest rate seem “sufficiently restrictive” to tame inflation. Waller, however, advocated for the continuation of the ongoing normalization process.
On the whole, the Dow Jones rose 1.00% to 33375, the S&P500 advanced 1.89% to 3972 and the tech-reference Nasdaq Composite gained 2.66% to 11140.
Further rebound in the Dow Jones now faces a provisional hurdle at the 55-day SMA at 33476. Beyond this level, there are no up barriers of note until the 2023 peak at 34342 (January 13), which precedes the December 2022 high at 34712 (December 13). The continuation of the march north could prompt the April 2022 top at 35492 to emerge on the horizon before the February 2022 high at 35824 (February 9). Contrarily, the weekly low at 32948 (January 20) turns up as the initial contention zone seconded by the December 2022 low at 32573 (December 22) and the key 200-day SMA at 32368. A deeper decline could put the November 2022 low at 31727 (November 3) to the test prior to the minor support at 30206 (October 21 2022) and the 2022 low at 28660 (October 13). The daily RSI bounced to the proximity of 49.
Top Performers: Walt Disney, Microsoft, Salesforce Inc.
Worst Performers: Goldman Sachs, J&J, Boeing
Resistance levels: 34342 34712 35492 (4H chart)
Support levels: 32948 32573 32205 (4H chart)
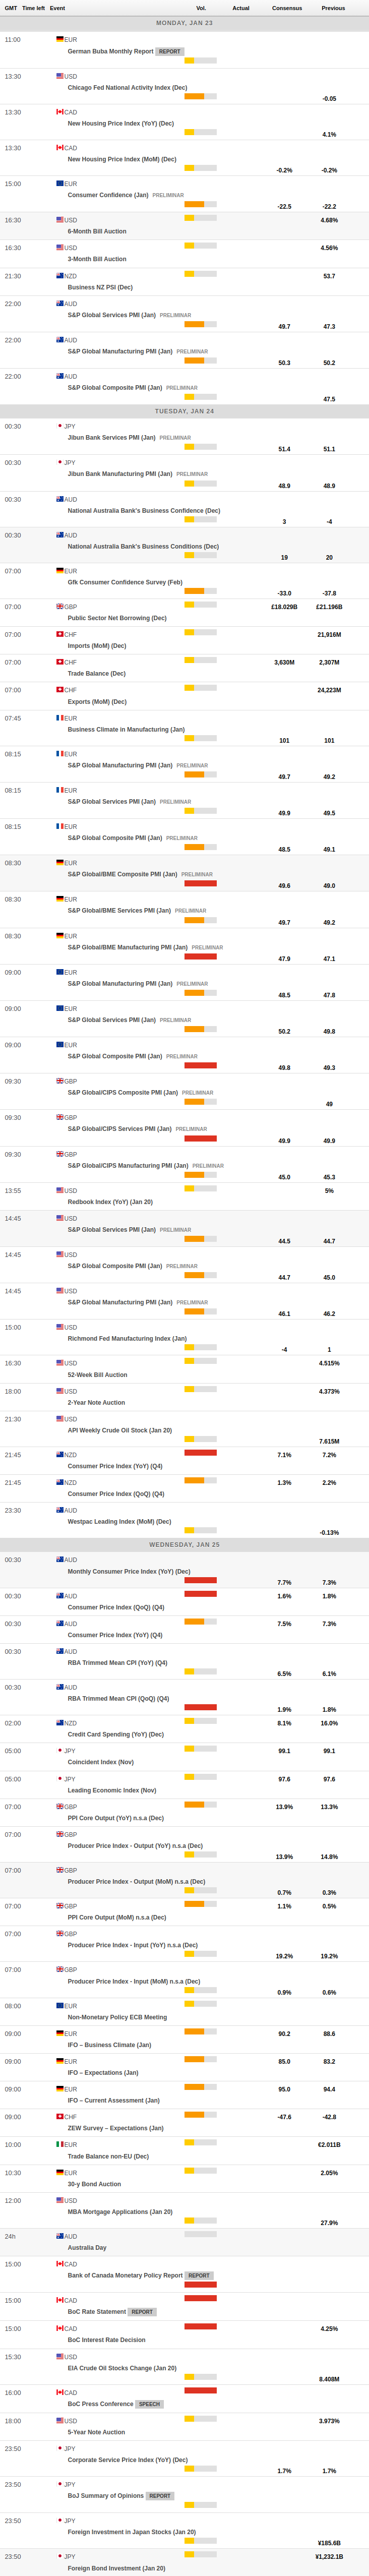
MACROECONOMIC EVENTS
All Information & Updates provided by:

All information relating to the financial markets available on this page has been prepared and issued by FXStreet (Forexstreet SL, Spain, Reg: B62498233) on the basis of publicly available information and all information believed to be reliable and does not conflict with Kuwaiti local laws, and all necessary care has been taken to before the company to ensure that the facts mentioned are correct from the source.
NCM Investment nor any of its directors or employees shall in any way be held responsible for the contents of this news, and the information contained on this page is intended only to provide clients with publicly available information and should not be construed as investment advice, report or analysis and/or constitute an offer or invitation to buy or sell financial instruments of any kind.
RISK WARNING: Forex and CFDs are highly risky leveraged products, as losses can exceed deposits. Please ensure you understand all the risks and take independent advice if necessary. NCM will segregate the clients based on the criteria of the regulator and its bylaws. NCM does not provide any advisory service; the material published does not constitute advice or a recommendation for a transaction in any financial instrument. NCM accepts no responsibility for any use of the content presented and any consequences of that use. Anyone acting on the information provided does so at their own risk.