
- Contact Us:
-

-

-

-


Daily Market Updates
24 Jan 2023
USDJPY
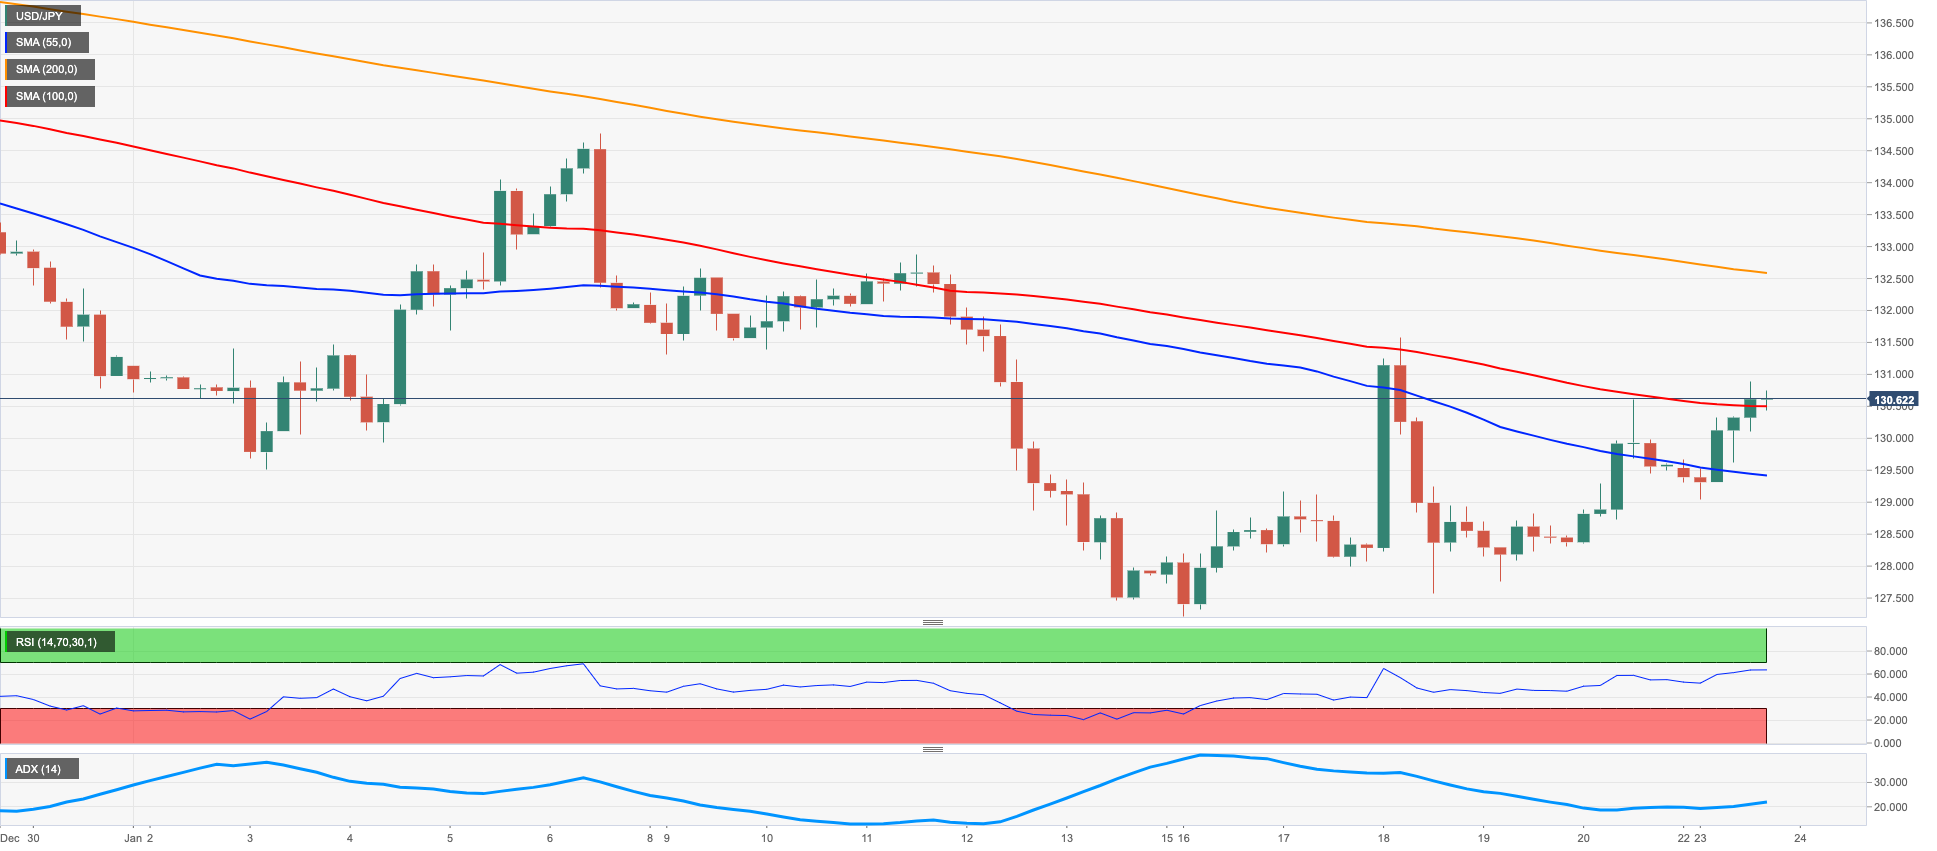
USD/JPY added to Friday’s gains and started the week on a positive foot, climbing to the proximity of the key 131.00 mark on Monday.
The second straight session with gains in the pair came amidst further improvement in US yields across the curve, while the JGB 10-year yields remained on the defensive near the 0.40% area.
The Japanese safe haven depreciated further amidst alternating risk appetite trends and after the release of the BoJ Minutes of the January event, where members agreed to communicate that the recent widening of the YCC band did not mean any attempt of normalization of the current monetary stance.
USD/JPY surpassed the 130.00 hurdle in a convincing fashion on Monday. That said, spot could now target the weekly high at 131.57 (January 20) prior to the 2023 top at 134.77 (January 6). North from here turns up the temporary 55-day SMA at 135.30 followed by the key 200-day SMA at 136.71 and weekly peaks at 138.17 (December 15 2022) and 139.89 (November 30 2022), all before the round level at 140.00. Just the opposite, the breach of the January low at 127.21 (January 16) exposes the May 2022 low at 126.36 (May 24) prior to the weekly low at 121.27 (March 31 2022). The daily RSI bounced to the area past the 45 .
Resistance levels: 130.88 131.57 132.87 (4H chart)
Support levels: 129.04 127.56 127.21 (4H chart)
GBPUSD
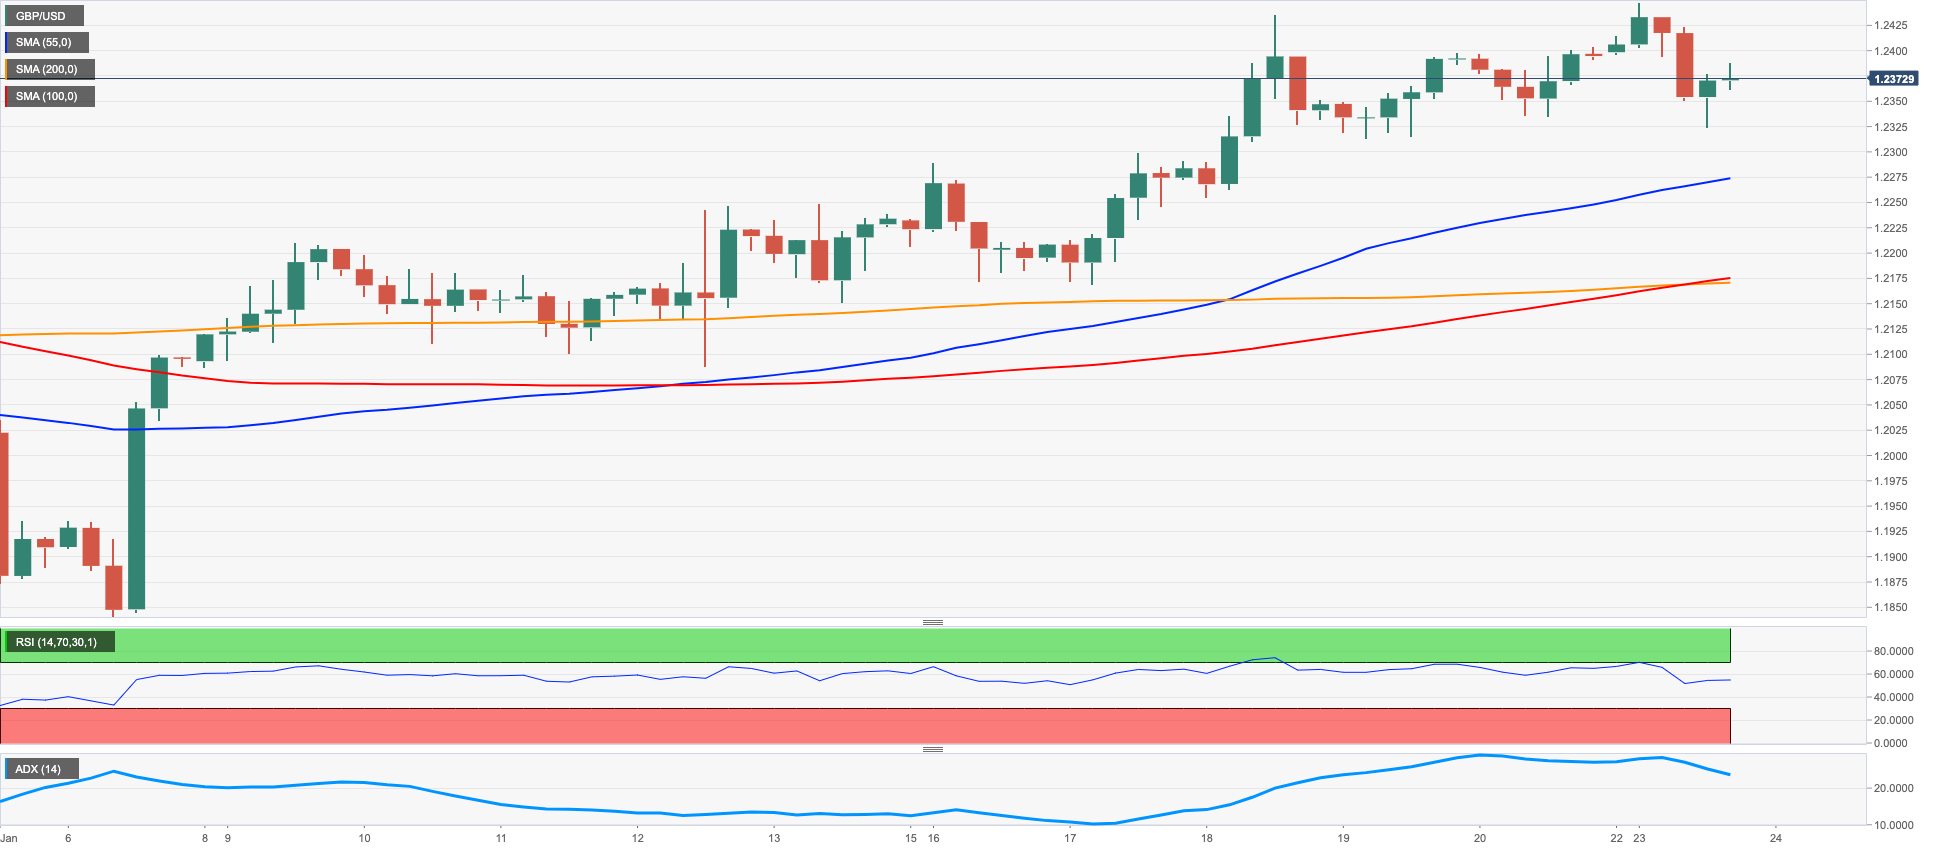
After four consecutive daily advances, GBP/USD met some selling pressure and receded to the 1.2320 region not before printing new 7-month highs near 1.2450 at the beginning of the week.
The corrective decline in Cable came despite the vacillating price action around the greenback, the absence of data releases in the UK calendar and unclear direction in the risk appetite trends on Monday.
In the UK debt market, the 10-year Gilt yields added to the ongoing recovery and poked once again with the 3.40% region.
The next data releases in the UK docket will be Tuesday’s Public Sector finances as well as preliminary Manufacturing and Services PMIs for the month of January.
Immediately to the upside for GBP/USD now emerges the 2023 top at 1.2447 (January 23). The breakout of this level could put the May 2022 peak at 1.2666 (May 27) back on the investors’ radar ahead of the key 200-week SMA at 1.2906 and the psychological 1.3000 yardstick. On the opposite side, the 55-day SMA at 1.2076 comes first ahead of the round level at 1.2000 and the key 200-day SMA, today at 1.1972. The loss of this region could prompt the January low at 1.1841 (January 6) to emerge on the horizon before the provisional 100-day SMA at 1.1729. The daily RSI came under pressure and deflated to the sub-65 zone.
Resistance levels: 1.2447 1.2558 1.2599 (4H chart)
Support levels: 1.2323 1.2312 1.2268 (4H chart)
AUDUSD
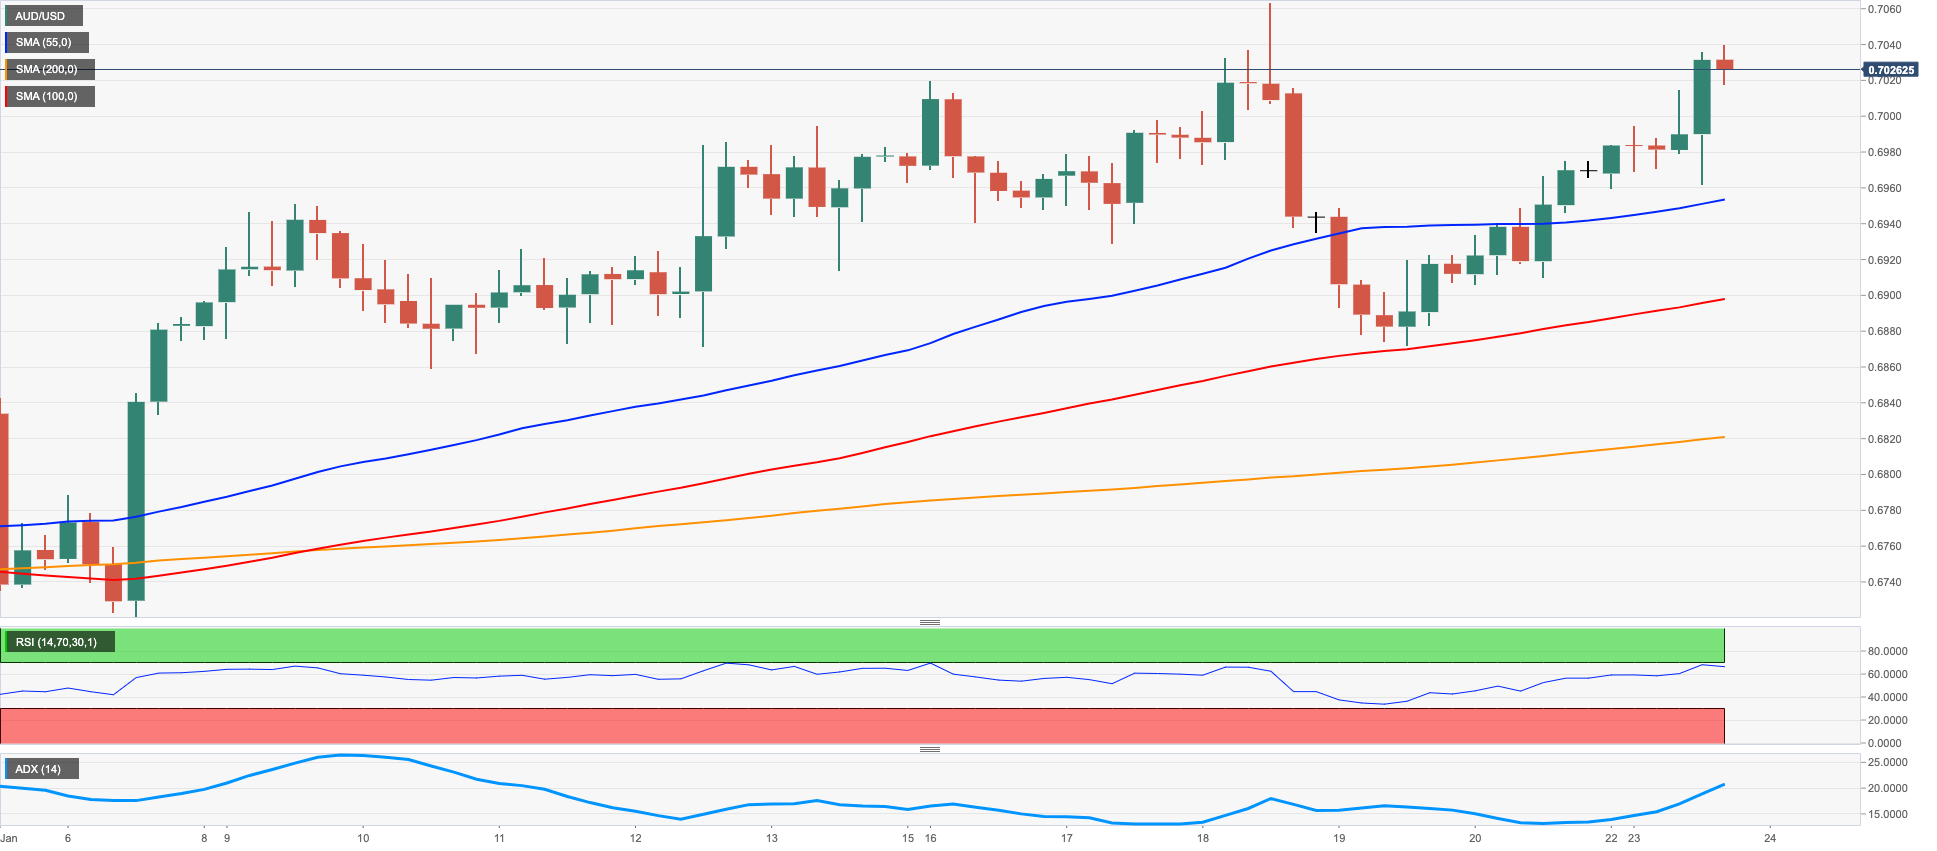
AUD/USD added to Friday’s strong advance and surpassed once again the key 0.7000 mark at the beginning of the week.
Indeed, the Aussie dollar managed to remain bid despite the corrective bounce in the greenback, while the generalized upbeat tone in the commodity universe appears to have supported the continuation of the upside momentum in spot.
Further legs to the pair’s upside also came after Australia’s Treasurer J.Chalmers stressed that the country seems to have left behind the inflation crisis. Chalmers’ comments came ahead of the release of inflation figures (Wednesday), where the Monthly CPI Indicator is expected to have risen 7.6% in December.
Immediately to the upside for AUD/USD emerges the 2023 peak at 0.7063 (January 16) ahead of the August 2022 high at 0.7136 (August 11) and the June 2022 top at 0.7282 (June 3). North from here comes the round level at 0.7300. On the other hand, the weekly low at 0.6871 (January 19) is seen offering initial contention prior to the key 200-day SMA at 0.6815 and the provisional 55-day SMA at 0.6767. The breakdown of this region could put the January low at 0.6688 (January 3) to the test ahead of the December low at 0.6629 (December 20) and weekly lows at 0.6584 (November 21) and 0.6386 (November 10). The daily RSI picked up further traction and trespassed 64.
Resistance levels: 0.7039 0.7063 0.7136 (4H chart)
Support levels: 0.6962 0.6871 0.6816 (4H chart)
GOLD
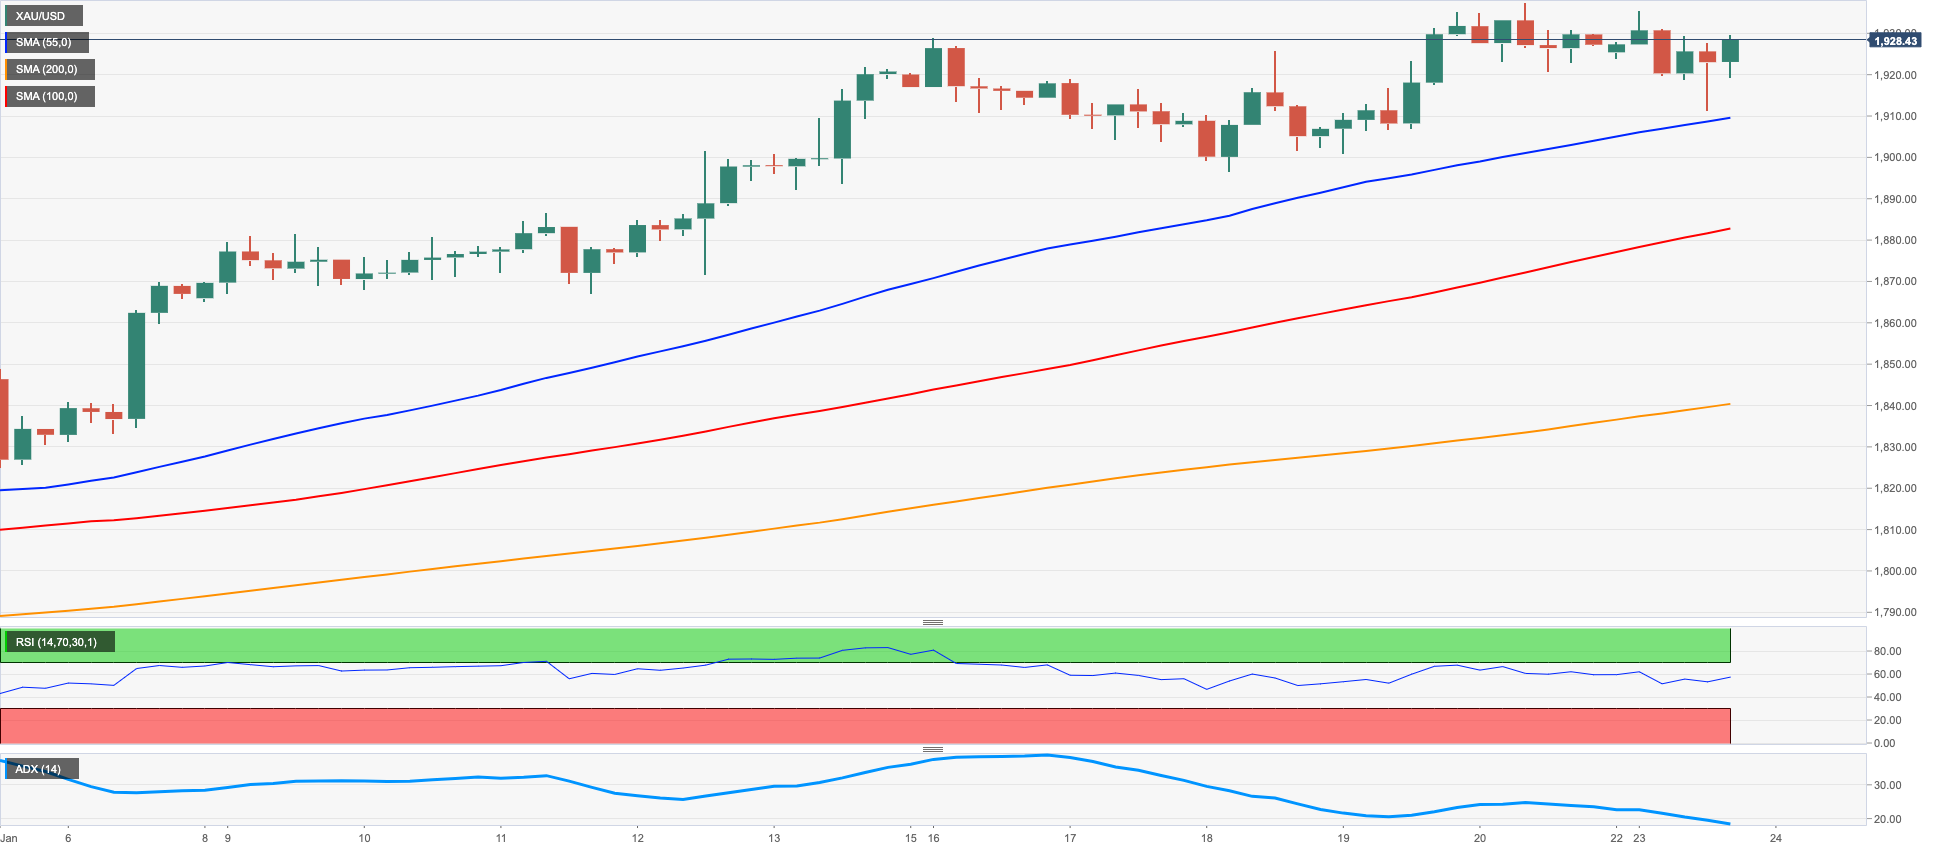
The yellow metal started the week in a volatile fashion pari passu with the alternating risk appetite trends and the dollar’s price action.
So far, gold prices seem to have met quite a firm barrier in the proximity of $1940 (January 20) following a 5-week positive streak.
In fact, bullion charted an inconclusive session on Monday, although it managed well to keep business above the key $1900 mark per ounce troy against the backdrop of a decent recovery in the greenback and further gains in US yields across the curve.
Extra gains in gold continue to target the 2023 high at $1937 (January 20). Once this area is cleared, the metal could dispute the April 2022 top at $1998 (April 18) closely followed by the psychological $2000 mark and the 2022 peak at $2070 (March 8). On the contrary, there are initial contention at weekly lows at $1896 (January 18) and $1867 (January 11) ahead of the interim 55-day SMA at $1804. Further south emerges the 200-day SMA at $1777 seconded by the 100-day SMA at $1744 and the weekly low at $1727 (November 23).
Resistance levels: $1937 $1955 $1982 (4H chart)
Support levels: $1911 $1896 $1880 (4H chart)
CRUDE WTI
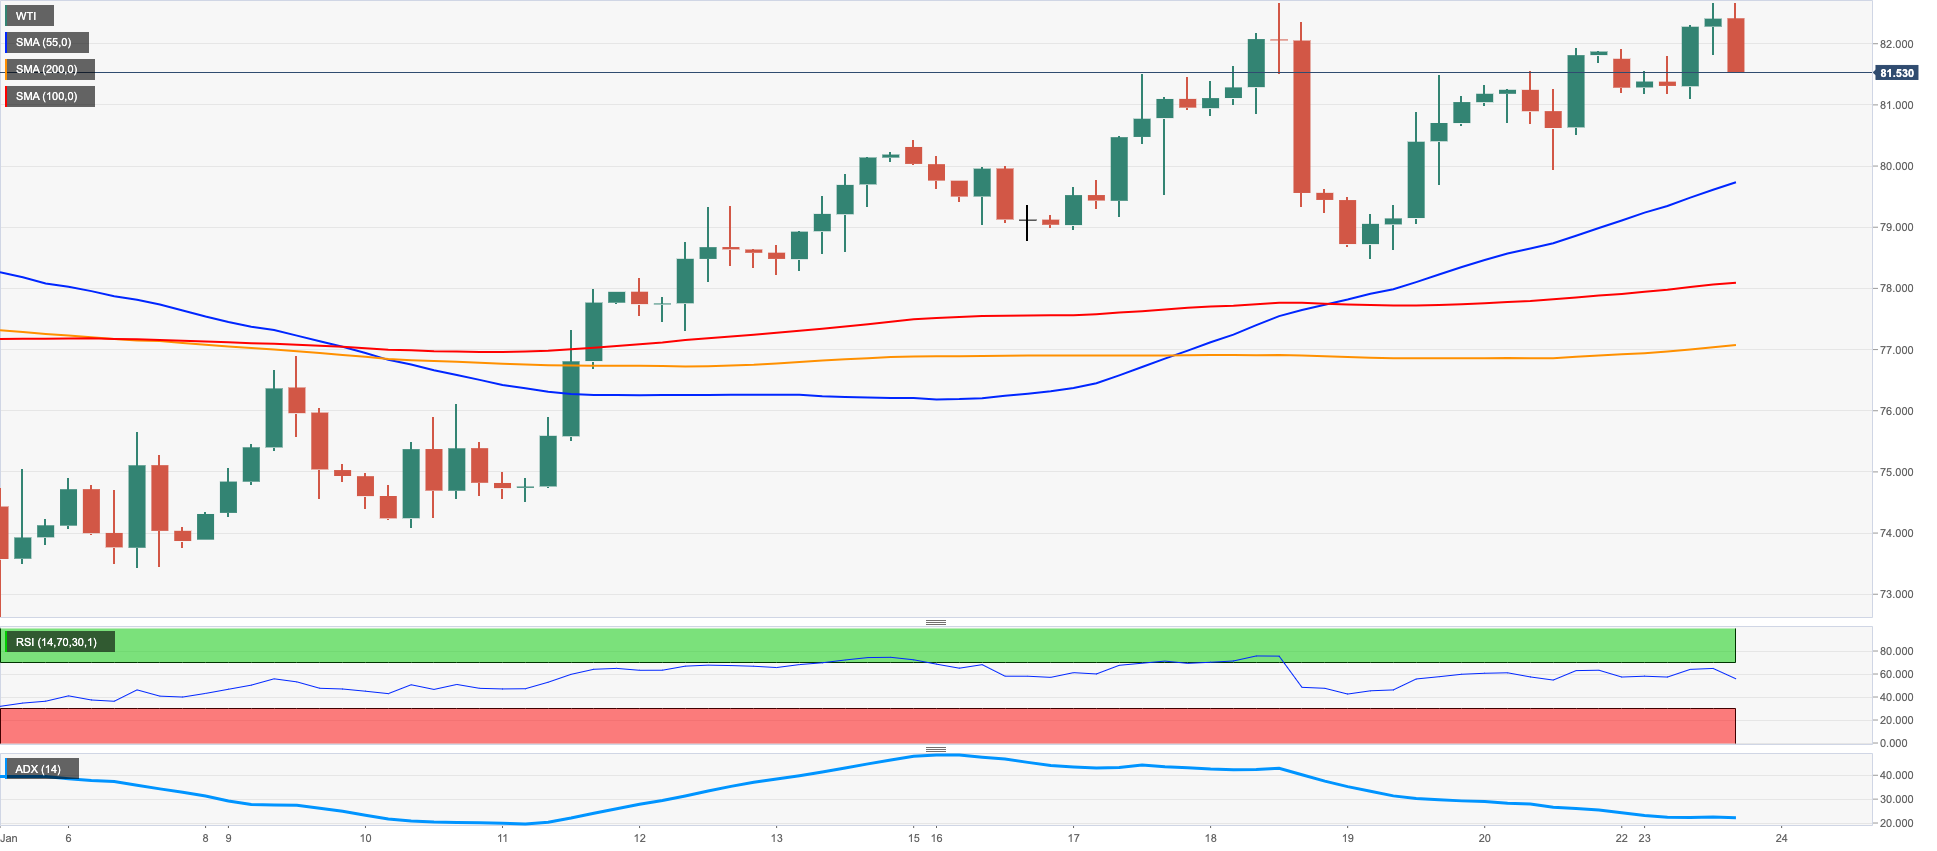
Prices of the WTI navigated a narrow trading range but that appears to have been enough to extend the uptrend to the area beyond the $82.00 mark per barrel on Monday.
In fact, traders continued to gauge the ongoing reopening in China and the direct impact on the demand for crude oil, while speculation of a potential US slowdown kept gains somewhat limited at the beginning of the new week.
The bounce in the greenback also weighed on the commodity’s upside potential as well as the marginal trading conditions due to the inactivity in the Chinese markets following the New Year holiday.
Later in the week, the API and the EIA are expected to report on US crude oil inventories in the week to January 20.
WTI recorded a new YTD peak at $82.60 (January 23). If the commodity breaks above this level, it could then challenge the December 2022 high at $83.32 (December 1) followed by the $90.08 level (November 11 2022) and the 200-day SMA at $92.76. Up from here comes the November 2022 high at $93.73 ahead of the weekly top at $97.65 (August 30 2022). On the flip side, initial support aligns at the 55-day SMA at $79.28 ahead of the January low at $72.50 (January 5) and the 2022 low at $70.10 (December 9). Further losses could revisit the key round level at $70.00 prior to the weekly low at $66.15 (December 20 2021) and the 200-week SMA at $65.73.
Resistance levels: $82.60 $83.32 $88.65 (4H chart)
Support levels: $79.88 $78.08 $76.93 (4H chart)
GER40
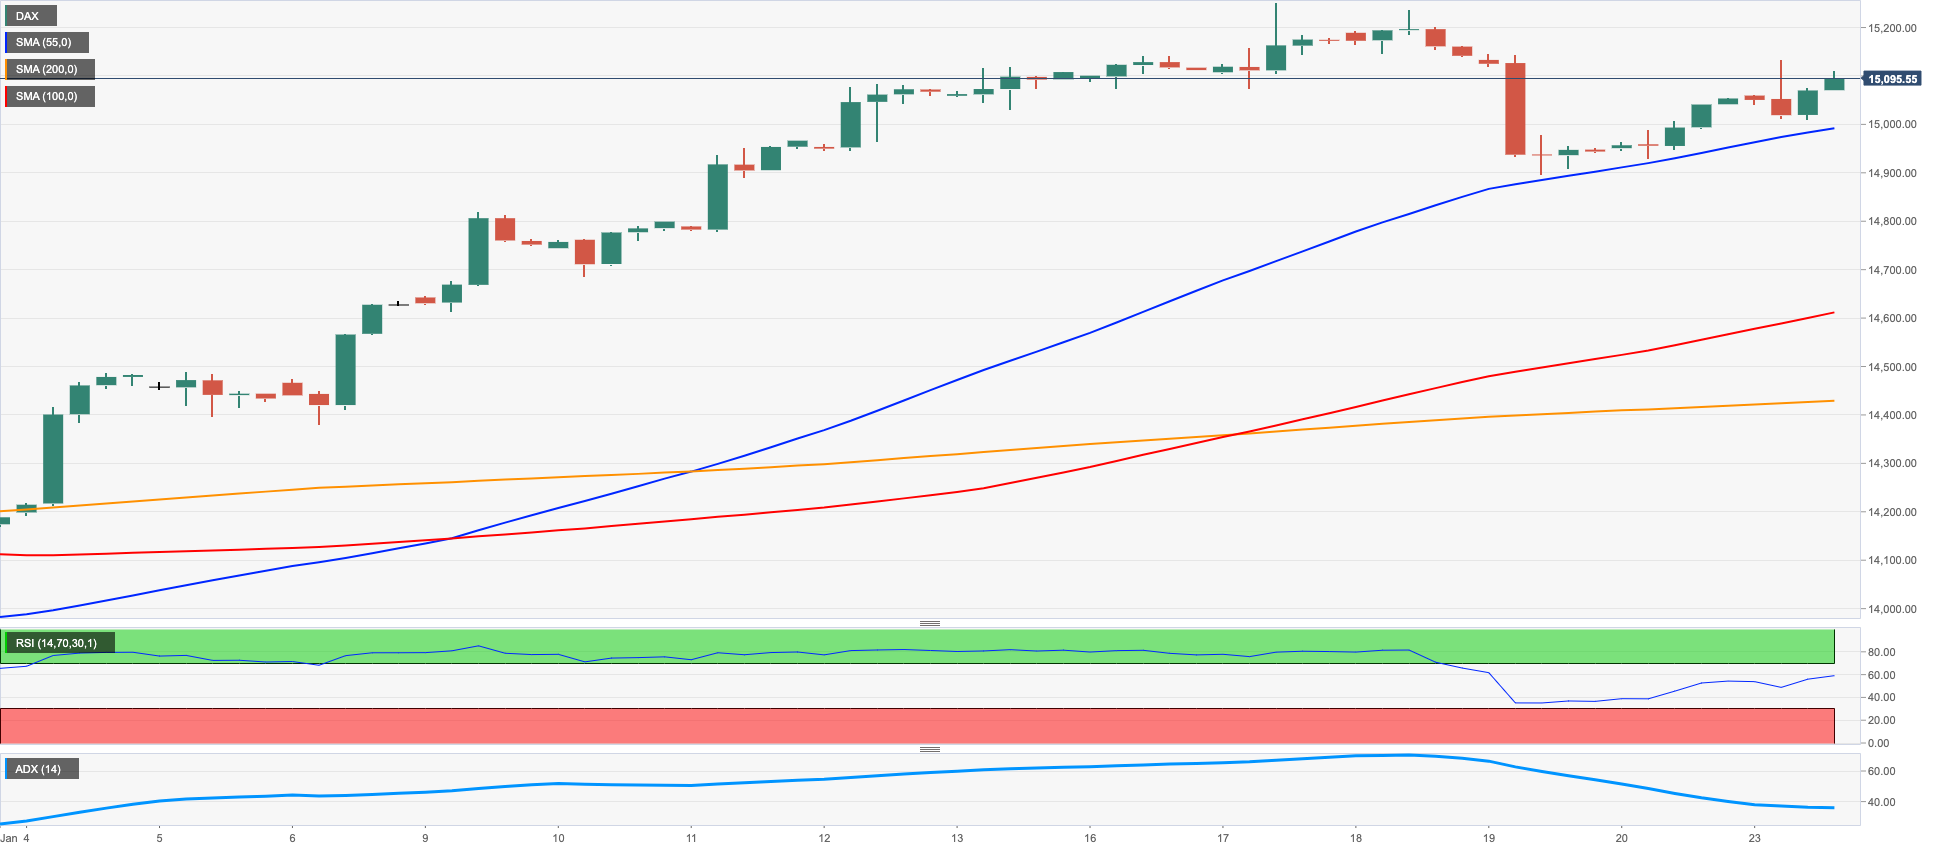
The German stock benchmark DAX 40 resumed the uptrend and added to Friday’s advance beyond the 15000 barrier on Monday.
The positive start of the week in the German stock market fell in line with the rest of its European peers on the back of dwindling bets of a recession in Germany and the broader Euroland.
The above remained propped up by hopes of a strong recovery in the global activity in response to the Chinese reopening, while it managed to eclipse concerns stemming from the hawkish narrative from ECB speakers, which in general continued to favour extra tightening by the central bank.
In the German money market, the 10-year Bund yields rose for the third session in a row and revisited the area beyond the 2.20% level on Monday.
Next on the upside for the DAX 40 comes the so far 2023 high at 15262 (January 17) ahead of the 2022 top at 16285 (January 5), an area coincident with the November 2021 peak (November 18). Contrarily, the weekly low at 14906 (January 19) emerges as the immediate contention region prior to the temporary 55-day SMA at 14379 and the December 2022 low at 13791 (December 20). The loss of this level could pave the way for a visit to the key 200-day SMA at 13596 ahead of the November 2022 low at 13022 (November 3) and the minor support at 12548 (October 21 2022). The daily RSI rebounded to the 66 area.
Best Performers: Sartorius AG VZO, Vonovia, Merck
Worst Performers: Symrise AG, Hannover Rueck SE, Munich Re Group
Resistance levels: 15145 15269 15542 (4H chart)
Support levels: 14906 14696 14448 (4H chart)
NASDAQ
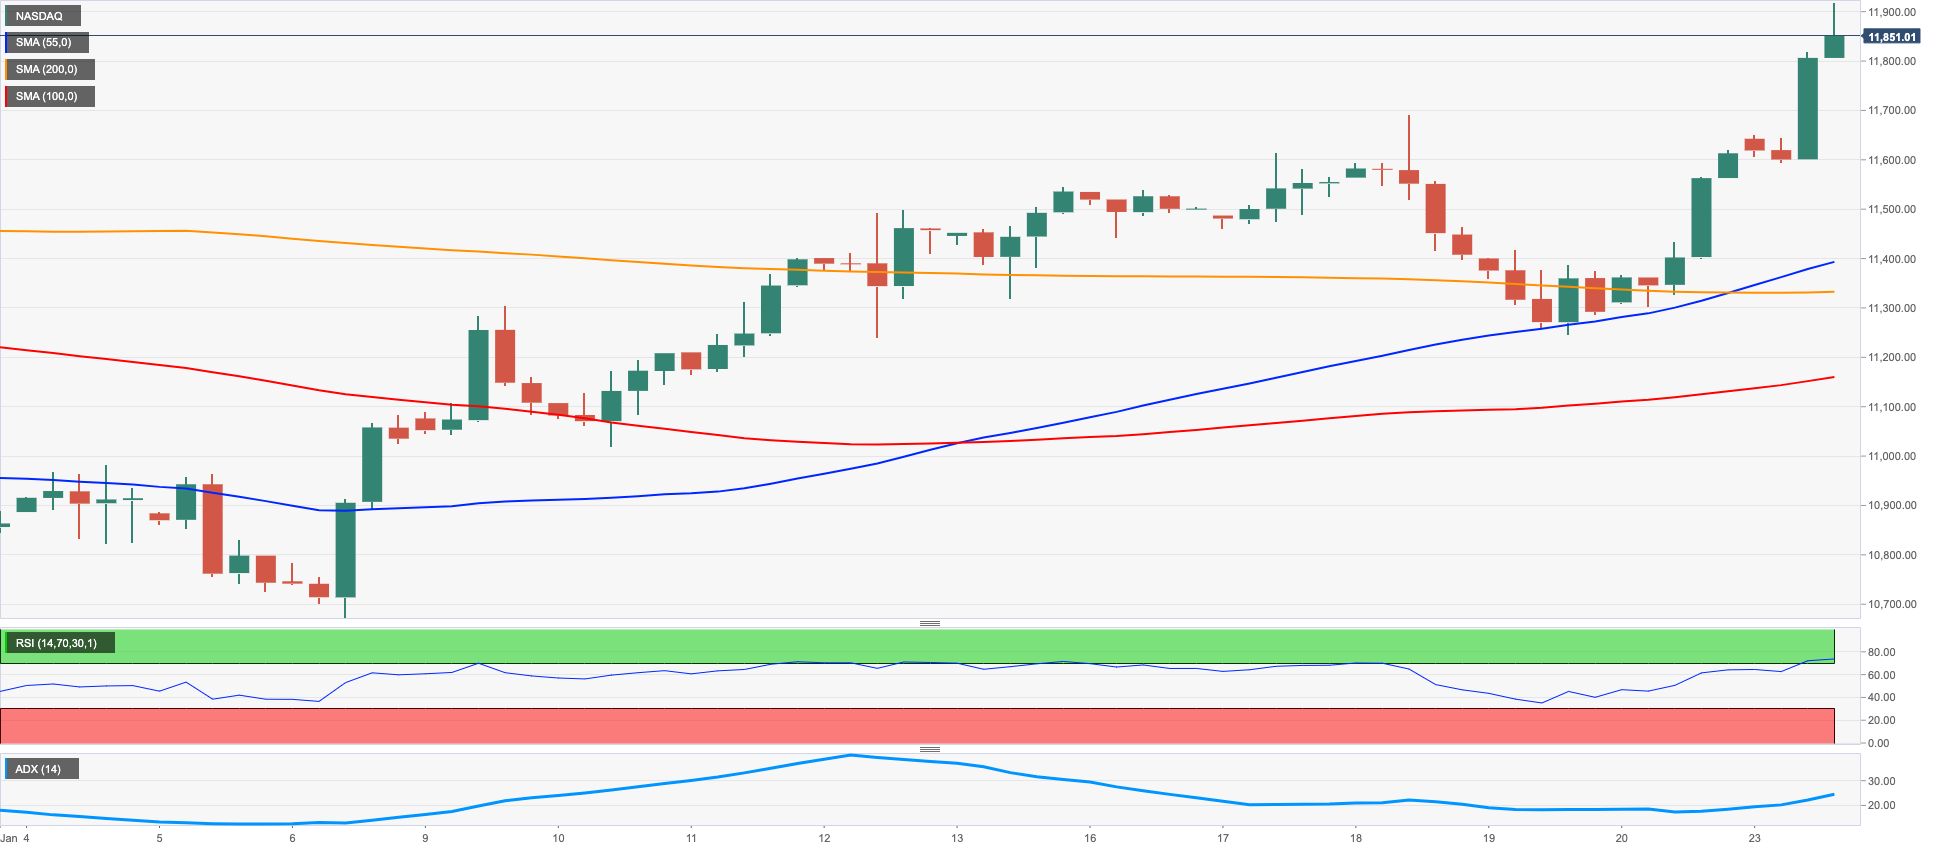
The tech reference Nasdaq 100 rose to new 6-week highs just below the 12000 mark at the beginning of a new trading week.
Indeed, shares of chipmakers outperformed and led the way up for the rest of the US markets on Monday, as bargain-hunting mood seems to have dominated the session ahead of corporate results from key players like Microsoft, Tesla and Intel among others due later in the week.
However, the bounce in the dollar coupled with the extra gains in US yields somewhat limited the upside bias in the index.
If the buying interest in the Nasdaq 100 gathers steam, then the index could confront the key 200-day SMA at 12049 ahead of the December 2022 top at 12166 (December 13) and the September 2022 peak at 12752 (September 12). Inversely, a drop below the weekly low at 11251 (January 19) could trigger further weakness to the January low at 10696 (January 6) before the December 2022 low at 10671 (December 22) and the November 2022 low at 10632 (November 4). Down from here comes the 2022 low at 10440 (October 13). The daily RSI ticked higher and poked with the 64 region.
Top Gainers: Rivian Automotive, Lucid Group, AMD
Top Losers: Atlassian Corp Plc, AstraZeneca ADR, Baker Hughes
Resistance levels: 11912 12166 12752 (4H chart)
Support levels: 11460 11251 10696 (4H chart)
DOW JONES
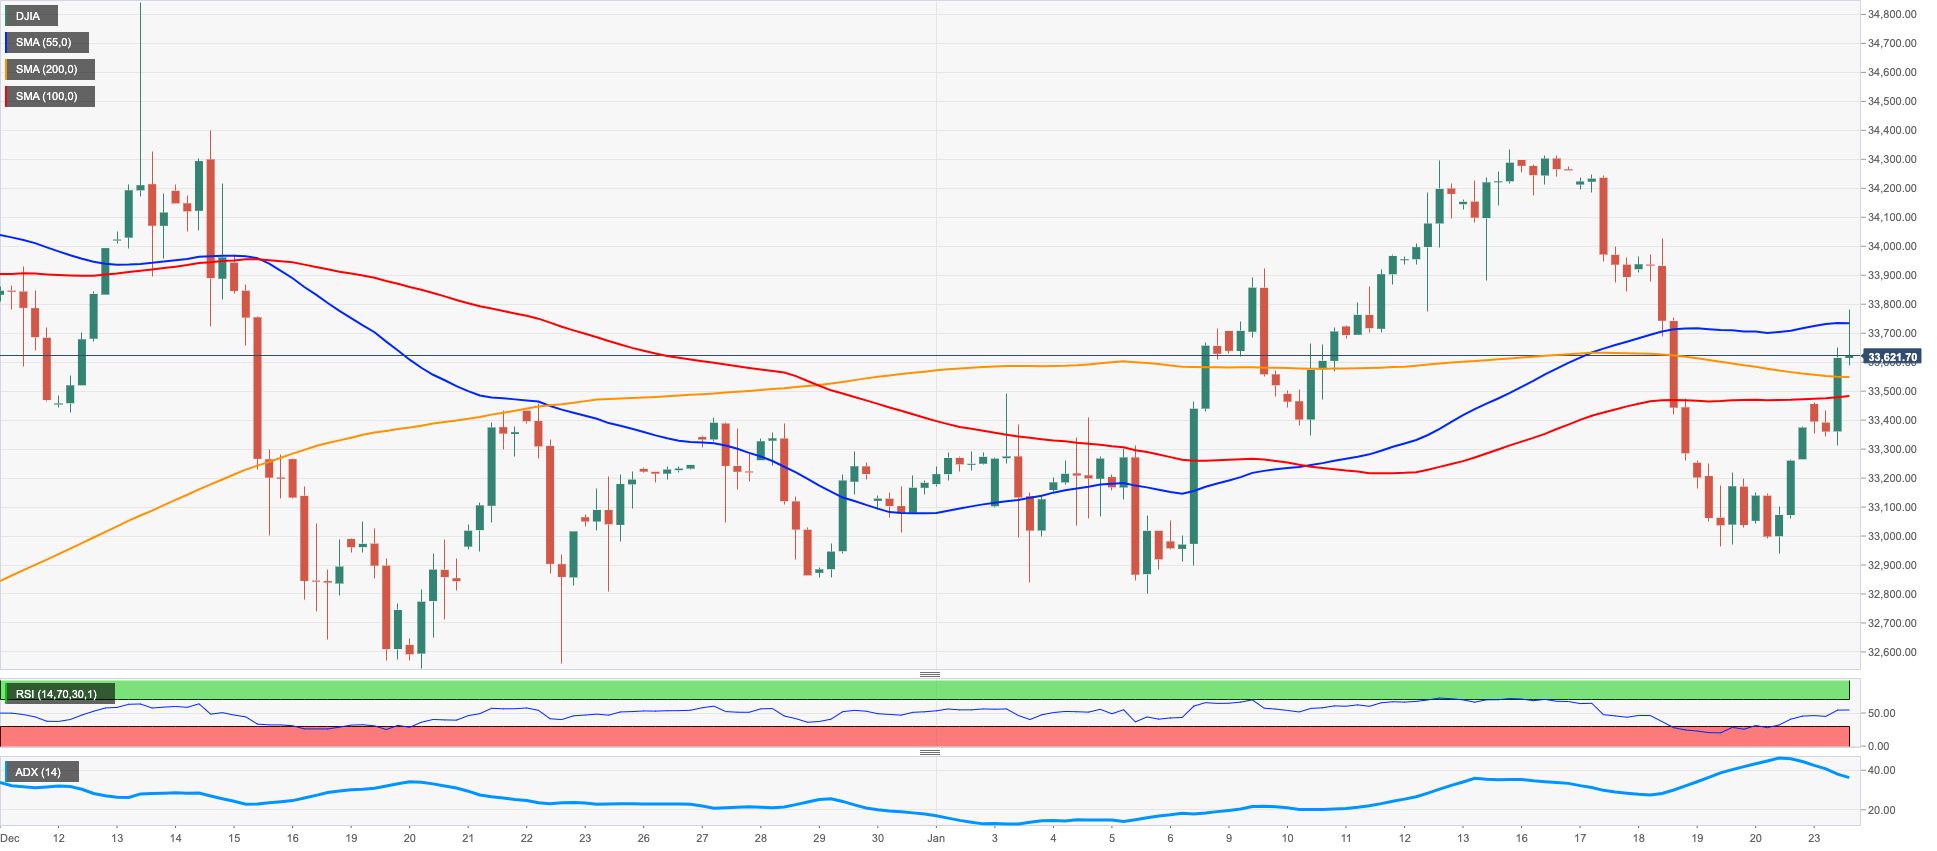
Equities measured by the Dow Jones extended Friday’s optimism and rose to the boundaries of the 33800 region at the beginning of the week.
The upbeat tone among investors came in response to a broad-based advance in the tech sector, hopes of a soft landing of the US economy and persistent speculation of a Fed’s pivot in its current normalization process.
Later in the week, market participants are expected to closely follow the release of flash Q4 GDP figures, inflation tracked by the PCE as well as the usual weekly report on the labour market.
All in all, the Dow Jones gained 1.01% to 33710, the S&P500 rose 1.42% to 4029 and the tech-heavy Nasdaq Composite advanced 2.35% to 11402.
If the recovery in the Dow Jones gathers fresh impulse, then the next hurdle of note should appear at the 2023 high at 34342 (January 13) followed by the December 2022 top at 34712 (December 13). The breakout of the latter could put the April 2022 peak at 35492 back on the investors’ radar ahead of the February 2022 top at 35824 (February 9). In the opposite direction, there is initial support at the weekly low at 32948 (January 20) prior to the December 2022 low at 32573 (December 22) and before the key 200-day SMA at 32363. The breach of this region could open the door to another test of the November 2022 low at 31727 (November 3) ahead of the minor support at 30206 (October 21 2022) and the 2022 low at 28660 (October 13). The daily RSI regained composure and flirted with the 53 level.
Top Performers: Intel, Salesforce Inc, Apple
Worst Performers: Procter&Gamble, Amgen, Verizon
Resistance levels: 33782 34342 34712 (4H chart)
Support levels: 32948 32573 32222 (4H chart)
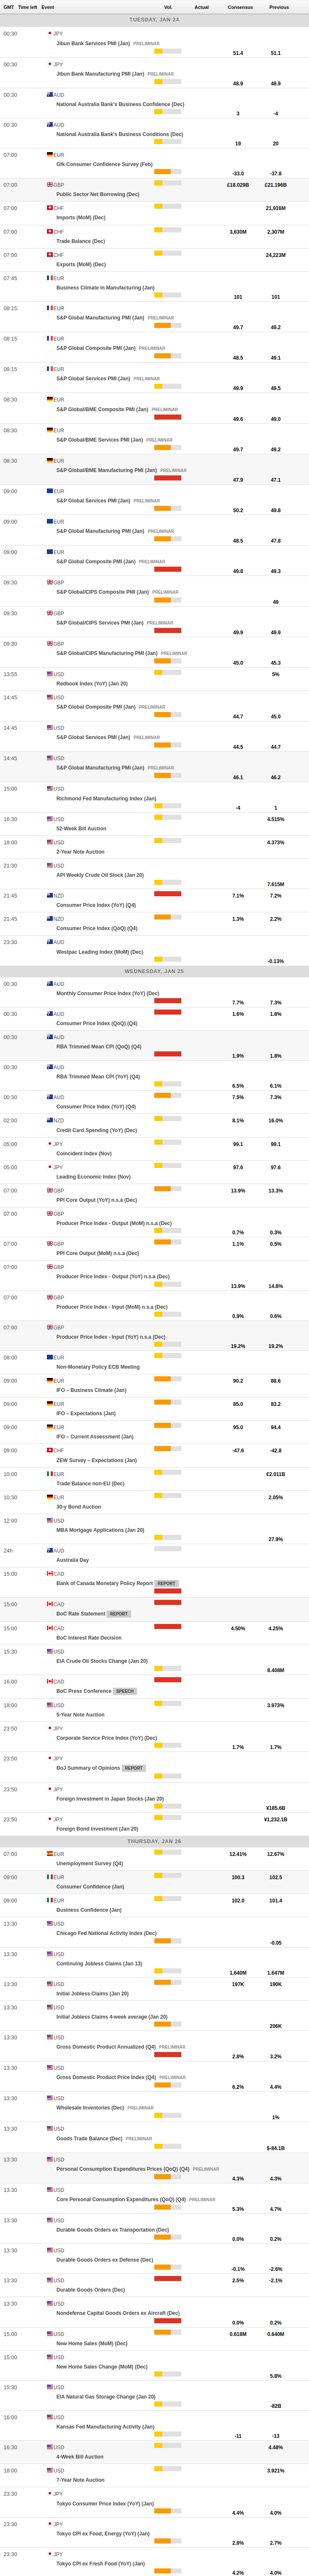
MACROECONOMIC EVENTS
All Information & Updates provided by:

All information relating to the financial markets available on this page has been prepared and issued by FXStreet (Forexstreet SL, Spain, Reg: B62498233) on the basis of publicly available information and all information believed to be reliable and does not conflict with Kuwaiti local laws, and all necessary care has been taken to before the company to ensure that the facts mentioned are correct from the source.
NCM Investment nor any of its directors or employees shall in any way be held responsible for the contents of this news, and the information contained on this page is intended only to provide clients with publicly available information and should not be construed as investment advice, report or analysis and/or constitute an offer or invitation to buy or sell financial instruments of any kind.
RISK WARNING: Forex and CFDs are highly risky leveraged products, as losses can exceed deposits. Please ensure you understand all the risks and take independent advice if necessary. NCM will segregate the clients based on the criteria of the regulator and its bylaws. NCM does not provide any advisory service; the material published does not constitute advice or a recommendation for a transaction in any financial instrument. NCM accepts no responsibility for any use of the content presented and any consequences of that use. Anyone acting on the information provided does so at their own risk.