
- Contact Us:
-

-

-

-


Daily Market Updates
25 Jan 2023
USDJPY
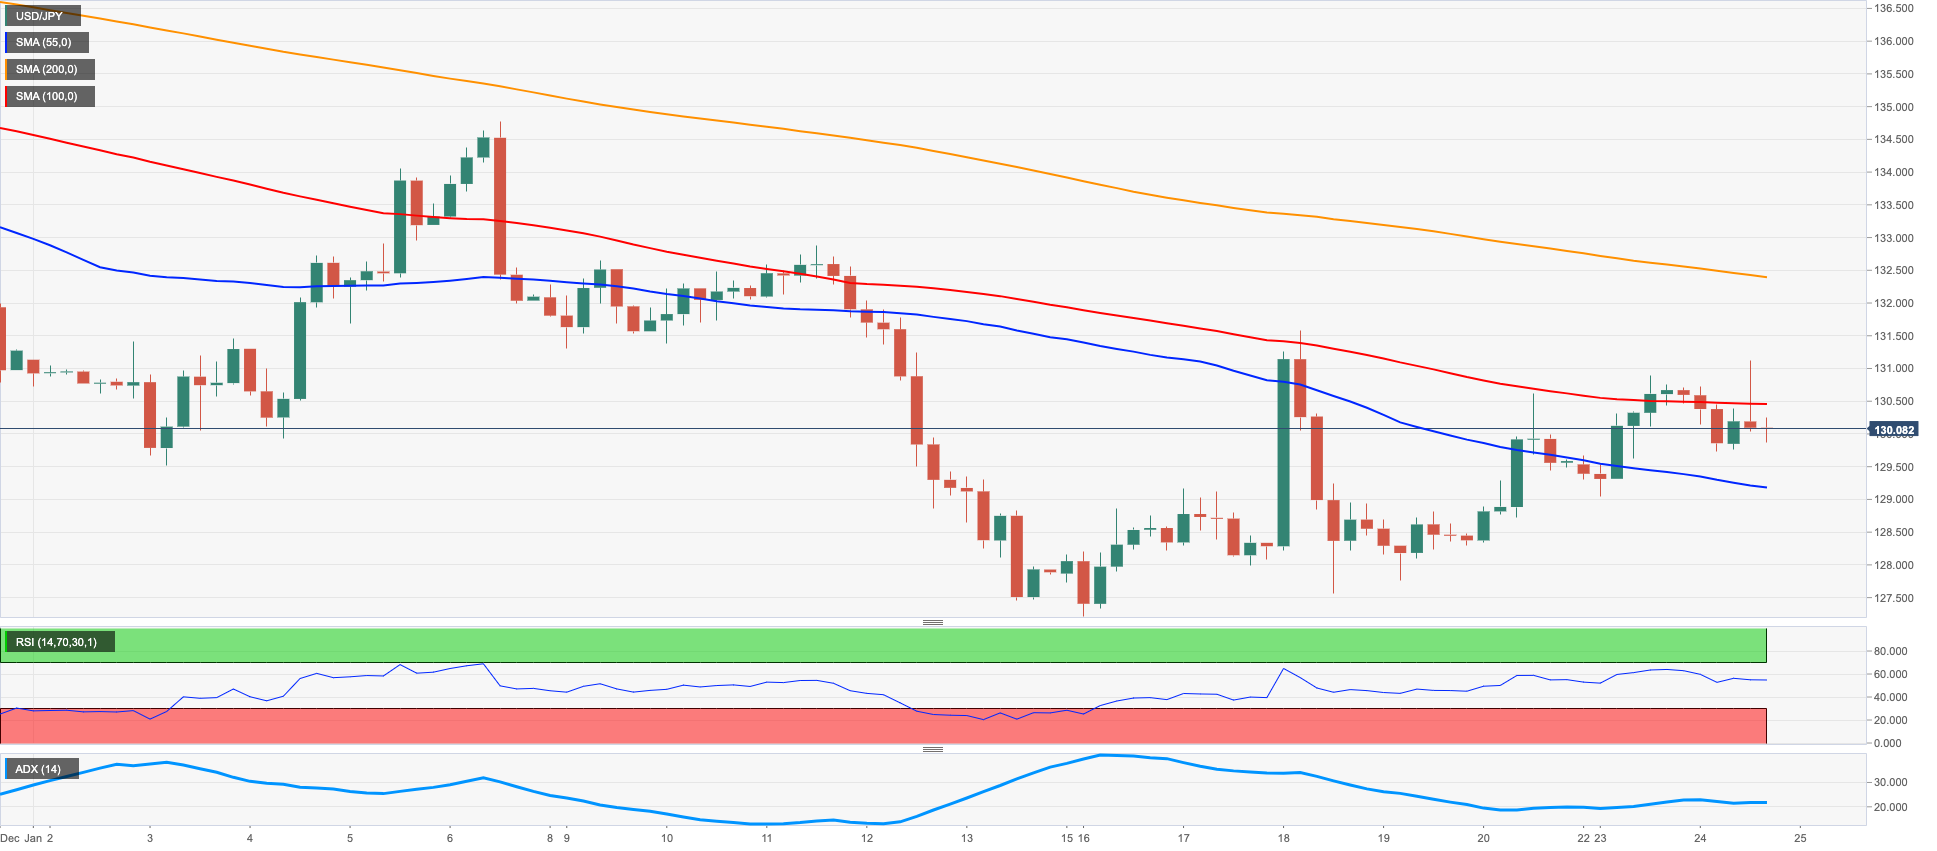
USD/JPY saw its recent bullish attempt lose some impulse and revisit the 129.70 zone amidst the continuation of the consolidative mood in the greenback and the absence of fresh buying interest in US yields.
Indeed, the greenback extended further the multi-session range bound trade while the recent upside in US yields across the curve appears to have entered an impasse following the recent recovery.
In Japan, the JGB 10-year yields managed to regain some balance and surpass the 0.40% region following several sessions trading on the defensive.
The Japanese docket saw flash figures of the Jibun Bank Manufacturing PMI at 48.9 in January and 52.4 when it comes to the Services PMI.
Further upside in USD/JPY is expected to challenge the so far weekly high at 130.88 (January 23) prior to another weekly top at 131.57 (January 20). The surpass of the latter could put a test of the 2023 peak at 134.77 (January 6) back on the investors’ radar before the interim 55-day SMA at 135.03 and the key 200-day SMA at 136.72. North of this region appears weekly highs at 138.17 (December 15 2022) and 139.89 (November 30 2022) prior to the round level at 140.00. On the opposite side, there are no support levels of note before the January low at 127.21 (January 16) ahead of the May 2022 low at 126.36 (May 24) and the weekly low at 121.27 (March 31 2022). The daily RSI deflated below the 44 yardstick.
Resistance levels: 130.88 131.57 132.51 (4H chart)
Support levels: 129.04 127.56 127.21 (4H chart)
GBPUSD
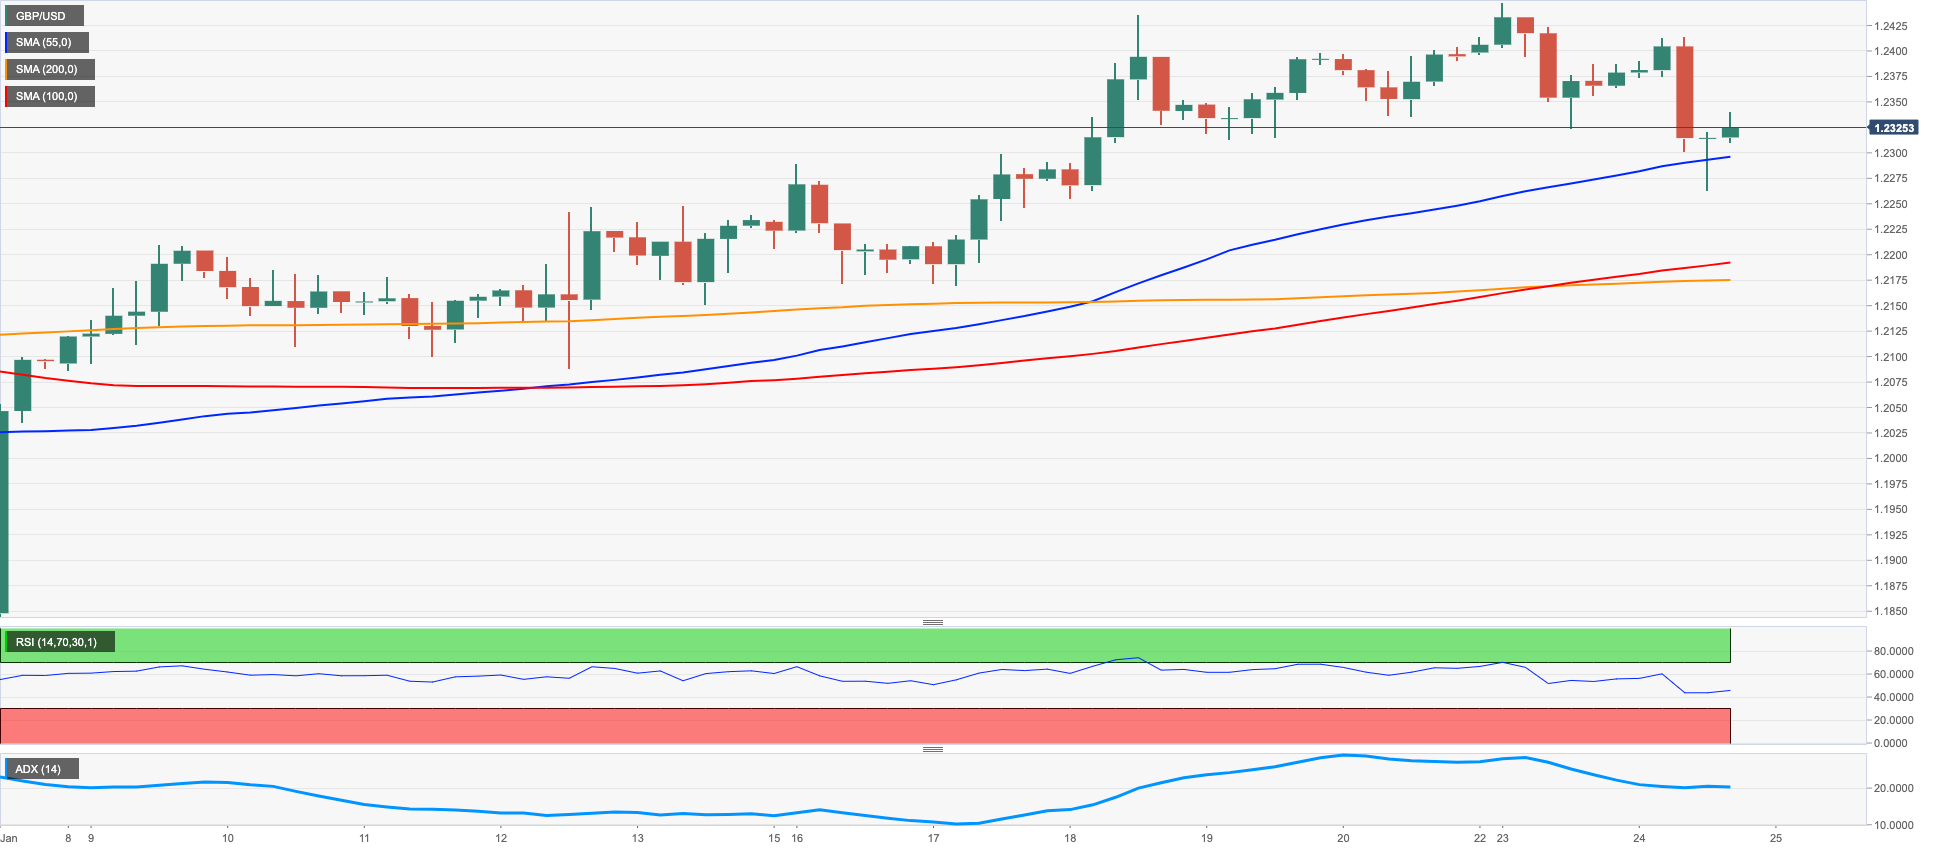
GBP/USD extended further the rejection from the 2023 peak near 1.2450 recorded at the beginning of the week, this time printing fresh multi-day lows in the sub-1.2300 region on Tuesday.
Indeed, the corrective move in the British pound triggered another daily pullback in cable amidst the decent rebound in the greenback and some loss of momentum in the risk-associated universe.
Extra weakness hurt the quid after discouraging advanced PMI prints reignited recession concerns, while equally disheartening figures from the UK’s public sector finances also weighed on the currency.
On the latter, Public Sector Net Borrowing shrank to £26.6B in December and preliminary readings saw the Services and Manufacturing PMI at 48.0 and 46.7, respectively, in January.
Gains in GBP/USD are expected to accelerate once the 2023 peak at 1.2447 (January 23) is cleared. Further north aligns the May 2022 high at 1.2666 (May 27) prior to the key 200-week SMA at 1.2906 and the psychological 1.3000 mark. Conversely, there is a provisional support at the 55-day SMA at 1.2090, which appears reinforced by the weekly low at 1.2084 (January 12). The breach of this level could open the door to a test of the round level at 1.2000 before the key 200-day SMA, today at 1.1968. South from here turns up the January low at 1.1841 (January 6) ahead of the provisional 100-day SMA at 1.1737. The daily RSI lost the grip further and broke below 60.
Resistance levels: 1.2447 1.2558 1.2599 (4H chart)
Support levels: 1.2263 1.2168 1.2084 (4H chart)
AUDUSD
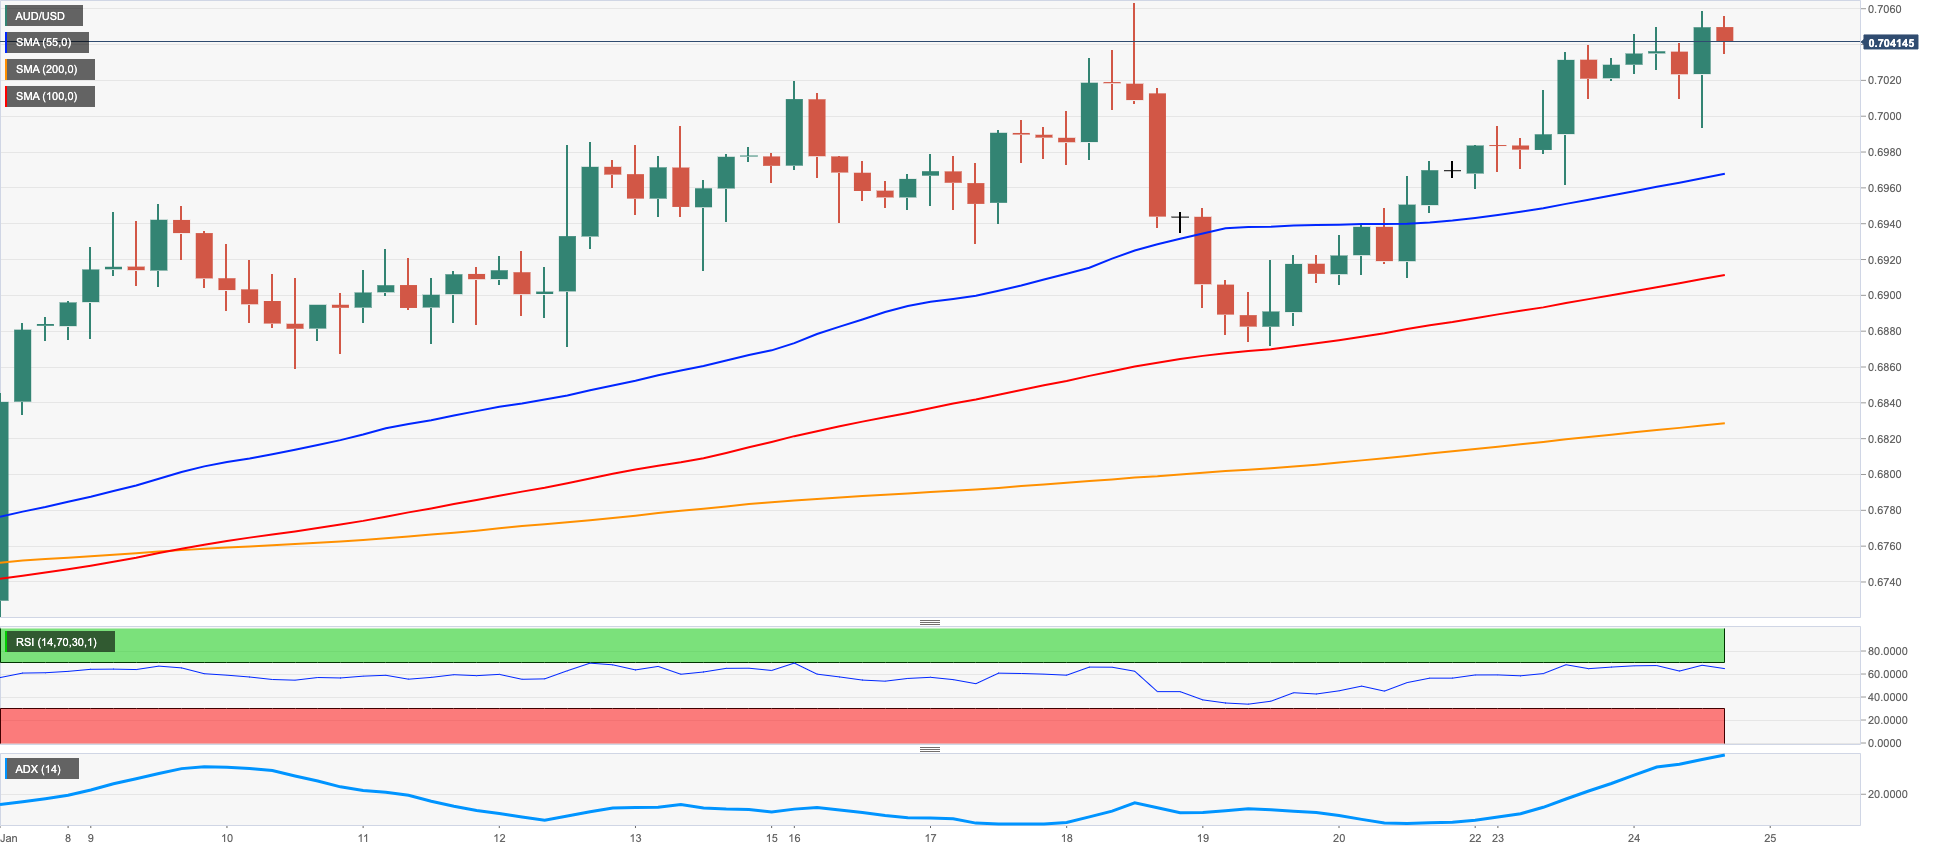
AUD/USD extended the march north on Tuesday and flirted with the area of YTD peaks in the proximity of 0.7060.
Indeed, the Aussie dollar advanced for the third session in a row on the back of further range bound in the greenback, in a context where global assets lacked a clear direction.
Daily gains in the pair, in the meantime, appeared limited by the broad-based negative mood in the commodity complex, where both copper prices and the iron ore slipped back into the negative territory.
In Oz, advanced Judo Bank Manufacturing PMI is seen easing to 49.8 in January (from 50.2) and the Judo Bank Services PMI is expected to have improved to 48.3 (from 47.3). In addition, the Business Confidence gauged by NAB improved to -1 in December (from -4).
The continuation of the uptrend in AUD/USD should now clear the 2023 high at 0.7063 (January 16). The breakout of this level could prompt a potential visit to the August 2022 top at 0.7136 (August 11) to emerge on the horizon prior to the June 2022 peak at 0.7282 (June 3) and the round level at 0.7300. Just the opposite, the initial support remains at the weekly low at 0.6871 (January 19) before the key 200-day SMA at 0.6813 and the temporary 55-day SMA at 0.6776. South from here turns up the January low at 0.6688 (January 3) prior to the December low at 0.6629 (December 20) and weekly lows at 0.6584 (November 21) and 0.6386 (November 10). The daily RSI gathered traction and trespassed the 65 level.
Resistance levels: 0.7057 0.7063 0.7136 (4H chart)
Support levels: 0.6962 0.6905 0.6871 (4H chart)
GOLD
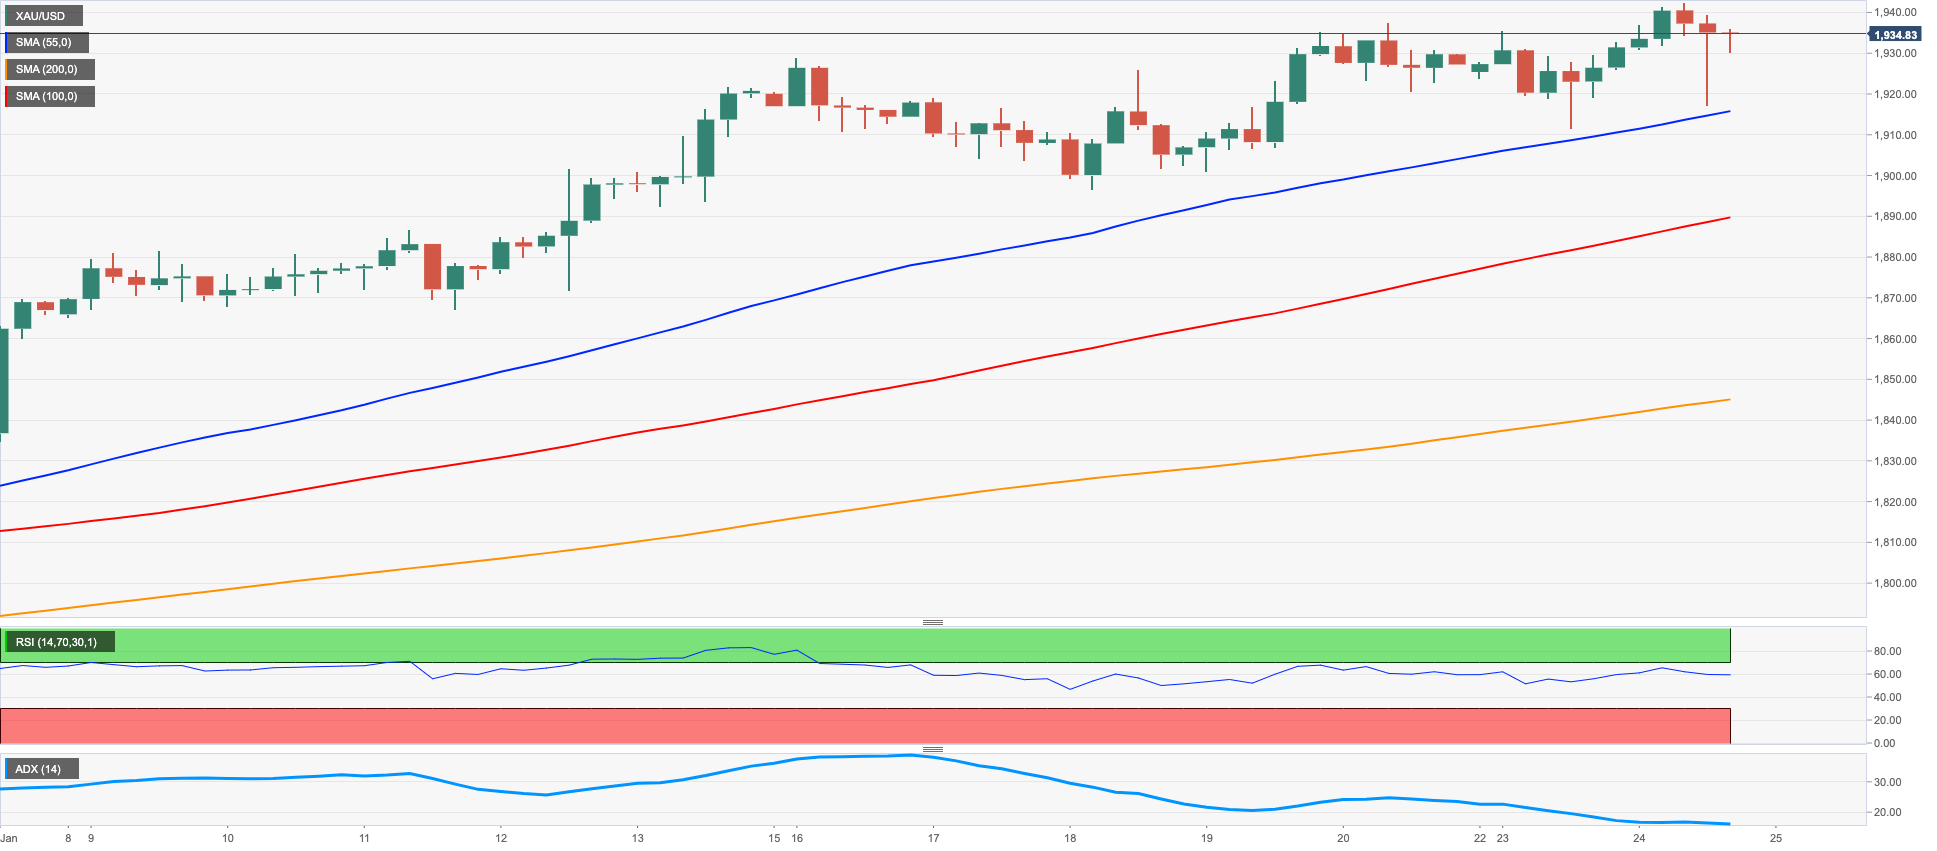
Gold prices extended the auspicious start of the week and clinched new highs past the $1940 per ounce troy on turnaround Tuesday, an area last visited back in late April 2022.
Indeed, the lack of a clear direction around the greenback in combination with the loss of upside traction in US yields across the curve sponsored the second consecutive daily advance in the yellow metal.
Collaborating further with the upbeat tone in bullion came the generalized upside bias in the rest of the precious metals.
The new YTD top at $1942 now emerges as the immediate target for gold bulls. The breakout of this level could pave the way for a move to the April 2022 peak at $1998 (April 18) just ahead of the psychological $2000 mark and followed by the 2022 high at $2070 (March 8). On the other hand, weekly lows at $1896 (January 18) and $1867 (January 11) should offer minor support prior to the interim 55-day SMA at $808. The loss of this region could put the 200-day SMA at $1777 to the test ahead of the 100-day SMA at $1746 and the weekly low at $1727 (November 23).
Resistance levels: $1942 $1955 $1982 (4H chart)
Support levels: $1917 $1911 $1896 (4H chart)
CRUDE WTI
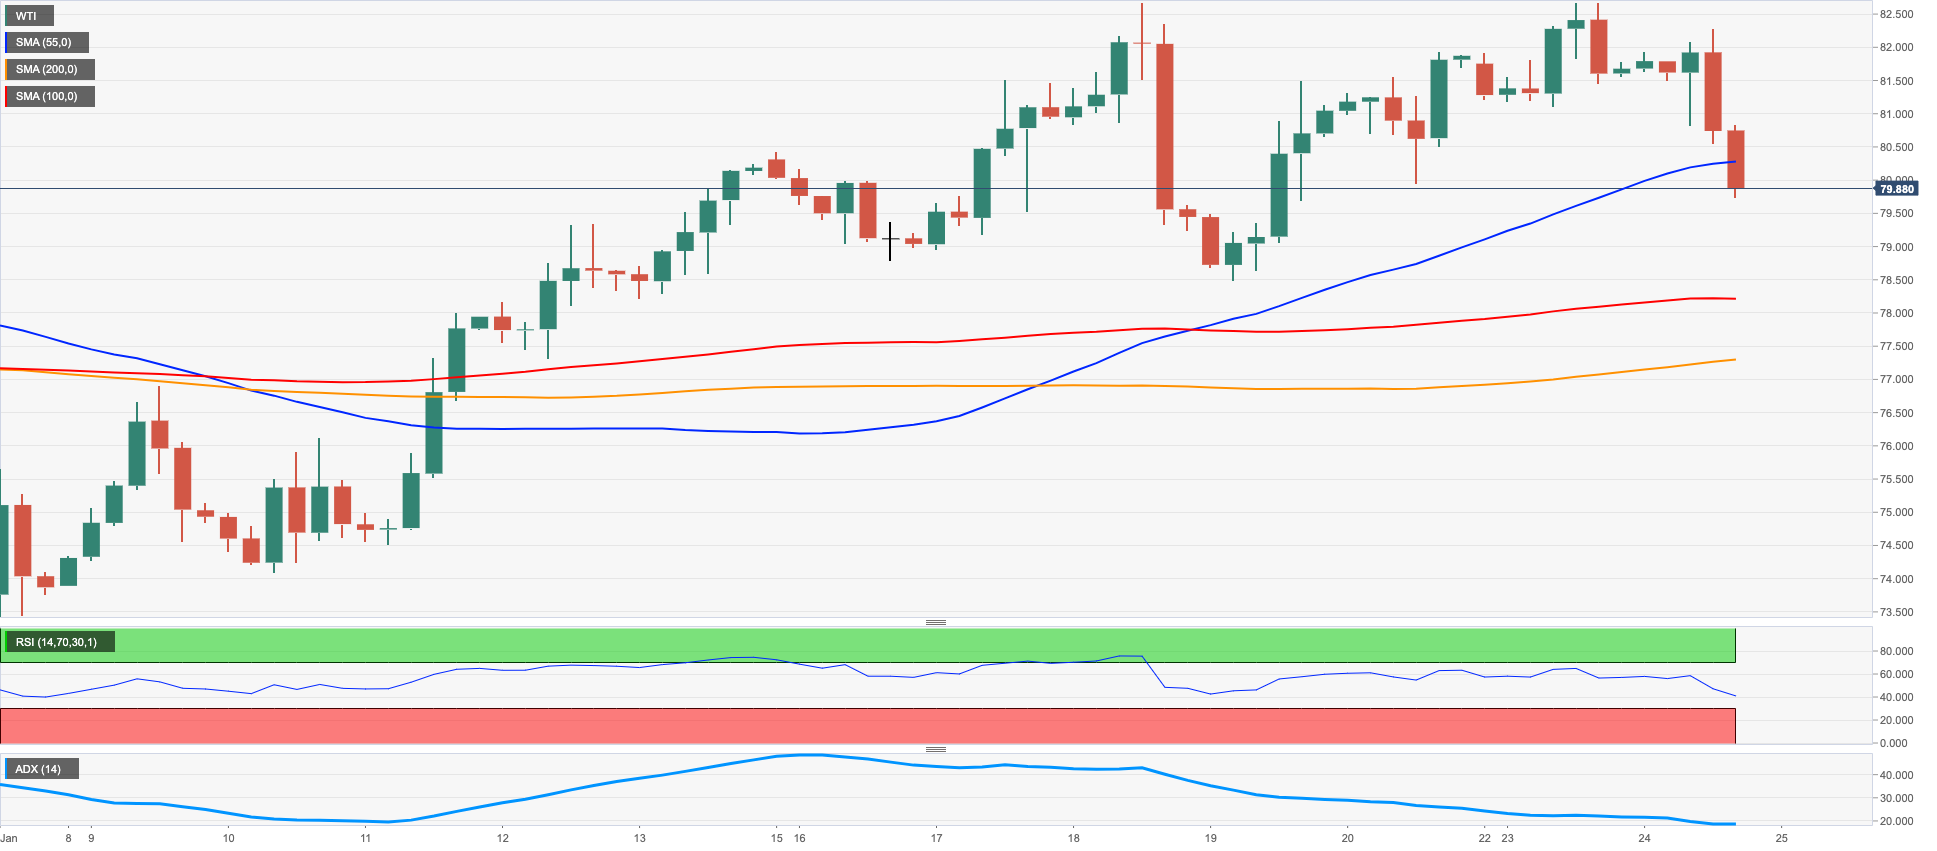
WTI prices added to Monday’s bearish note and retested the area below the key $80.00 mark on Tuesday.
The negative performance of the American reference for the sweet light crude oil came in response to reignited concerns among traders regarding a potential economic slowdown and the persistence of elevated inflation around the world.
The ongoing reopening in China, however, continued to offer some contention in case of sellers regain the initiative.
Later in the NA session, the API will report on US crude oil stockpiles in the week to January 20 ahead of the EIA’s report on Wednesday.
The resumption of the bullish impulse should focus on the YTD high at $82.60 (January 23) ahead of the December 2022 top at $83.32 (December 1). If gains accelerate, then the commodity could confront the $90.08 level (November 11 2022) prior to the 200-day SMA at $92.64 and the November 2022 top at $93.73. Further up emerges the weekly peak at $97.65 (August 30 2022) before the critical $100.00 mark. By contrast, the temporary 55-day SMA at $79.05 offers initial contention before the January low at $72.50 (January 5) and the 2022 low at $70.10 (December 9). The loss of the latter exposes the key round level at $70.00 ahead of the weekly low at $66.15 (December 20 2021) and before the 200-week SMA at $65.72.
Resistance levels: $82.60 $83.32 $88.65 (4H chart)
Support levels: $79.71 $78.08 $77.04 (4H chart)
GER40
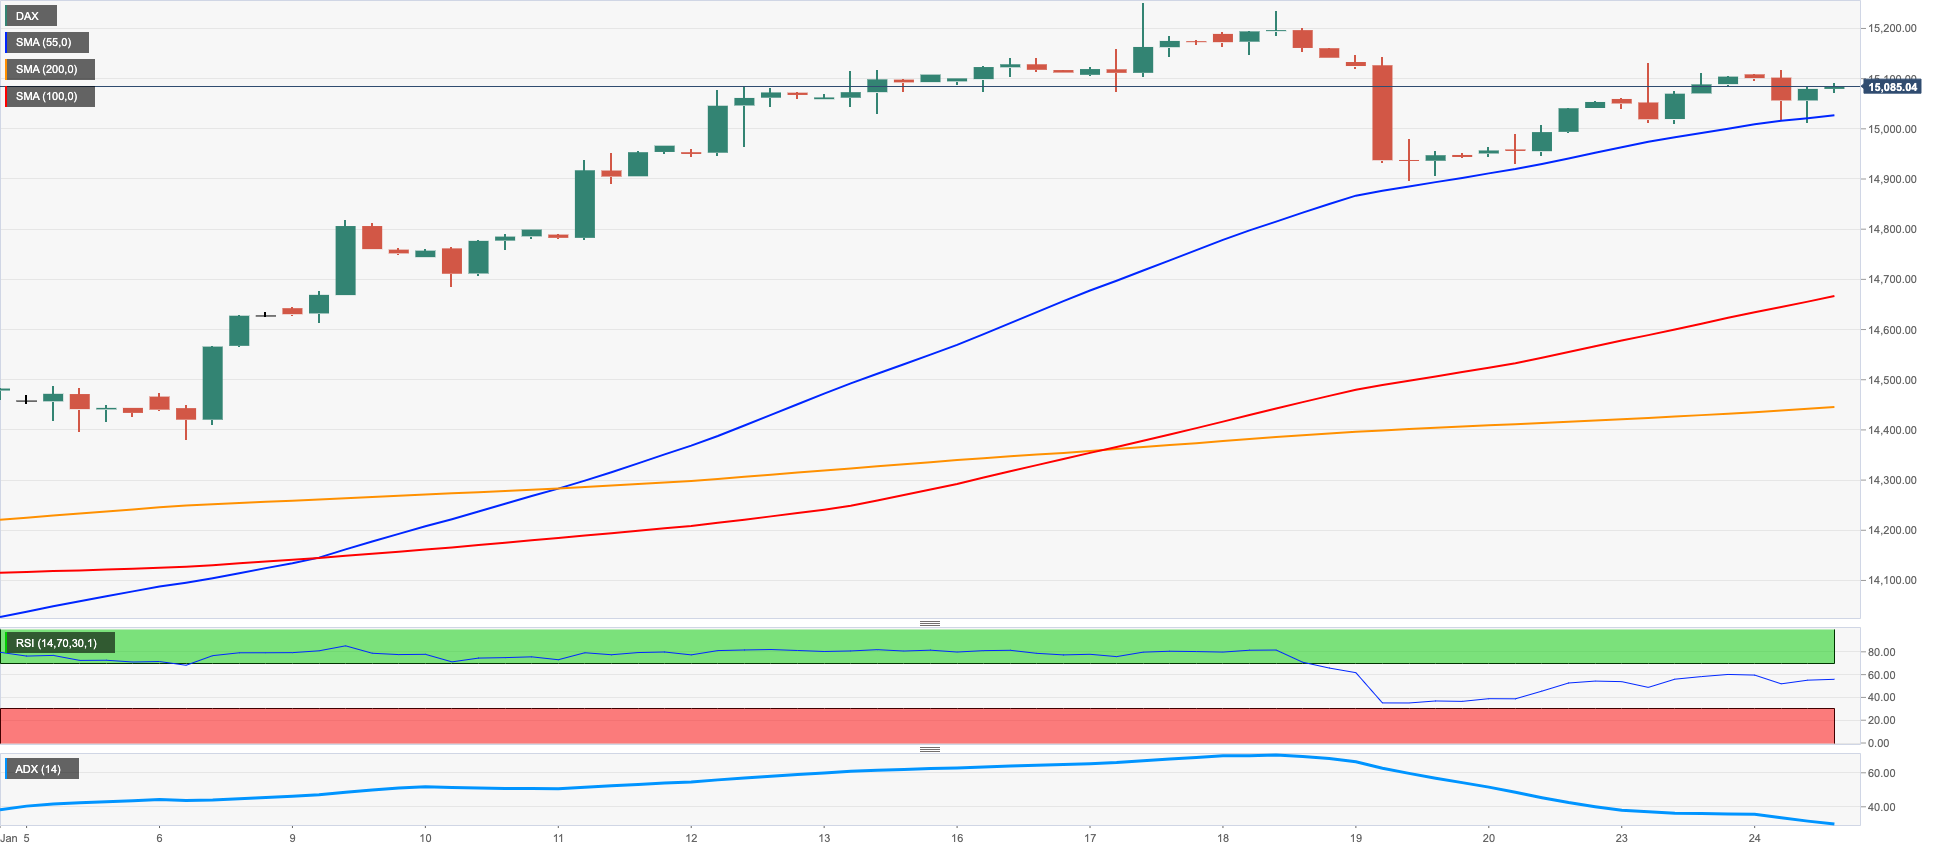
European equities traded on a mixed note on Tuesday.
Indeed, the German DAX 40 charted modest losses in line with the pan-European index and the UK’s FTSE100.
The downtick in the index came despite the Consumer Confidence in Germany improved for the month of February according to the latest survey by the GfK institute, although preliminary PMIs were kind of disappointing in January.
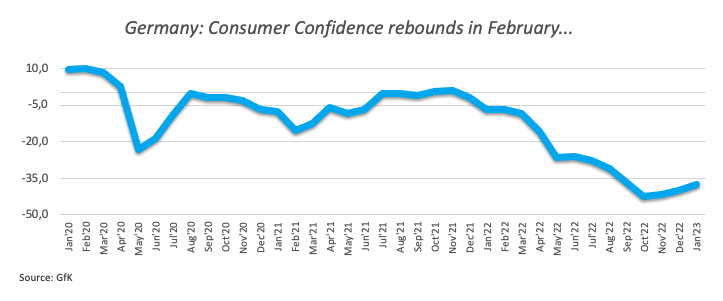
In the meantime, and despite Tuesday’s knee-jerk, the German economy seems to have averted a recession. While this could limit occasional bearish attempts, the persistent hawkish narrative from ECB’s rate setters could undermine the ongoing positive start of the new year for stocks.
Immediately to the upside for the DAX 40 comes the so far 2023 top at 15262 (January 17). The advance beyond the latter could challenge the 2022 peak at 16285 (January 5), which also coincides with the November 2021 high (November 18). In the opposite direction, there is decent support at the weekly low at 14906 (January 19) seconded by the interim 55-day SMA at 14408 and the December 2022 low at 13791 (December 20). South from here lines up the key 200-day SMA at 13601 prior to the November 2022 low at 13022 (November 3) and the minor support at 12548 (October 21 2022). The daily RSI eased slightly below the 56 level.
Best Performers: Daimler Truck Holdings, Munich Re Group, Hannover Rueck SE
Worst Performers: Sartorius AG VZO, Zalando SE, Merck
Resistance levels: 15147 15269 15542 (4H chart)
Support levels: 14906 14758 14470 (4H chart)
NASDAQ
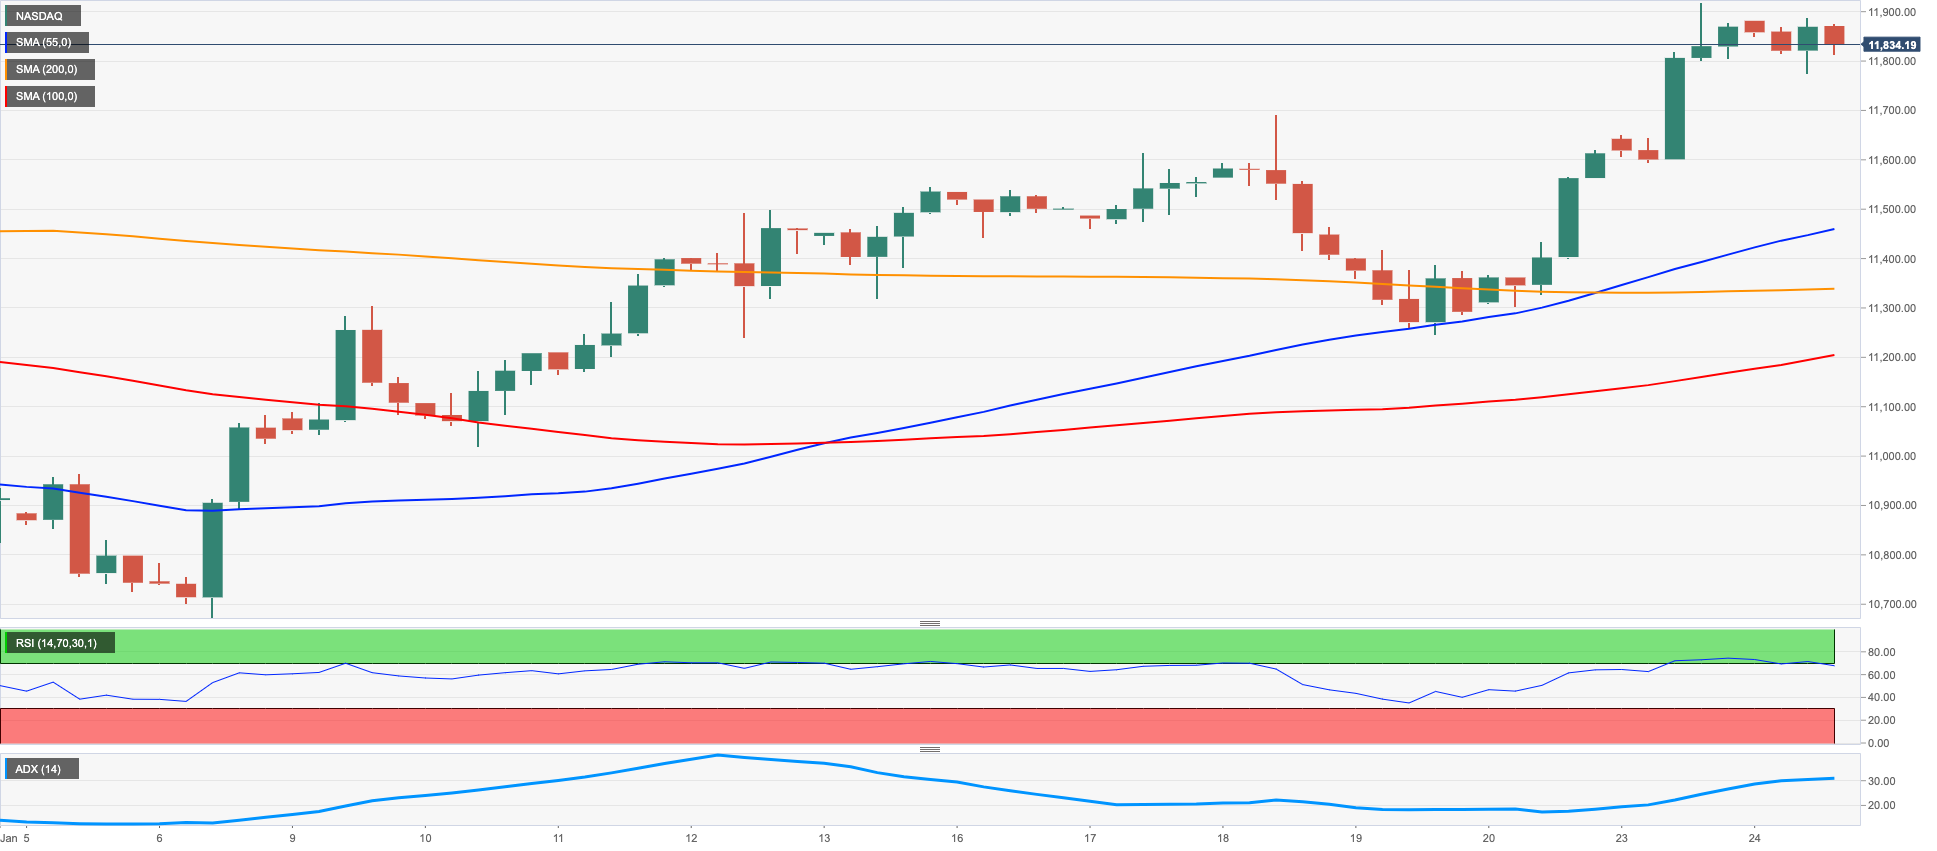
Tech equities gauged by the Nasdaq 100 advanced modestly and added to the optimism seen at the beginning of the week on Tuesday.
In fact, the tech sector managed to leave behind the initial negative mood and regained some balance, as investors continued to gauge corporate earnings and the likelihood of a soft landing in the US economy.
In the meantime, disheartening prints from the manufacturing sector appear to have lent extra support to the view of an impasse in the Fed’s tightening cycle, at the time when investors have already fully priced in a 25 bps rate hike by the Federal Reserve at the February 1 meeting.
The Nasdaq 100 faces the next up barrier at the 2023 high at 11918. Once this level is cleared, the index could revisit the key 200-day SMA at 12036 prior to the December 2022 peak at 12166 (December 13) and the September 2022 high at 12752 (September 12). Contrarily, sellers are expected to meet initial contention at the weekly low at 11251 (January 19) ahead of the January low at 10696 (January 6) and the December 2022 low at 10671 (December 22). Extra decline could see the November 2022 low at 10632 (November 4) revisited ahead of the 2022 low at 10440 (October 13). The daily RSI remained stable around the 64 region.
Top Gainers: PACCAR, Monster Beverage, Netflix
Top Losers: Enphase, AMD, AstraZeneca ADR
Resistance levels: 11918 12166 12752 (4H chart)
Support levels: 11456 11251 10696 (4H chart)
DOW JONES
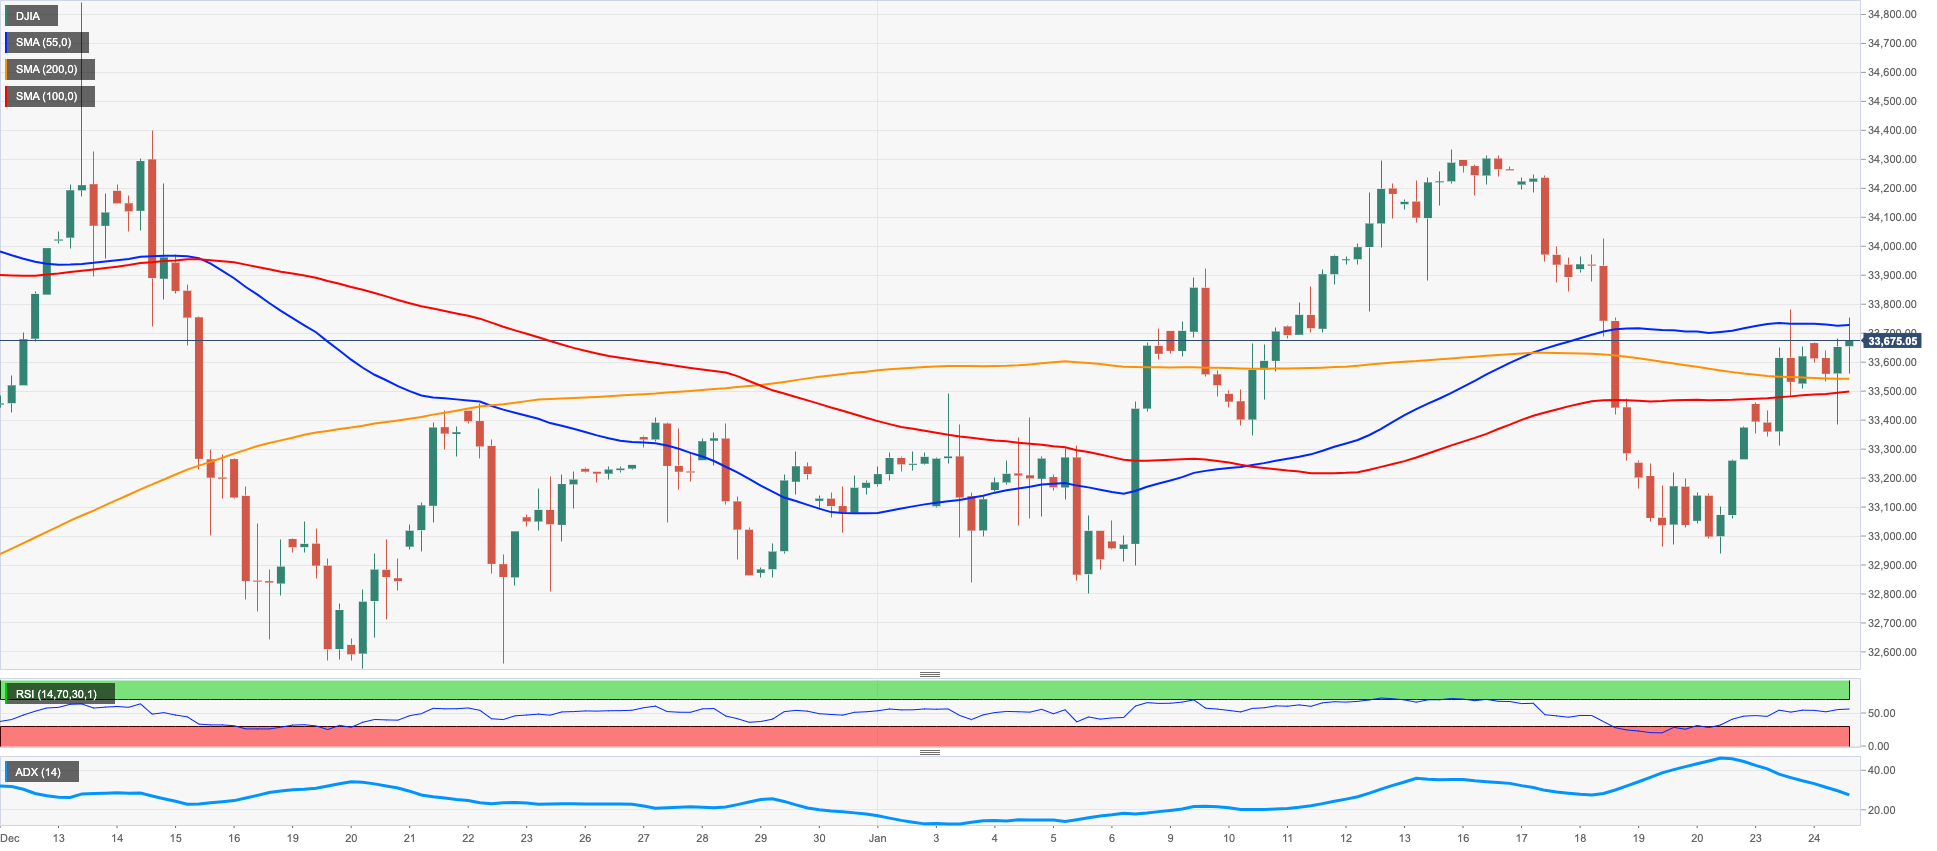
US equities gauged by the Dow Jones advanced modestly on Tuesday and added to the positive start of the week, revisiting at the same time the 33700 region.
Daily gains in the index came in contrast to small pullbacks in the S&P500 and the Nasdaq Composite against the backdrop of rising cautiousness among investors as quarterly corporate reports remained in centre stage.
In addition, prudence kept running high ahead of the FOMC event on February 1, where the Federal Reserve is widely anticipated to hike rates by 25 bps.
Overall, the Dow Jones rose 0.21% to 33700, the S&P500 dropped 0.06% to 4017 and the tech-reference Nasdaq Composite retreated 0.16% to 11346.
Dow Jones needs to leave behind the so far weekly high at 33782 (January 23) to allow for a challenge of the 2023 top at 34342 (January 13). The breakout of this level could prompt a visit to the December 2022 peak at 34712 (December 13) to emerge on the horizon prior to the April 2022 high at 35492 back and the February 2022 peak at 35824 (February 9). On the flip side, the weekly low at 32948 (January 20) offers initial contention ahead of the December 2022 low at 32573 (December 22) and the key 200-day SMA at 32359. South of this region, the index could dispute the November 2022 low at 31727 (November 3) prior to the minor support at 30206 (October 21 2022) and the 2022 low at 28660 (October 13). The daily RSI picked up pace and flirted with 53.
Top Performers: Travelers, Caterpillar, Apple
Worst Performers: 3M, Walgreen Boots, Merck&Co
Resistance levels: 33782 34342 34712 (4H chart)
Support levels: 32948 32573 32230 (4H chart)
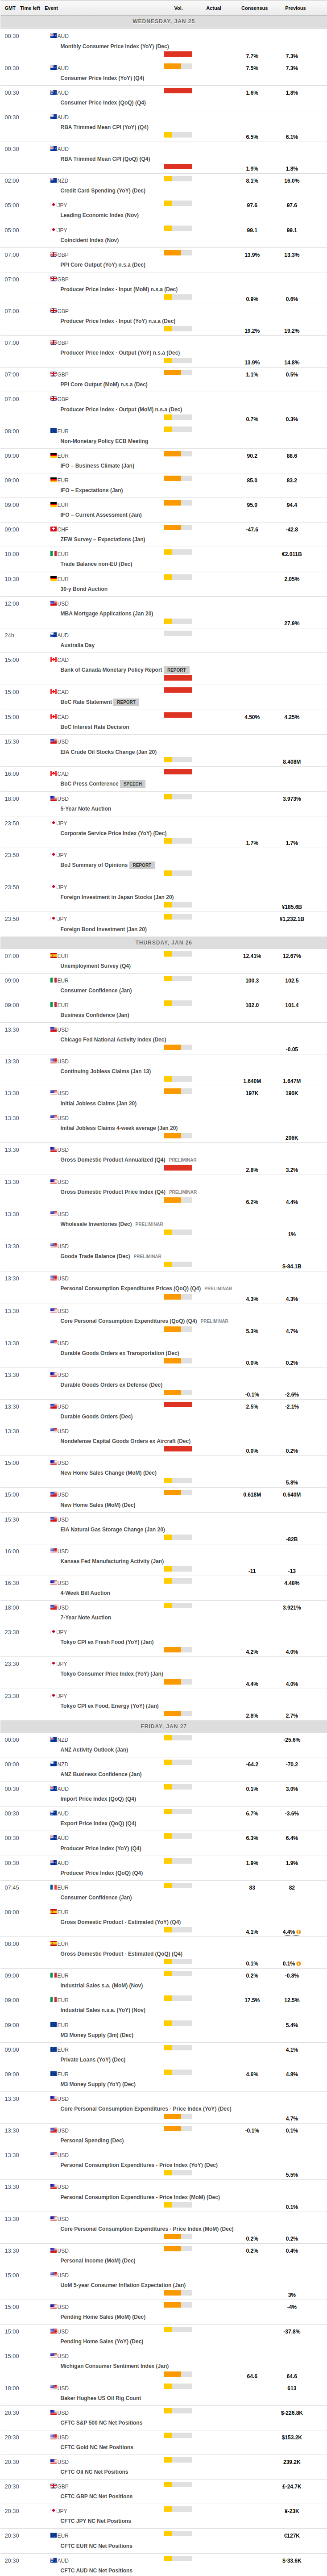
MACROECONOMIC EVENTS
All Information & Updates provided by:

All information relating to the financial markets available on this page has been prepared and issued by FXStreet (Forexstreet SL, Spain, Reg: B62498233) on the basis of publicly available information and all information believed to be reliable and does not conflict with Kuwaiti local laws, and all necessary care has been taken to before the company to ensure that the facts mentioned are correct from the source.
NCM Investment nor any of its directors or employees shall in any way be held responsible for the contents of this news, and the information contained on this page is intended only to provide clients with publicly available information and should not be construed as investment advice, report or analysis and/or constitute an offer or invitation to buy or sell financial instruments of any kind.
RISK WARNING: Forex and CFDs are highly risky leveraged products, as losses can exceed deposits. Please ensure you understand all the risks and take independent advice if necessary. NCM will segregate the clients based on the criteria of the regulator and its bylaws. NCM does not provide any advisory service; the material published does not constitute advice or a recommendation for a transaction in any financial instrument. NCM accepts no responsibility for any use of the content presented and any consequences of that use. Anyone acting on the information provided does so at their own risk.