
- Contact Us:
-

-

-

-


Daily Market Updates
26 Jan 2023
USDJPY
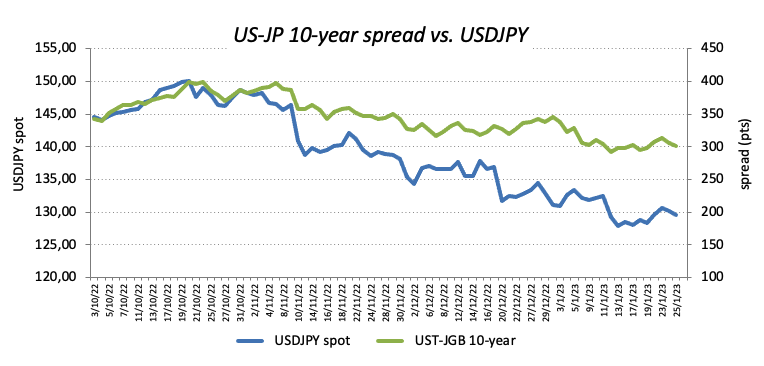
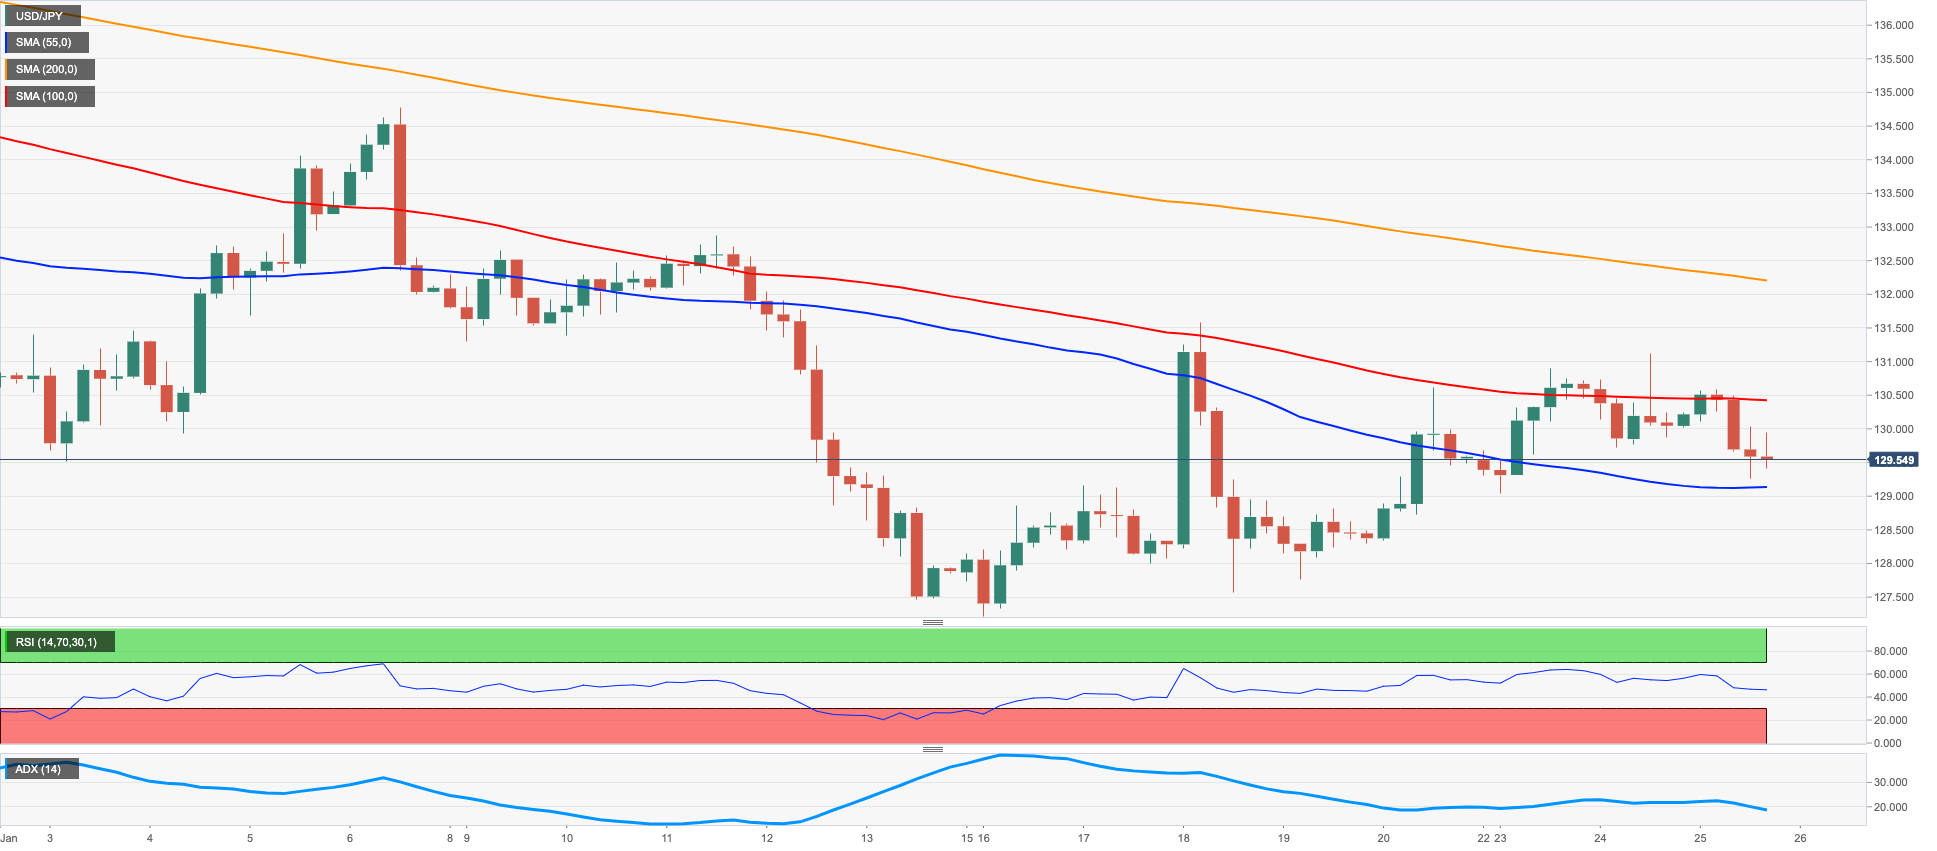
USD/JPY met further selling pressure and dropped to 2-day lows in the 129.30/25 band, not before climbing to daily highs near 130.60 on Wednesday.
The positive mood around the risk complex undermined the demand for the Japanese safe haven, although the offered stance in the buck coupled with diminishing US yields played against the continuation of the initial rebound.
Still on yields but in the Japanese debt market, the JGB 10-year yields added to Tuesday’s rebound and poked with the 0.45% region.
Data wise in the “Land of the Rising Sun”, final figures saw the Coincident Index at 99.3 (from 99.6) and the Leading Economic Index at 97.4 (from 98.6), both prints for the month of November.
Extra recovery in USD/JPY should initially confront the weekly top at 131.11 (January 24). The breakout of this level should put a potential visit to another weekly peak at 131.57 (January 20) back on the radar ahead of the 2023 high at 134.77 (January 6), which appears reinforced by the temporary 55-day SMA. North from here comes the key 200-day SMA at 136.73 before weekly tops at 138.17 (December 15 2022) and 139.89 (November 30 2022), all ahead of the round level at 140.00. Conversely, the next big magnet for bears should turn up at the January low at 127.21 (January 16) prior to the May 2022 low at 126.36 (May 24) and the weekly low at 121.27 (March 31 2022). The daily RSI lost the grip and broke below 42.
Resistance levels: 131.11 131.57 132.51 (4H chart)
Support levels: 129.26 129.17 129.04 (4H chart)
GBPUSD
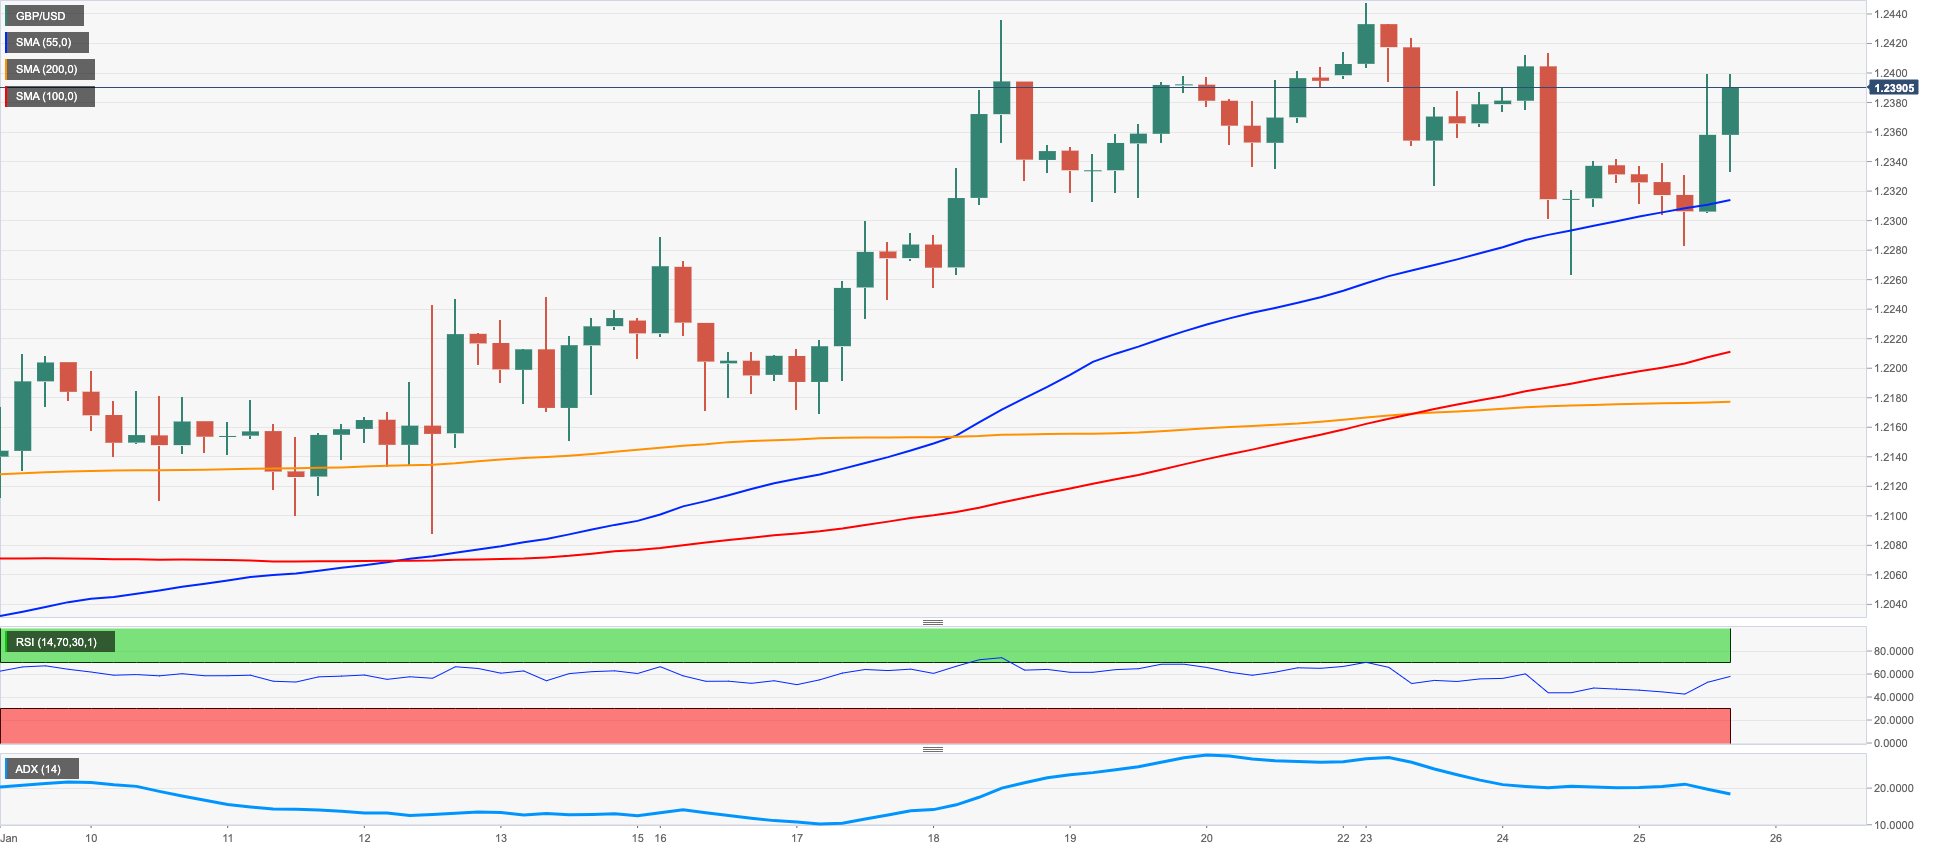
GBP/USD gathered convincing upside traction and flirted with the key 1.2400 mark on Wednesday, leaving behind at the same time two daily sessions in a row closing in the red territory.
In fact, the poor performance in the dollar amidst the improvement in the sentiment surrounding the risk complex motivated Cable to attempt another bull run to the key 1.2400 neighbourhood.
In the UK money market, the 10-year Gilt yields extended the corrective decline to levels last seen back in mid-December 2022 below the 3.20% level.
The UK docket showed Producer Prices Input contracted 1.1% MoM in December and Producer Prices Output dropped 0.8% MoM.
Next on the upside for GBP/USD comes the 2023 high at 1.2447 (January 23) prior to the May 2022 top at 1.2666 (May 27) and the key 200-week SMA at 1.2906, all preceding the psychological 1.3000 level. Inversely, the 55-day SMA at 1.2109 offers provisional support ahead of the weekly low at 1.2084 (January 12) and the round level at 1.2000. The breach of this zone exposes a drop to the key 200-day SMA at 1.1965 prior to the January low at 1.1841 (January 6) and the interim 100-day SMA at 1.1746. The daily RSI advanced north of the 63 mark.
Resistance levels: 1.2447 1.2558 1.2599 (4H chart)
Support levels: 1.2263 1.2175 1.2084 (4H chart)
AUDUSD
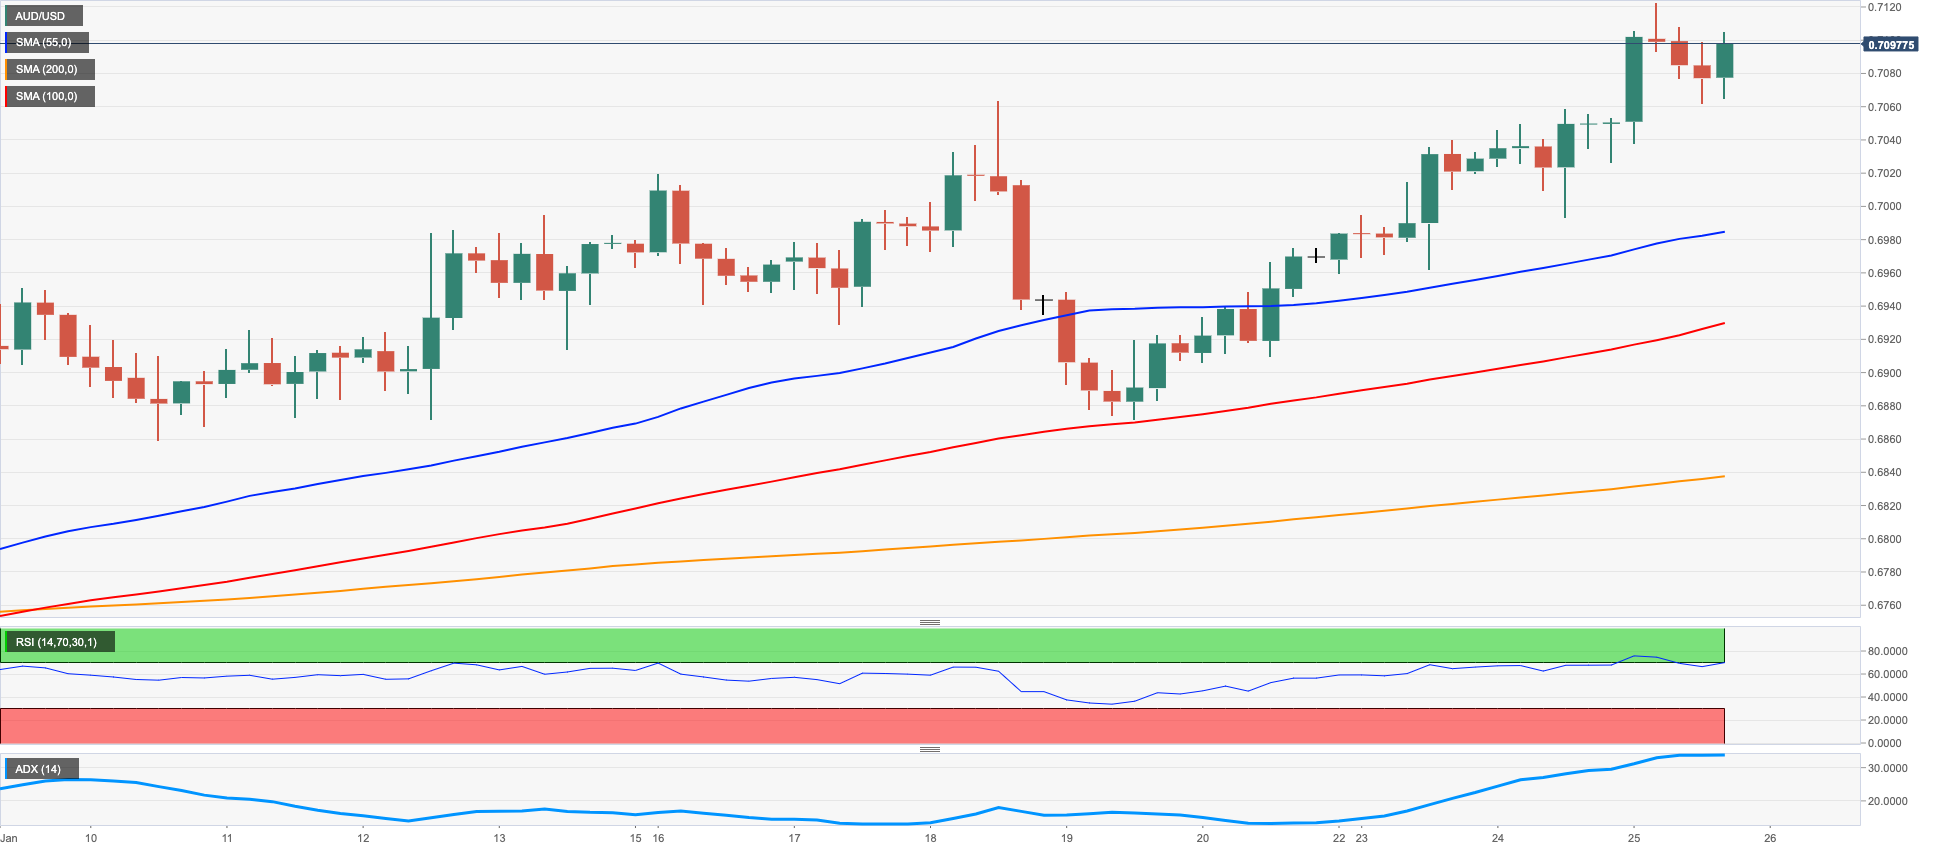
AUD/USD extended the upside momentum for the fourth consecutive session and climbed to fresh tops past 0.7100 the figure for the first time since early August 2022 on Wednesday.
Indeed, the Aussie dollar saw its buying interest pick up pace following higher-than-expected inflation figures in Oz for the last part of 2022, which at the same time helped maintain expectations alive for extra tightening by the RBA.
In fact, Australian Inflation Rate rose 7.8% YoY in the October-December period (from 7.3%) and rose 1.9% vs. the previous quarter. In addition, the Monthly CPI Indicator rose 8.4% in December. Further results showed the Westpac Leading Index contract at a monthly 0.1% also in December.
Limiting the upside in the pair, however, appeared the improvement in the greenback and the poor performance of the commodity complex, where copper prices and the iron ore extended losses.
Following the new 2023 top at 0.7122 (January 25), AUD/USD could now challenge the August 2022 peak at 0.7136 (August 11) ahead of the June 2022 high at 0.7282 (June 3) and the round level at 0.7300. On the opposite side, the weekly low at 0.6871 (January 19) remains as the initial contention zone before the key 200-day SMA at 0.6812 and the interim 55-day SMA at 0.6789. The loss of this region exposes a potential pullback to the January low at 0.6688 (January 3) ahead of the December low at 0.6629 (December 20) seconded by weekly lows at 0.6584 (November 21) and 0.6386 (November 10). The daily RSI extended the march north and trespassed the 68 hurdle.
Resistance levels: 0.7122 0.7136 0.7226 (4H chart)
Support levels: 0.6993 0.6962 0.6871 (4H chart)
GOLD
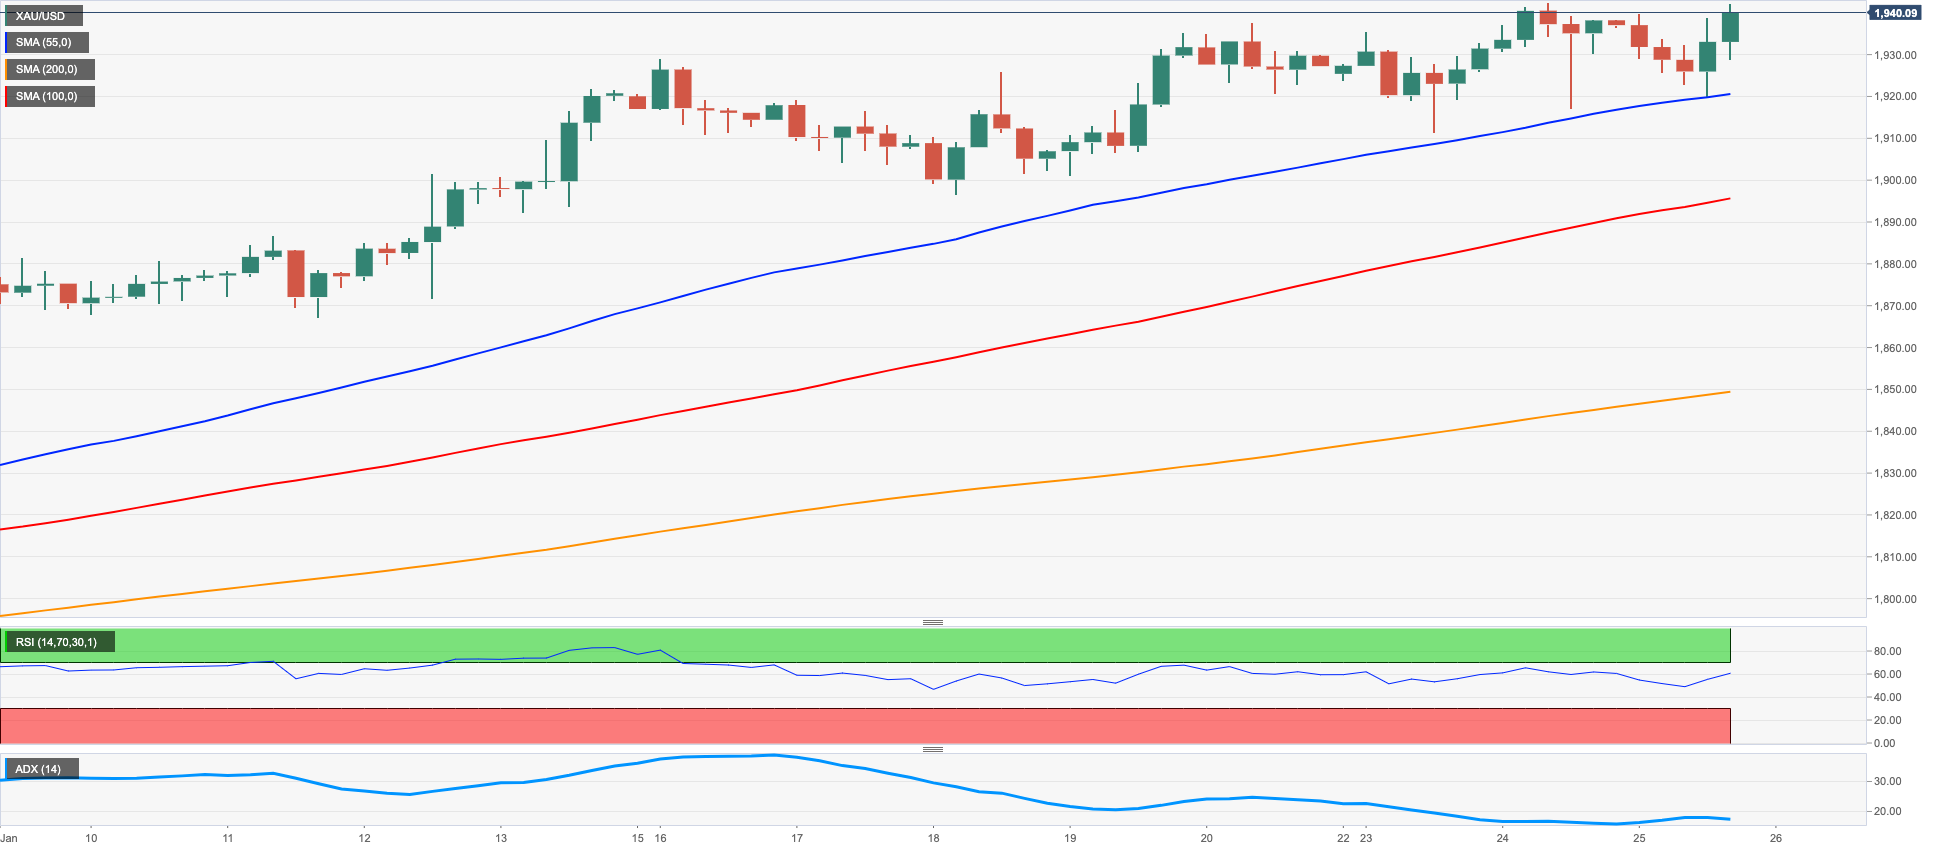
Prices of the ounce troy of the yellow metal kept the optimism well and sound for the third straight session on Wednesday, managing to reclaim the area above $1940 and flirt with YTD peaks.
Indeed, the daily retracement in the greenback in collaboration with declining US yields across the curve sponsored the continuation of the rally in the precious metal for yet another day midweek.
In the meantime, the precious metal could come under some pressure in light of the upcoming FOMC and ECB meetings next week, where both banks are seen extending the hiking cycle and could shed further details regarding their future moves when it comes to the rate paths.
Gold keeps the focus on the 2023 peak at $1942 (January 24, 25). The surpass of this level could pave the way for a potential visit to the April 2022 high at $1998 (April 18) just before the psychological $2000 yardstick and the 2022 top at $2070 (March 8). Just the opposite, initial contention levels line up at weekly lows at $1896 (January 18) and $1867 (January 11) ahead of the temporary 55-day SMA at $1813, while further decline could leave the metal vulnerable to a test of the 200-day SMA at $1777. Down from here comes the 100-day SMA at $1748 followed by the weekly low at $1727 (November 23).
Resistance levels: $1942 $1955 $1982 (4H chart)
Support levels: $1911 $1896 $1867 (4H chart)
CRUDE WTI
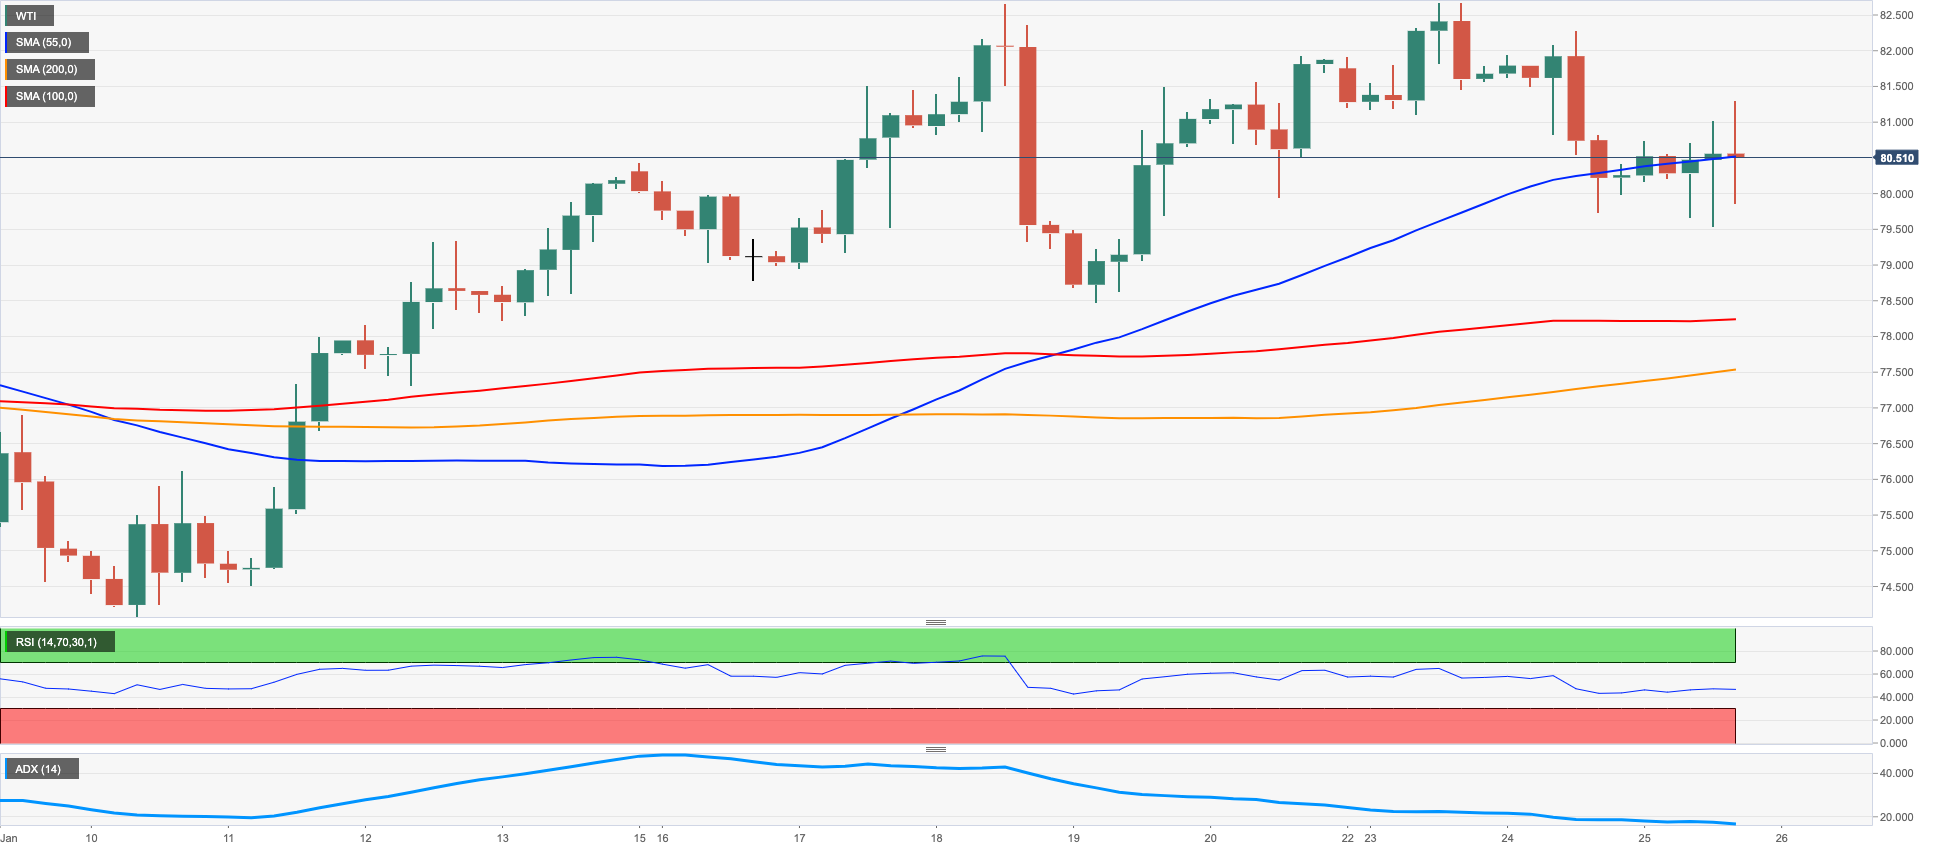
Prices of the West Texas Intermediate (WTI) charted small gains and set aside two consecutive sessions with losses on Wednesday.
The resumption of the bullish stance in prices of the commodity came in tandem with unabated fears around a potential economic slowdown amidst the ongoing tightening cycle by major central banks, while the moderate decline in the dollar also underpinned the mood among traders.
These recession concerns, in the meantime, remained a key driver for the commodity along with positive developments from the current Chinese reopening, which remained supportive of an improvement in the prospects for the demand of crude oil.
In addition, the smaller-than-expected build in the weekly crude oil inventories lent crude oil extra legs. On this, the EIA reported that US crude oil inventories increased by 0.533M barrels in the week to January 20, while supplies at Cushing went up by 4.267M barrels, distillate stocks shrank by 0.507M barrels and gasoline stockpiles rose by 1.763M barrels.
If bulls regain the upper hand, the WTI could revisit the YTD top at $82.60 (January 23) prior to the December 2022 peak at $83.32 (December 1). Once this area is cleared, the next up barrier emerges at the $90.08 level (November 11 2022) ahead of the 200-day SMA at $92.51 and the November 2022 peak at $93.73. North from here turns up the weekly high at $97.65 (August 30 2022) ahead of the key $100.00 mark per barrel. On the contrary, the breach of the interim 55-day SMA at $78.84 could open the door to a test of the January low at $72.50 (January 5) prior to the 2022 low at $70.10 (December 9) and the key round level at $70.00. A deeper pullback could put the weekly low at $66.15 (December 20 2021) to the test ahead of the 200-week SMA at $65.72.
Resistance levels: $82.60 $83.32 $88.65 (4H chart)
Support levels: $79.54 $78.08 $77.16 (4H chart)
GER40
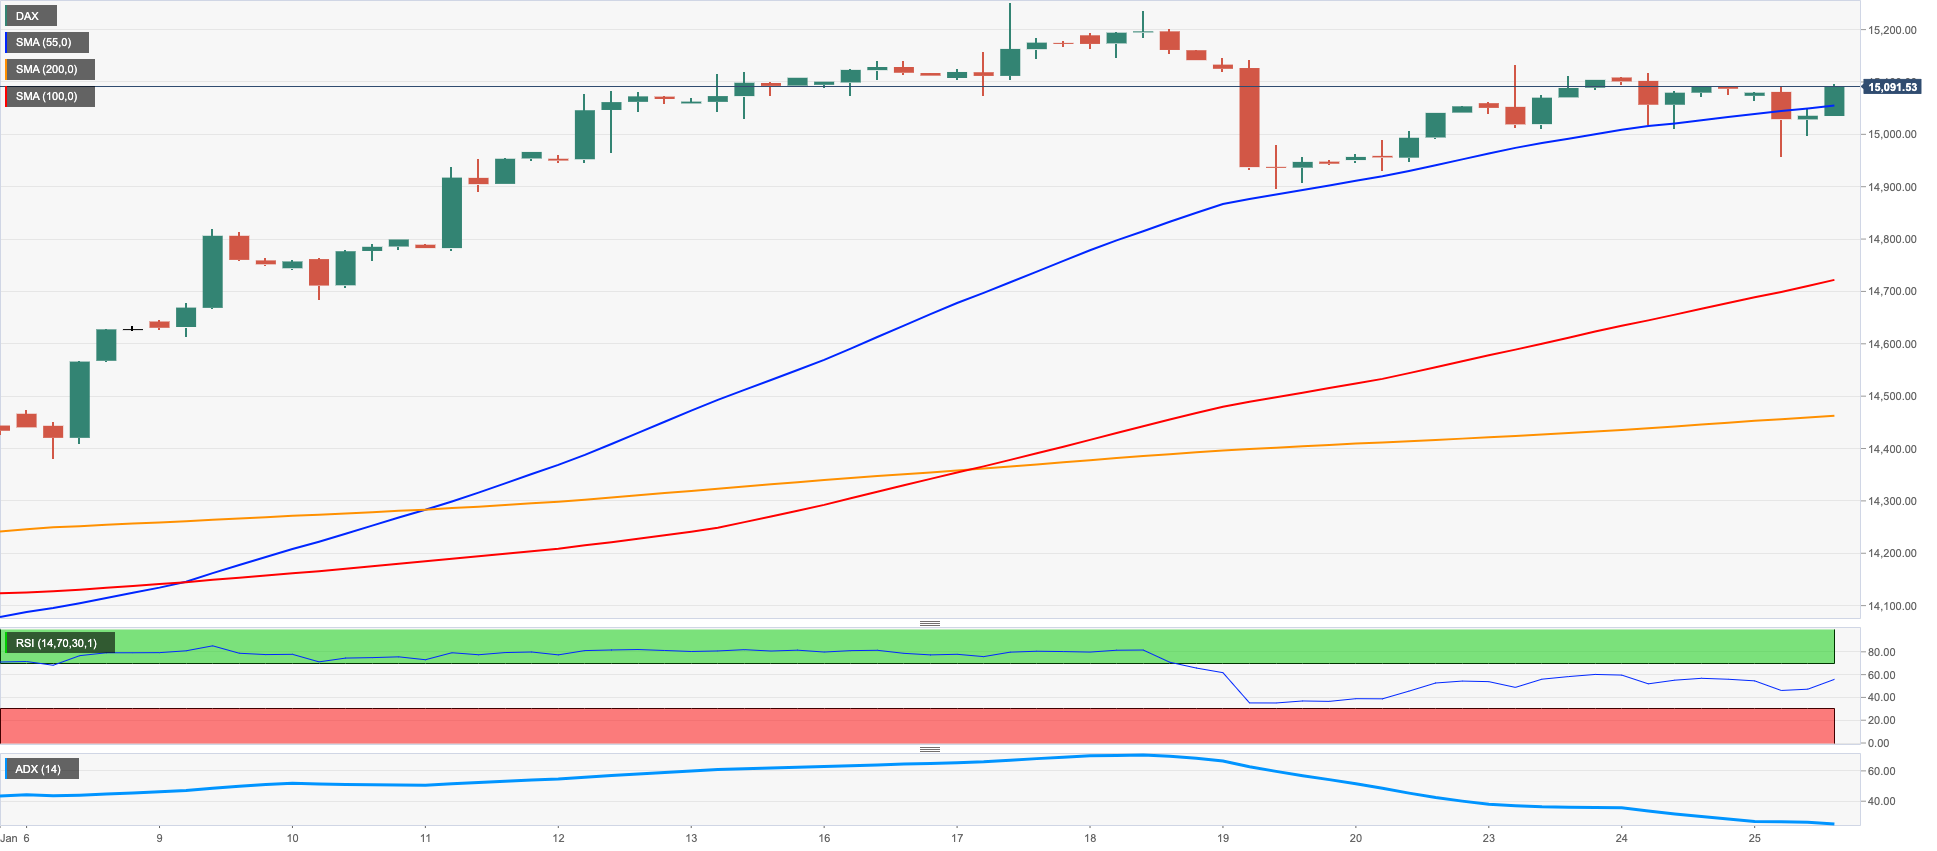
Equites tracked by the German reference DAX 40 added to Tuesday’s decline and briefly probed the area below the key 15000 mark on Wednesday.
The generalized risk-off sentiment in the global markets weighed on the German benchmark and the rest of its peers in the old continent amidst the re-emergence of recession fears and extra tightening by major central banks.
On the latter, investors have already priced in a half point rate hike by the ECB at its February 2 event.
In the domestic docket, the Business Climate tracked by the Ifo Institute improved to 90.2 in January, while Current Conditions eased marginally to 94.1 and Expectations rose to 86.4
The daily drop in stocks came in line with the second straight decline in the German 10-year Bund yields, this time approaching the 2.15% level.
Extra losses could drag the DAX 40 to initially test the weekly low at 14906 (January 19) ahead of the provisional 55-day SMA at 14432 and the December 2022 low at 13791 (December 20). The breakdown of this level could open the door to a visit to the key 200-day SMA at 13605 before the November 2022 low at 13022 (November 3) and the minor support at 12548 (October 21 2022). On the flip side, the next up barrier still emerges at the 2023 peak at 15262 (January 17) ahead of the 2022 high at 16285 (January 5). The daily RSI retreated further and approached the 62 yardstick.
Best Performers: Daimler Truck Holdings, RWE AG, Zalando SE
Worst Performers: Fresenius Medical Care AG, Fresenius SE & Co, Siemens Healthineers AG
Resistance levels: 15147 15269 15542 (4H chart)
Support levels: 14969 14906 14794 (4H chart)
NASDAQ
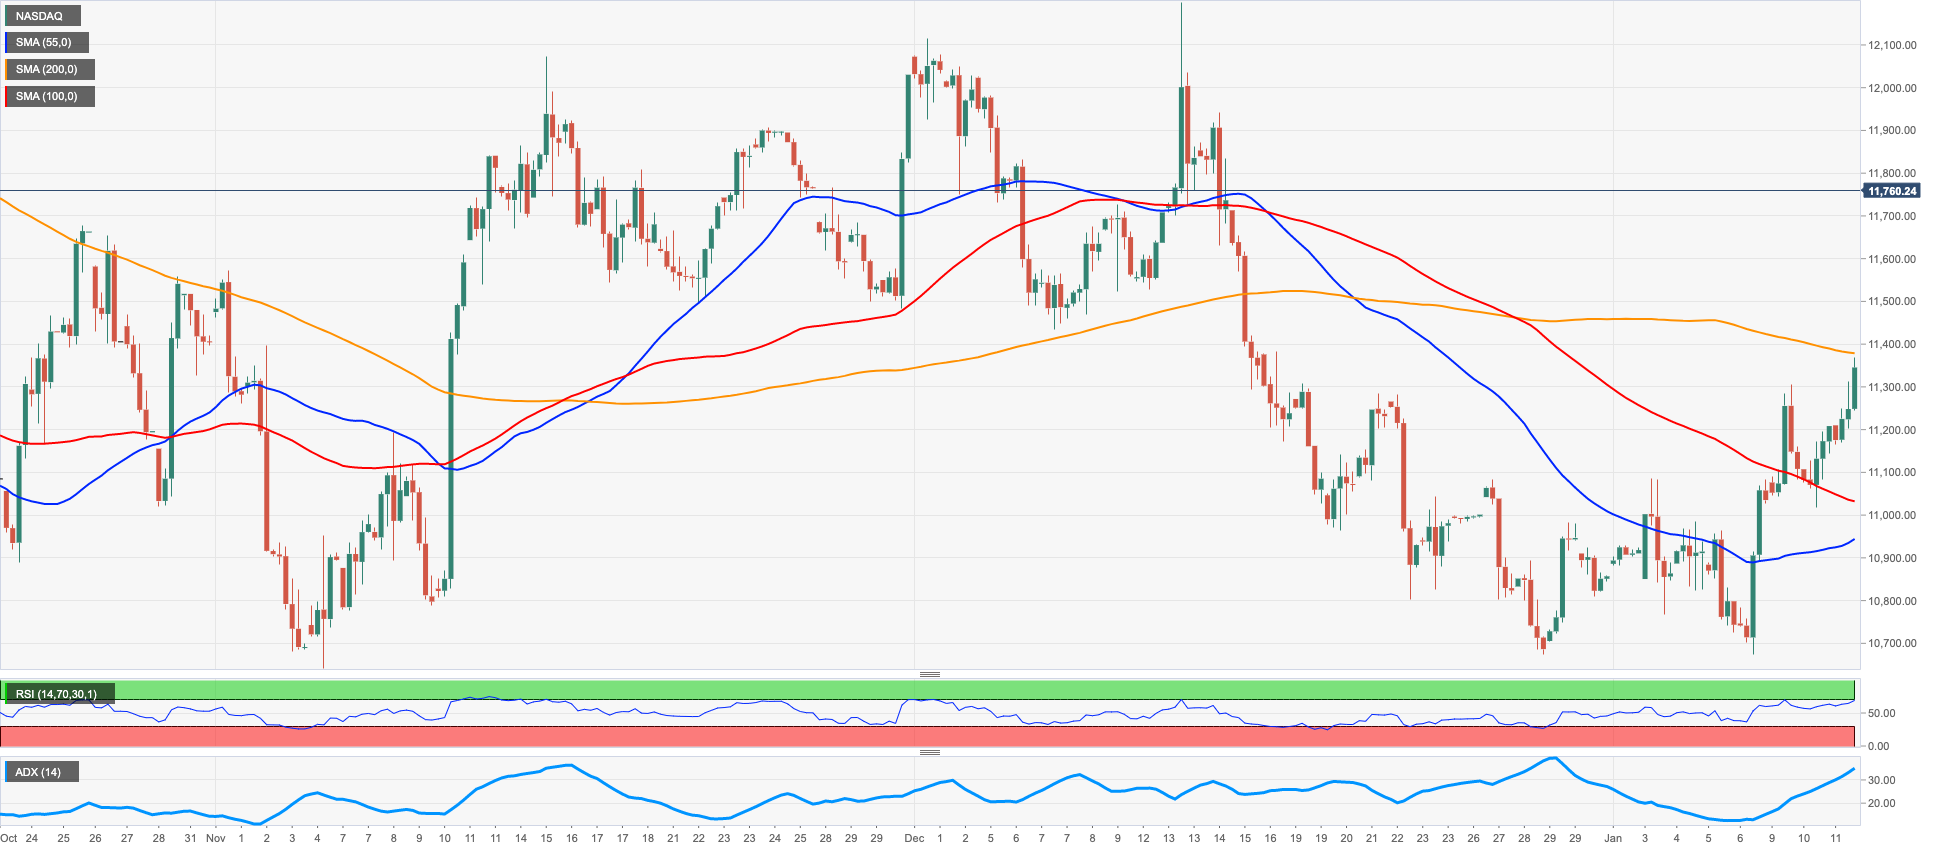
The Nasdaq 100 was no exception and navigated a “sea of red” along the rest of its US peers on Wednesday.
In fact, concerns over a probable economic slowdown remained on the rise following discouraging corporate results from Microsoft, which at the same time had a negative impact on the rest of the tech sector.
The daily decline in the tech-reference index found no respite event with the renewed weakness in the dollar and the corrective downtick in US yields across the curve.
Despite the retracement, the index remains en route to close the fourth consecutive week with gains and manages to keep business above the key 200-week SMA (11564).
The continuation of the upside momentum in the Nasdaq 100 is predicted to retest the 2023 peak at 11918 (January 23) ahead of the key 200-day SMA at 12022 and the December 2022 high at 12166 (December 13). Extra gains from here could retest the September 2022 top at 12752 (September 12). In the opposite direction, the 100- and 55-day SMAs at 11450 and 11418 are seen offering temporary contention followed by the weekly low at 11251 (January 19) and the January low at 10696 (January 6). A deeper decline could put the December 2022 low at 10671 (December 22) to the test prior to the November 2022 low at 10632 (November 4) and the 2022 low at 10440 (October 13). The daily RSI deflated to the sub-60 area.
Top Gainers: eBay, Warner Bros Discovery Inc, Lucid Group
Top Losers: Datadog, ADP, Intuitive Surgical
Resistance levels: 11918 12166 12752 (4H chart)
Support levels: 11454 11251 10696 (4H chart)
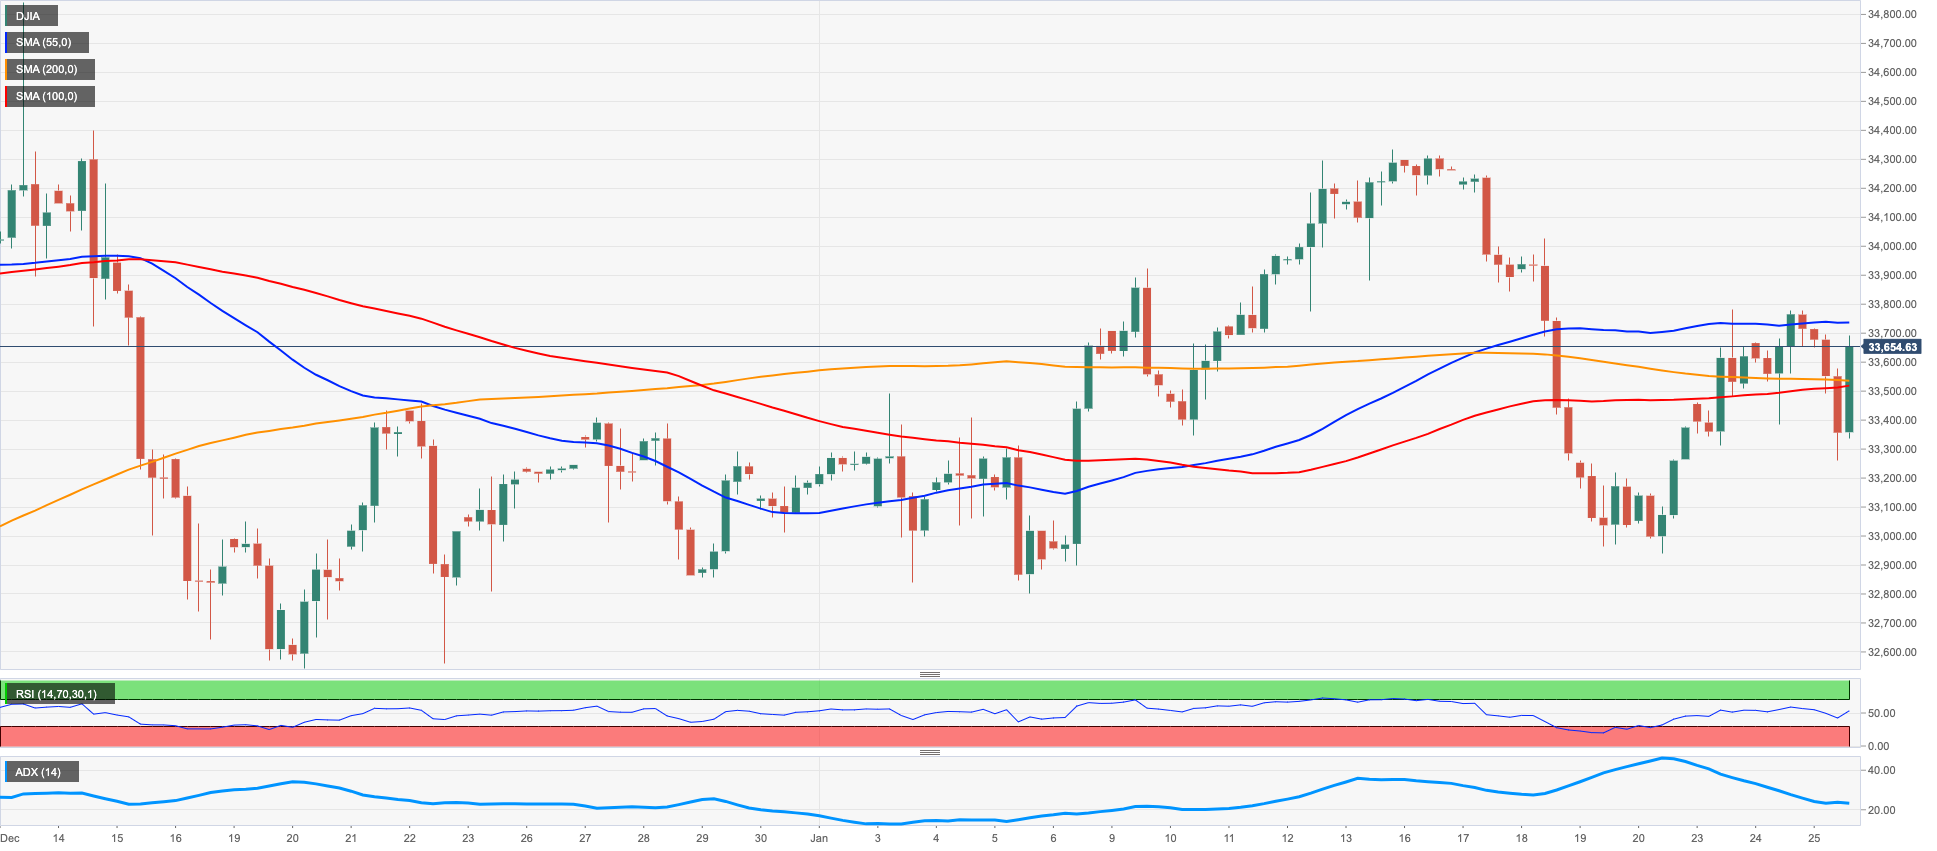
DOW JONES
Stocks tracked by the Dow Jones reversed three consecutive daily advances on Wednesday, as investors’ sentiment soured in response to disappointing quarterly results from giant Microsoft and Boeing, dragging the rest of the US markets back to the negative territory.
In addition, recession fears remained well in place for yet another session amidst rising cautiousness ahead of key releases later in the week (Q4 GDP, PCE) and the FOMC event due next week, where investors have already priced in a 25 bps rate hike by the Fed.
All in all, the Dow Jones dropped 0.25% to 33650, the S&P500 retreated 0.47% to 3998 and the tech-heavy Nasdaq Composite deflated 1.01% to 11219.
Immediately to the downside for the Dow Jones appears the weekly low at 32948 (January 20) followed by the December 2022 low at 32573 (December 22) and the key 200-day SMA at 32354. The loss of this region could prompt the November 2022 low at 31727 (November 3) to re-emerge on the horizon ahead of the minor support at 30206 (October 21 2022) and the 2022 low at 28660 (October 13). By contrast, the breakout of the weekly top at 33782 (January 23) could put a potential test of the 2023 top at 34342 (January 13) back on the investors’ radar prior to the December 2022 high at 34712 (December 13) and the April 2022 top at 35492. North from here comes the February 2022 high at 35824 (February 9). The daily RSI bounced past the 54 level.
Top Performers: McDonald’s, Merck&Co, J&J
Worst Performers: Chevron, 3M, Apple
Resistance levels: 33782 34342 34712 (4H chart)
Support levels: 32948 32573 32230 (4H chart)
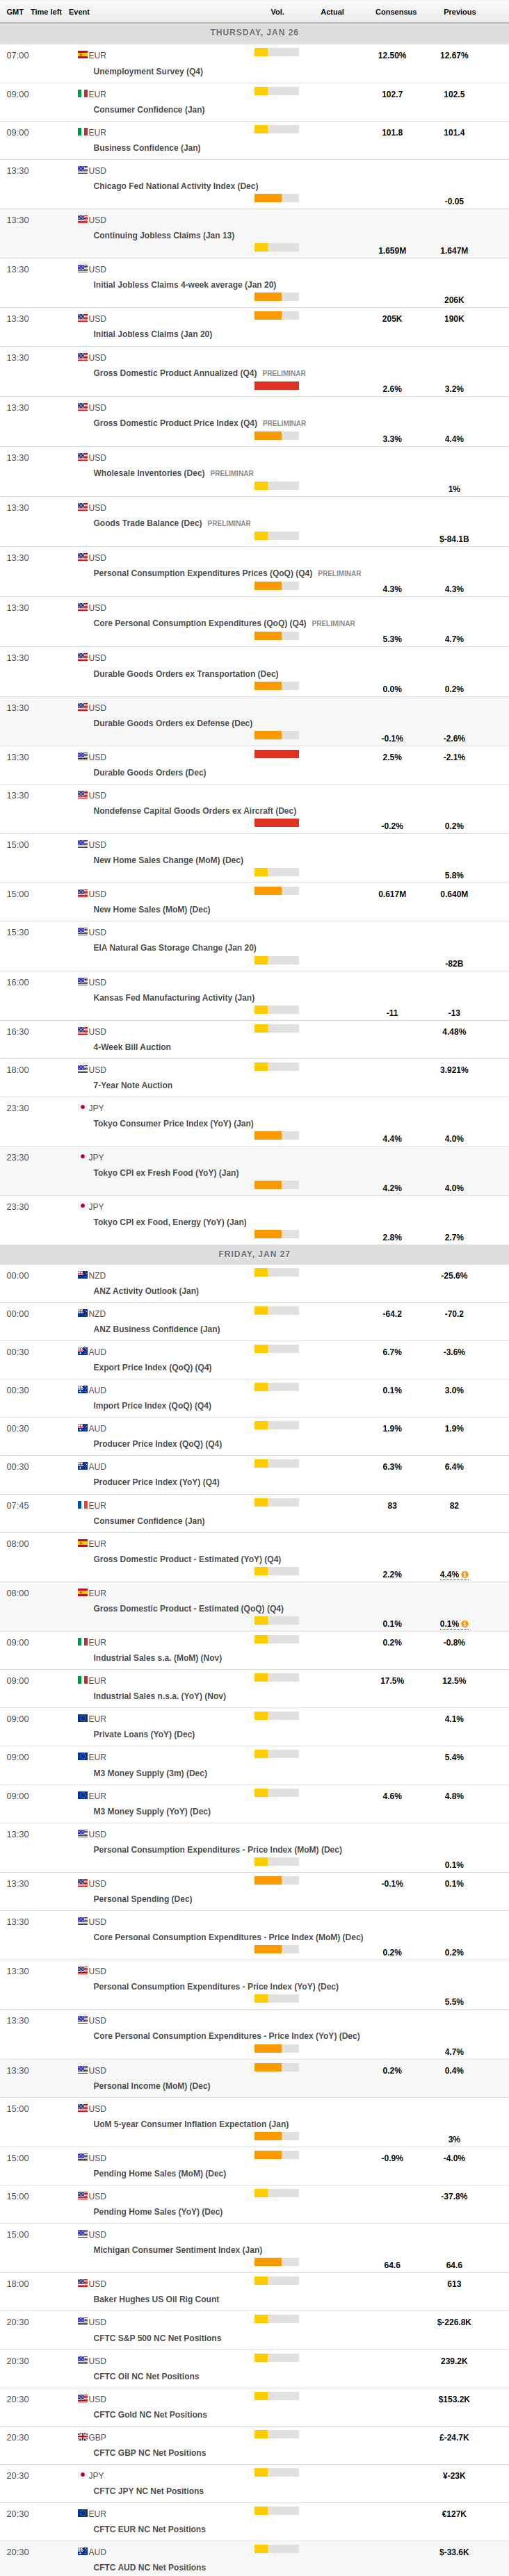
MACROECONOMIC EVENTS
All Information & Updates provided by:

All information relating to the financial markets available on this page has been prepared and issued by FXStreet (Forexstreet SL, Spain, Reg: B62498233) on the basis of publicly available information and all information believed to be reliable and does not conflict with Kuwaiti local laws, and all necessary care has been taken to before the company to ensure that the facts mentioned are correct from the source.
NCM Investment nor any of its directors or employees shall in any way be held responsible for the contents of this news, and the information contained on this page is intended only to provide clients with publicly available information and should not be construed as investment advice, report or analysis and/or constitute an offer or invitation to buy or sell financial instruments of any kind.
RISK WARNING: Forex and CFDs are highly risky leveraged products, as losses can exceed deposits. Please ensure you understand all the risks and take independent advice if necessary. NCM will segregate the clients based on the criteria of the regulator and its bylaws. NCM does not provide any advisory service; the material published does not constitute advice or a recommendation for a transaction in any financial instrument. NCM accepts no responsibility for any use of the content presented and any consequences of that use. Anyone acting on the information provided does so at their own risk.