
- Contact Us:
-

-

-

-


Daily Market Updates
27 Jan 2023
USDJPY
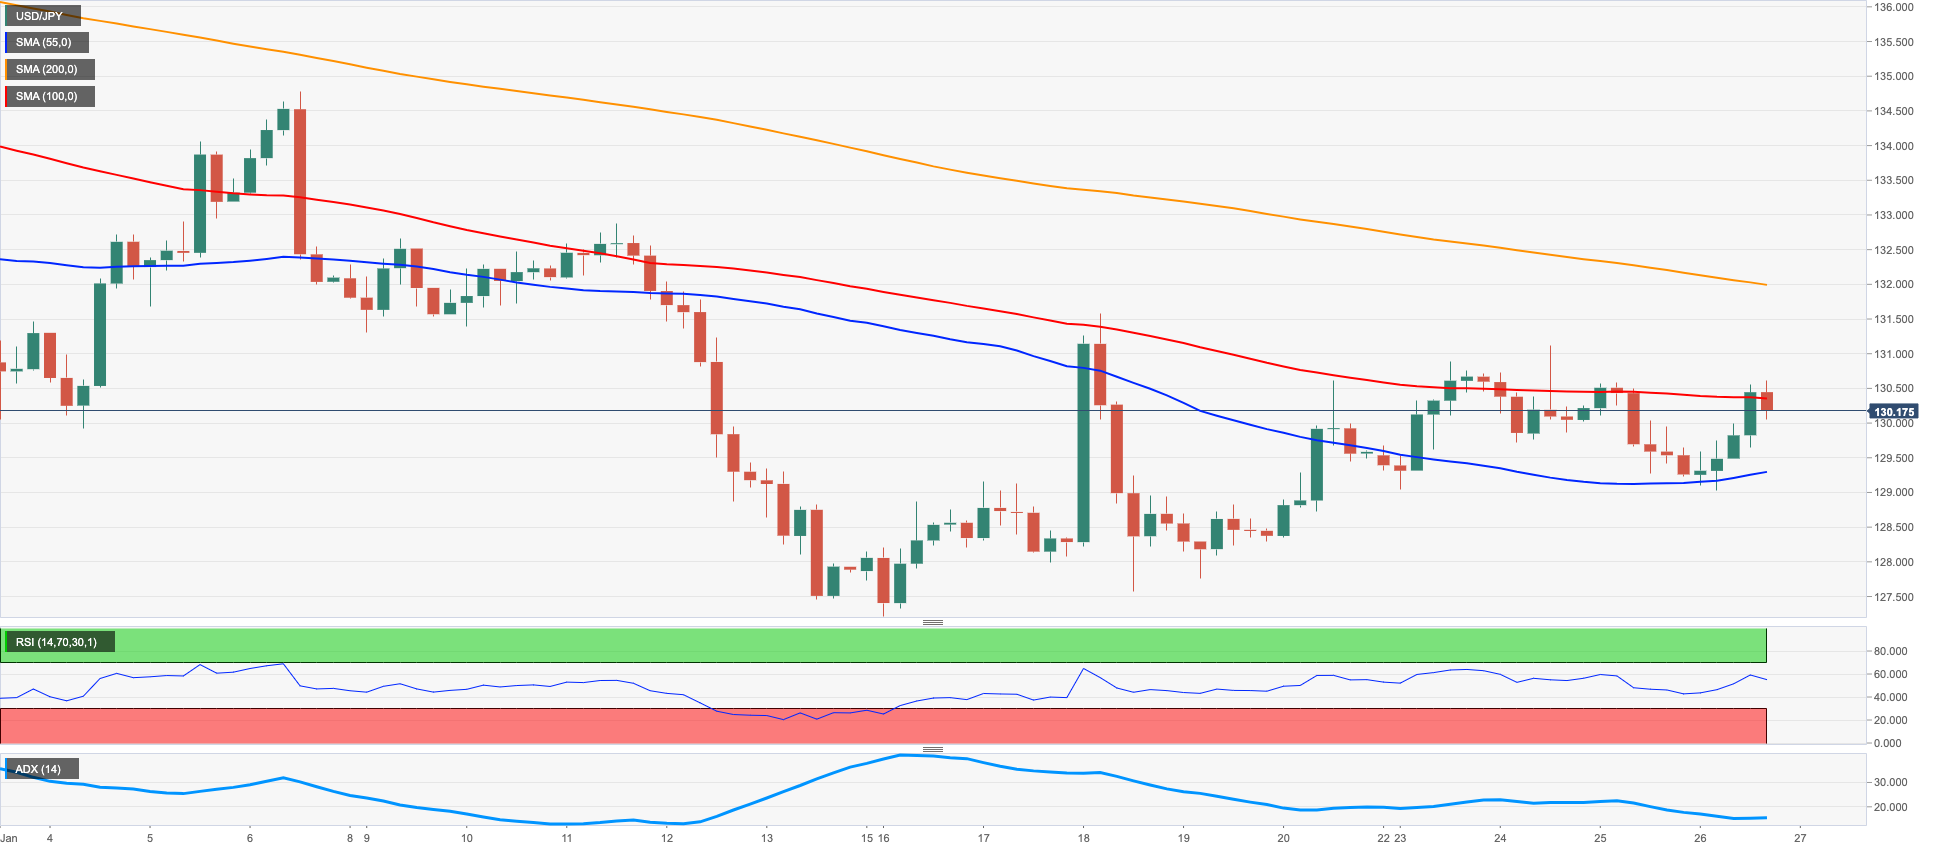
USD/JPY regained poise and reversed two consecutive sessions with losses on Thursday, this time managing to reclaim the area above the 130.00 barrier amidst the change of direction in the dollar and higher US yields.
On the latter, US yields rebounded and set aside part of the recent weakness, although they kept the trade within the broader consolidative theme against the backdrop of investors’ rising cautiousness ahead of the FOMC event on February 1.
On another front, and earlier in the session, Japan’s PM Kishida noted the government will work closely with the BoJ to manage the policy actively.
In the calendar, and according to the BoJ Summary of Opinions, it is reasonable to maintain the current monetary policy stance as well as the Yield Curve Control (YCC) strategy, although a policy review at some point was also suggested. In addition, inflation is seen losing traction in the second half of the next fiscal year.
Additionally, Foreign Bond Investment shrank to ¥344.2B in the week to January 21.
Next on the upside for USD/JPY aligns the weekly peak at 131.11 (January 24) prior to another weekly high at 131.57 (January 20). The surpass of this level could open the door to the 2023 top at 134.77 (January 6) ahead of the key 200-day SMA at 136.73. Once this region is cleared, the pair could challenge weekly peaks at 138.17 (December 15 2022) and 139.89 (November 30 2022) before the round level at 140.00. Inversely, there are no support levels of relevance until the January low at 127.21 (January 16) ahead of the May 2022 low at 126.36 (May 24) and the weekly low at 121.27 (March 31 2022). The daily RSI gathered steam and flirted with the 45 zone.
Resistance levels: 131.11 131.57 132.11 (4H chart)
Support levels: 129.02 127.56 127.21 (4H chart)
GBPUSD
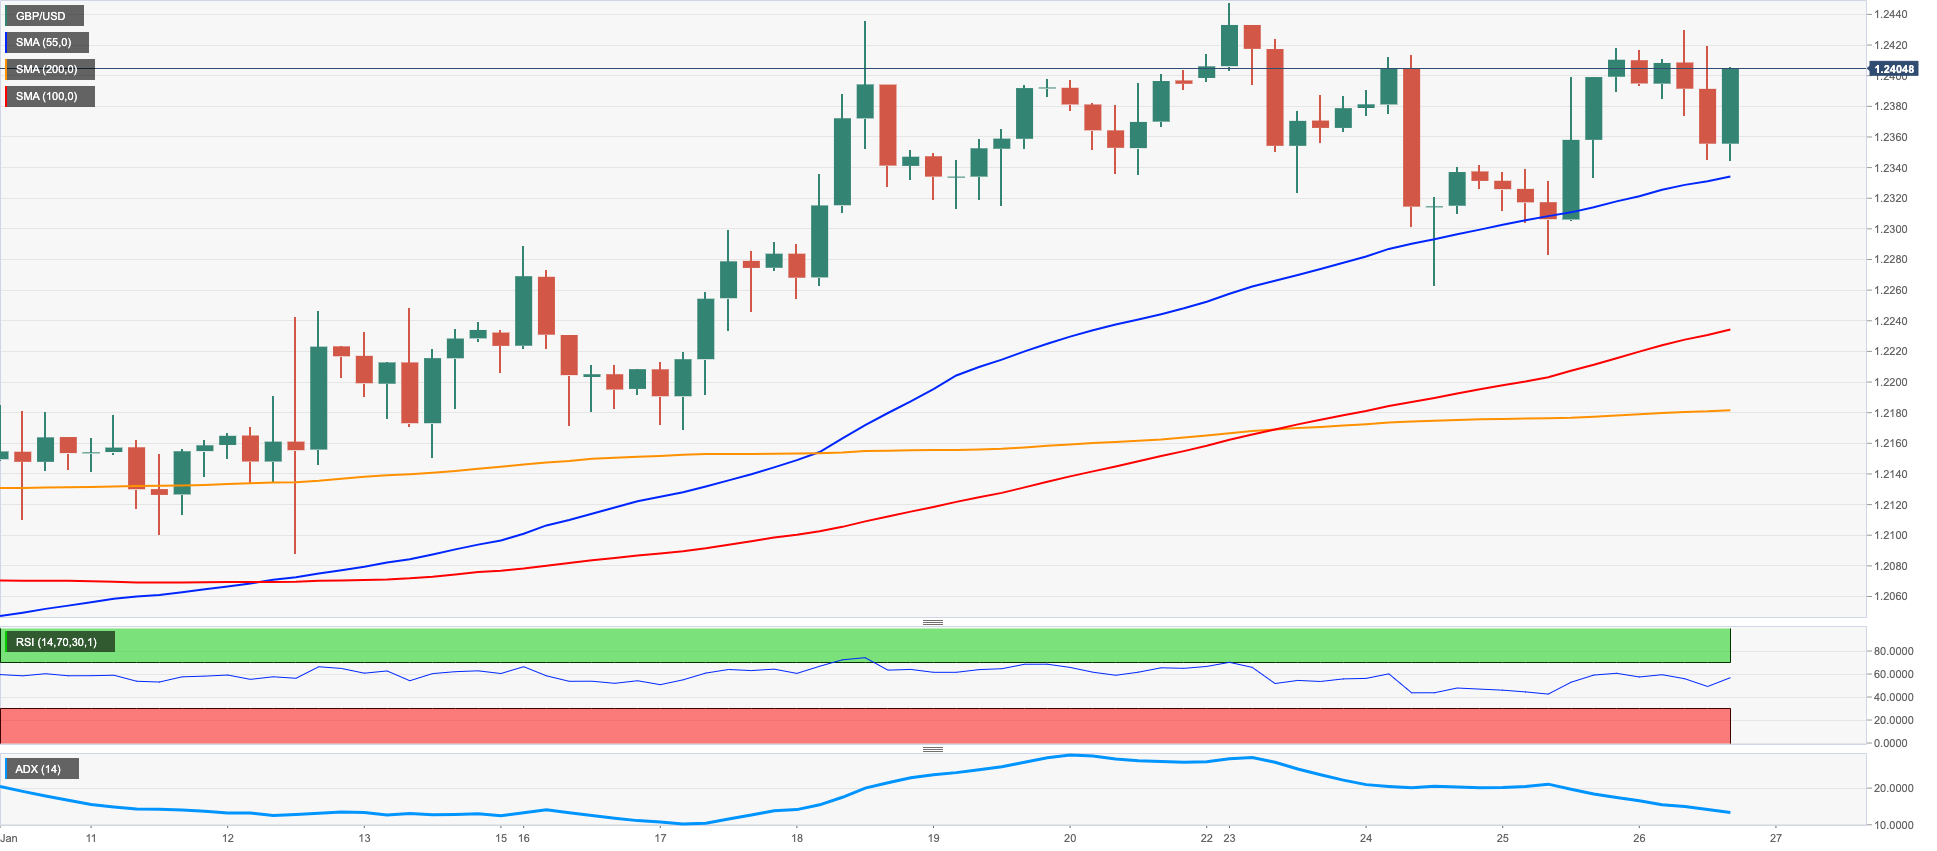
GBP/USD alternated gains with losses around the 1.2400 neighbourhood on Thursday following decent gains seen in the previous session.
The late bounce in the greenback left cable empty-handed after the pair failed to sustain the earlier bull run to 3-day highs around 1.2430, always against the backdrop of the multi-day range-bound theme in the global markets and alternating risk appetite trends.
In the UK, Car Production shrank 17.9% in the year to December, while final Labour Productivity expanded 0.1% QoQ in the July-September period and the CBI Distributive Trades worsened to -23 for the current month.
Bulls continue to target the 2023 top at 1.2447 (January 23) ahead of the May 2022 peak at 1.2666 (May 27) and the key 200-week SMA at 1.2906. If GBP/USD manages to clear this level, then the attention should shift to the psychological 1.3000 mark. Contrarily, the weekly low at 1.2263 (January 24) should offer initial contention ahead of the provisional 55-day SMA at 1.2122 and the weekly low at 1.2084 (January 12). The breach of the latter exposes the round level at 1.2000 prior to the key 200-day SMA at 1.1962 and the January low at 1.1841 (January 6). The daily RSI eased marginally to the proximity of 62
Resistance levels: 1.2430 1.2447 1.2558 (4H chart)
Support levels: 1.2321 1.2282 1.2263 (4H chart)
AUDUSD
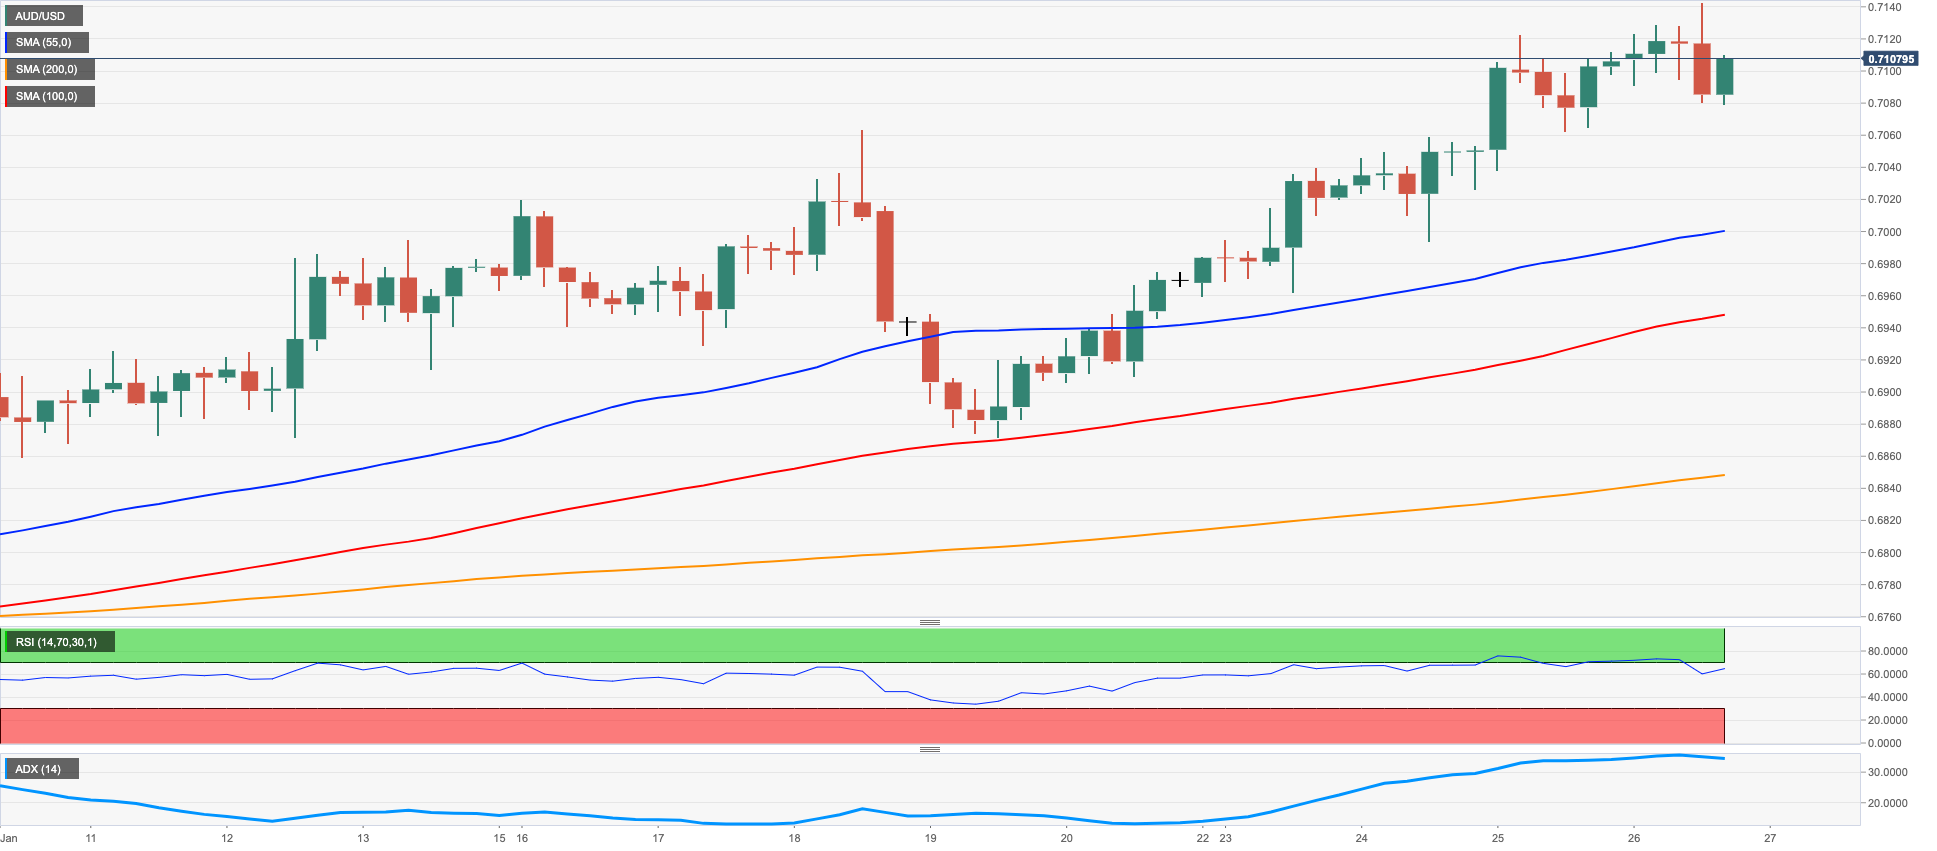
The strong bounce in the dollar faded part of the intense optimism around AUD/USD on Thursday. Indeed, spot halted a 4-session positive streak, coming under increasing downside pressure following an earlier climb to fresh highs past 0.7140, an area last seen in early June 2022.
Despite the strong advance in the greenback, the generalized upbeat tone in the commodity complex and recent higher-than-estimated inflation figures Down Under appear to have limited occasional losses in the Aussie dollar.
No data releases in Oz on Thursday left the attention to Friday’s release of Export/Import Prices and Producer Prices, all during the October-December period.
If AUD/USD breaks above the 2023 peak at 0.7128 (January 26) it could then quickly visit the August 2022 high at 0.7136 (August 11) prior to the June 2022 top at 0.7282 (June 3) and the round level at 0.7300. Conversely, there is an initial contention at the weekly low at 0.6871 (January 19) just ahead of the key 200-day SMA at 0.6811. The breach of this region could put the temporary 55-day SMA at 0.6798 to the test prior to the January low at 0.6688 (January 3) and the December low at 0.6629 (December 20). Down from here turns up weekly lows at 0.6584 (November 21) and 0.6386 (November 10). The daily RSI flirted with the overbought territory past 69.
Resistance levels: 0.7128 0.7136 0.7226 (4H chart)
Support levels: 0.7061 0.6993 0.6962 (4H chart)
GOLD
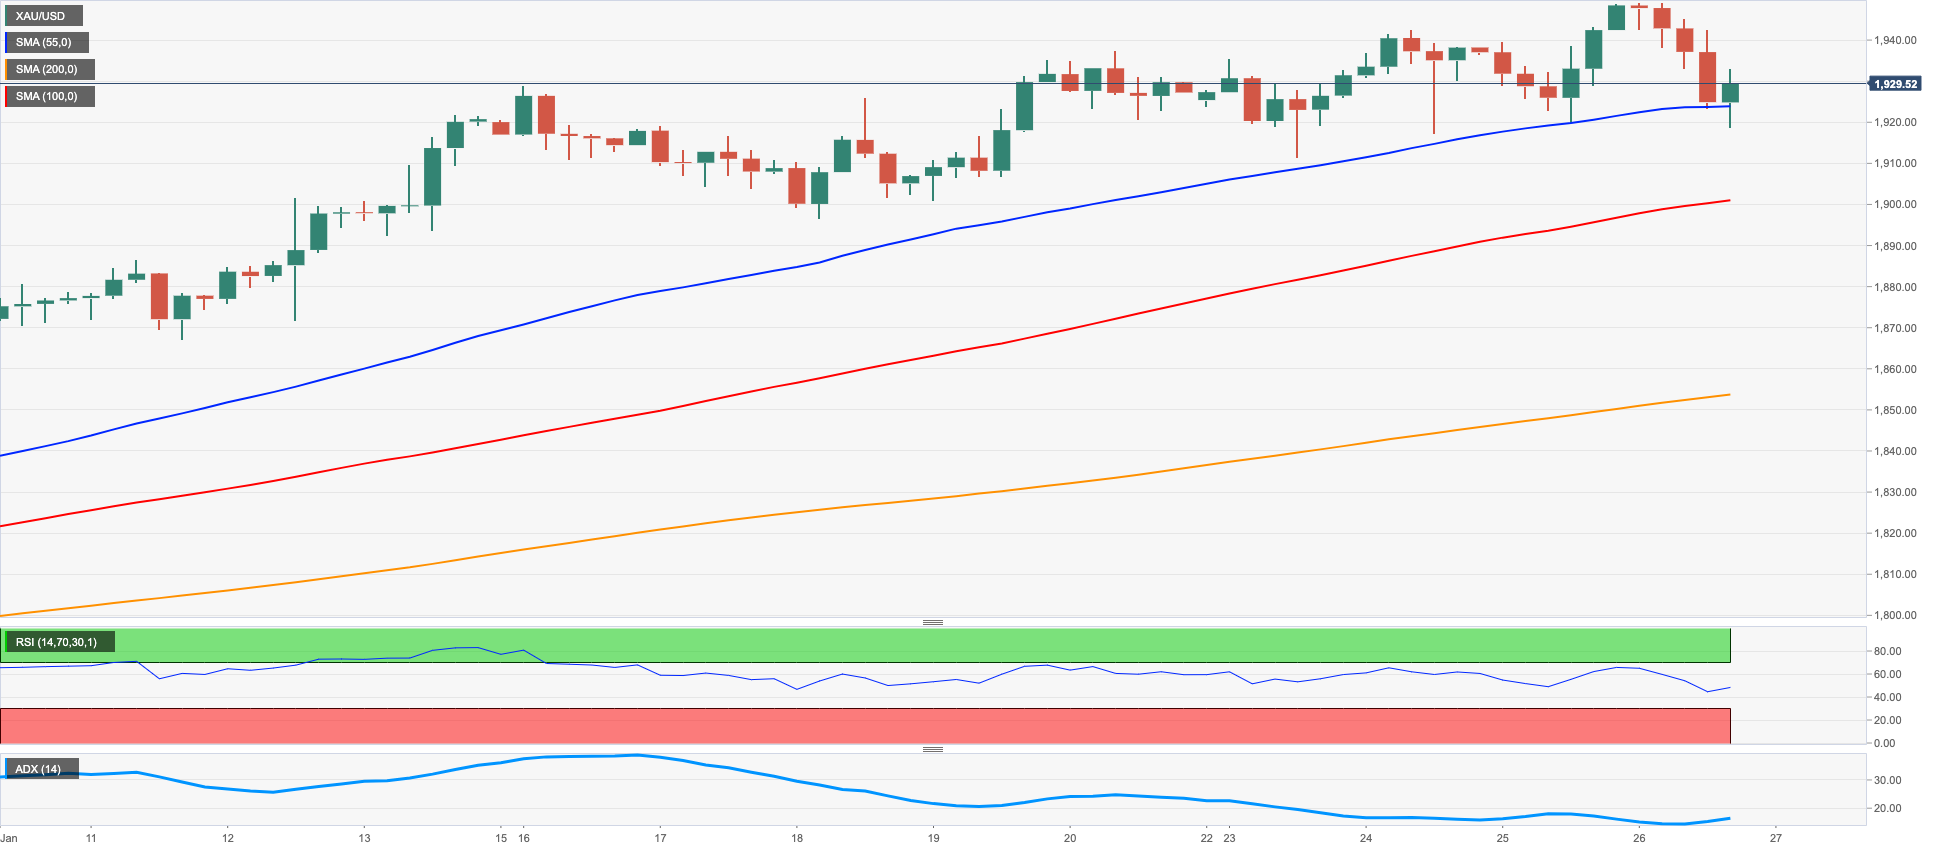
After hitting fresh 2023 highs around $1950 per ounce troy, the precious metal sparked a corrective decline that has so far met some initial support near $1920 on Thursday.
The daily downtick in bullion came exclusively in response to the data-led rebound in the greenback, especially after flash Q4 GDP figures and Durable Goods Orders came on the strong side earlier in the US docket.
Also collaborating with the bearish move in the yellow metal appeared a decent-enough bounce in US yields across the curve, which somewhat managed to leave behind the last couple of sessions in the red territory.
Moving forward, the yearly rally in bullion would be surely put to the test in the upcoming days in light of the FOMC and ECB interest rate decisions, both due in the next week.
Gold charted a new YTD high at $1949 (January 26) and the breakout of this level should put a potential test of the April 2022 top at $1998 (April 18) back on the radar closely followed by the psychological $2000 mark and the 2022 peak at $2070 (March 8). On the opposite side, minor contention levels appear at weekly lows at $1896 (January 18) and $1867 (January 11) prior to the provisional 55-day SMA at $1817. South from here emerges the more relevant 200-day SMA at $1776 seconded by the 100-day SMA at $1751 and the weekly low at $1727 (November 23).
Resistance levels: $1949 $1955 $1982 (4H chart)
Support levels: $1917 $1896 $1867 (4H chart)
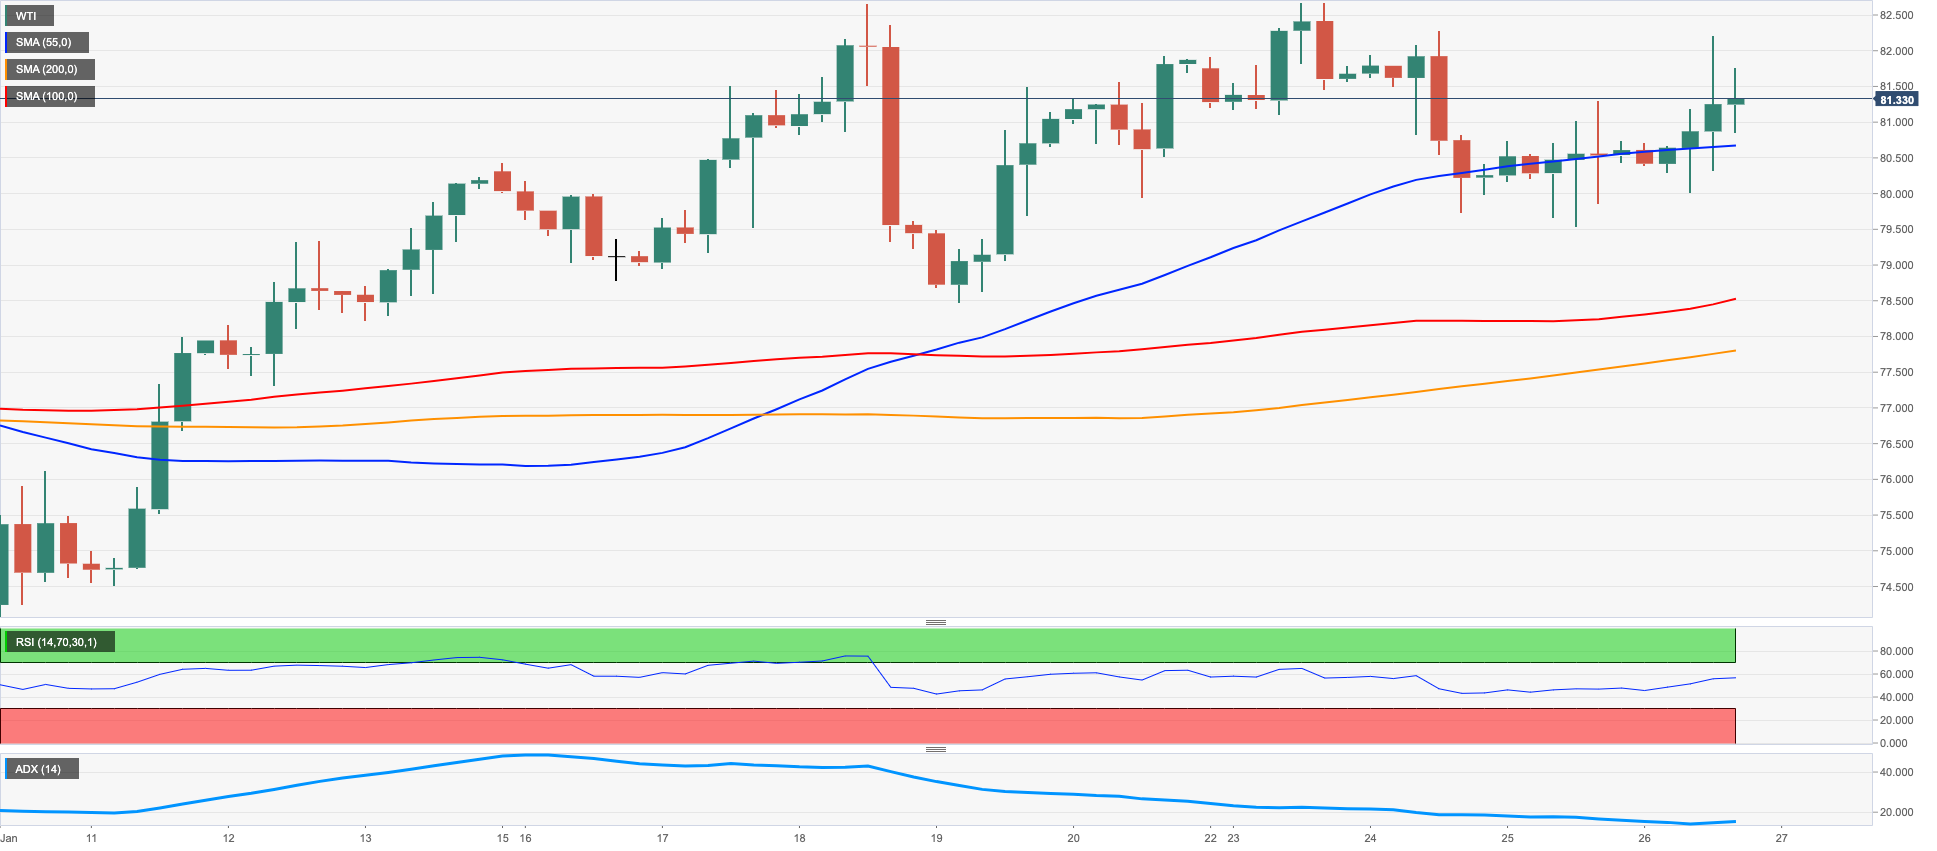
CRUDE WTI
Prices of the American benchmark for the sweet light crude oil added to Wednesday’s recovery, although they faltered once again just above the $82.00 mark per barrel, an area coincident with the 100-day SMA, on Thursday.
The better mood around the commodity remained underpinned by prospects for increasing demand stemming from the Chinese reopening, while solid prints from the US GDP also added to the upbeat sentiment among traders on Thursday.
In the meantime, the OPEC+ meeting on February 1 is expected to leave the status quo unchanged regarding the current oil output.
Immediately to the upside for WTI appears the yearly peak at $82.60 (January 23) just before the December 2022 high at $83.32 (December 1) and followed by the $90.08 level (November 11 2022). The surpass of this level could prompt the 200-day SMA at $92.41 to emerge on the horizon ahead of the November 2022 high at $93.73 and the weekly top at $97.65 (August 30 2022). The continuation of the uptrend could revisit the key $100.00 mark per barrel. On the other hand, further weakness is seen on a breakdown of the temporary 55-day SMA at $78.71. Extra losses from here are expected to target the January low at $72.50 (January 5) ahead of the 2022 low at $70.10 (December 9) and the key round level at $70.00. Further down comes the weekly low at $66.15 (December 20 2021) prior to the 200-week SMA at $65.72.
Resistance levels: $82.10 $82.60 $83.32 (4H chart)
Support levels: $79.42 $78.08 $77.16 (4H chart)
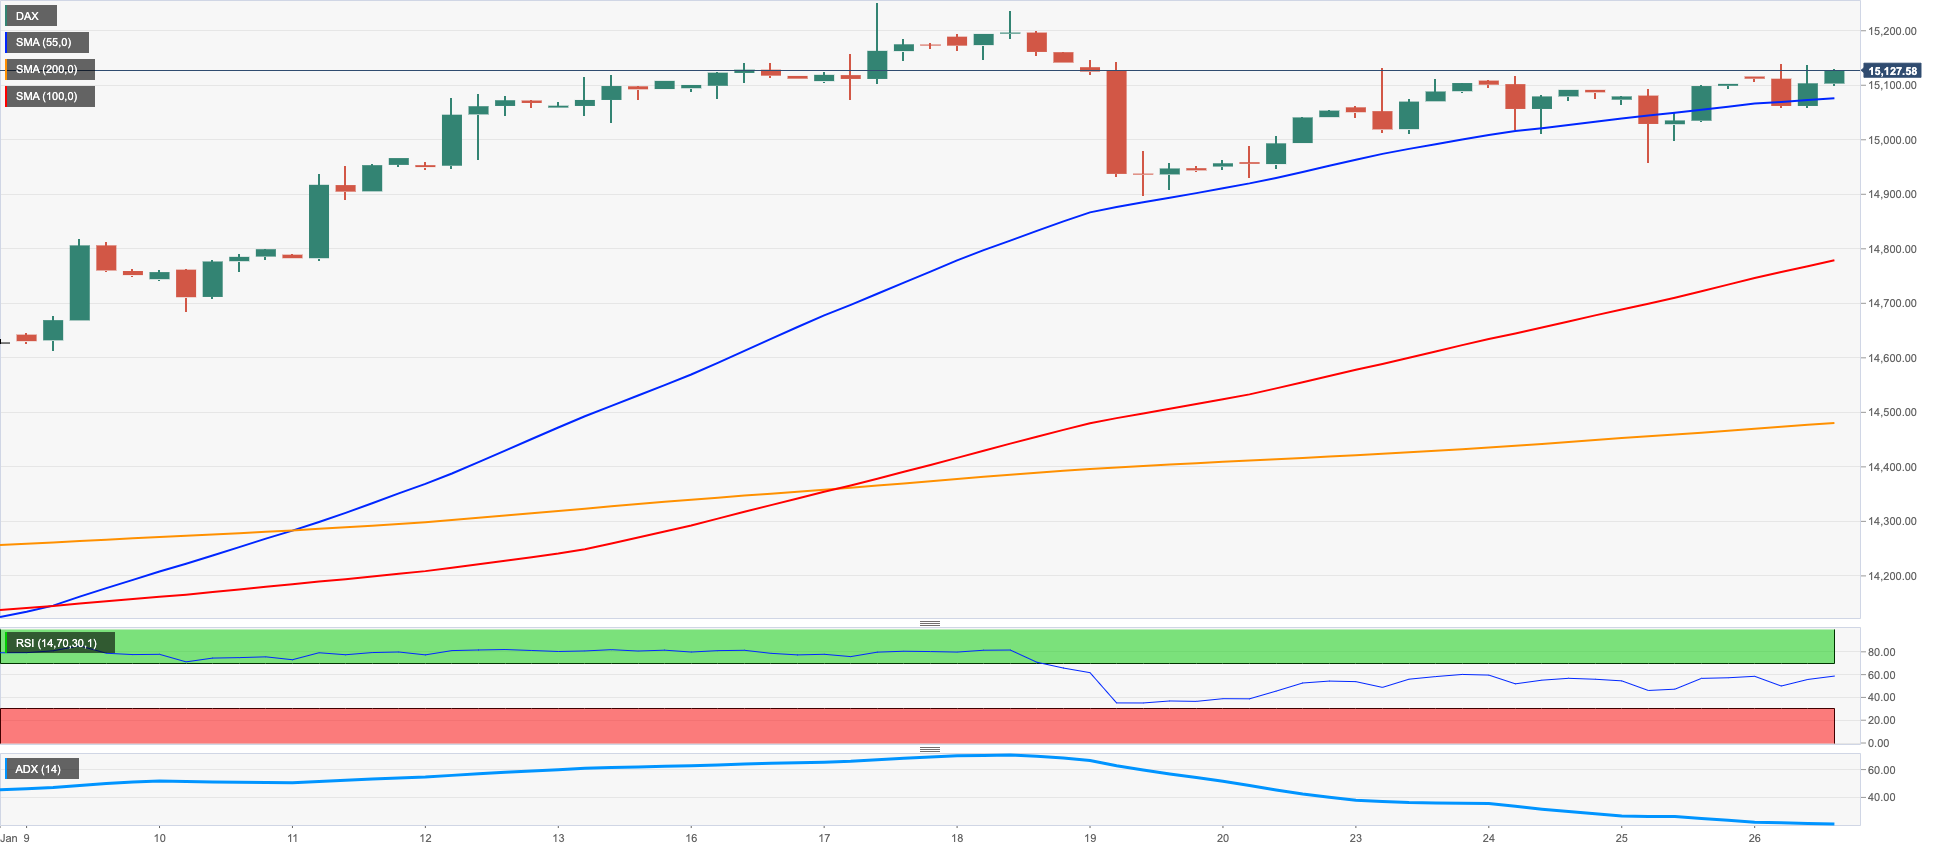
GER40
The German benchmark DAX 40 resumed the upside after two consecutive daily losses on Thursday.
Indeed, the generalized positive sentiment in the European stocks markets followed an equally positive session in the Asian trading hours, while the solid performance by STV Microelectronics and telecoms giant Nokia also underpinned the optimism among market participants.
There were no data releases in Germany on Thursday, although recent firm prints from the Ifo Institute (Wednesday) and the improvement in the Consumer Confidence gauged by Gfk (Tuesday) also help leaving behind the recent weakness.
From the domestic backyard, German Economy minister Habeck suggested that inflation remains elevated at the beginning of 2023 and suggested the need for further containment during this year.
The uptick in the German index came in tandem with the recovery in the 10-year Bund yields, this time surpassing the 2.20% yardstick.
The continuation of the uptrend in the DAX 40 remains focused on the 2023 high at 15262 (January 17) prior to the round level at 16000 and the 2022 top at 16285 (January 5). By contrast, initial contention is seen at the weekly low at 14906 (January 19) before the interim 55-day SMA at 14460 and the December 2022 low at 13791 (December 20). Once the index clears this region it could then confront the key 200-day SMA at 13609 ahead of the November 2022 low at 13022 (November 3) and the minor support at 12548 (October 21 2022). The daily RSI advanced marginally beyond the 66 level.
Best Performers: Sartorius AG VZO, Infineon, Zalando SE
Worst Performers: Fresenius SE, RWE AG ST, Vonovia
Resistance levels: 15151 15269 15542 (4H chart)
Support levels: 14969 14906 14874 (4H chart)
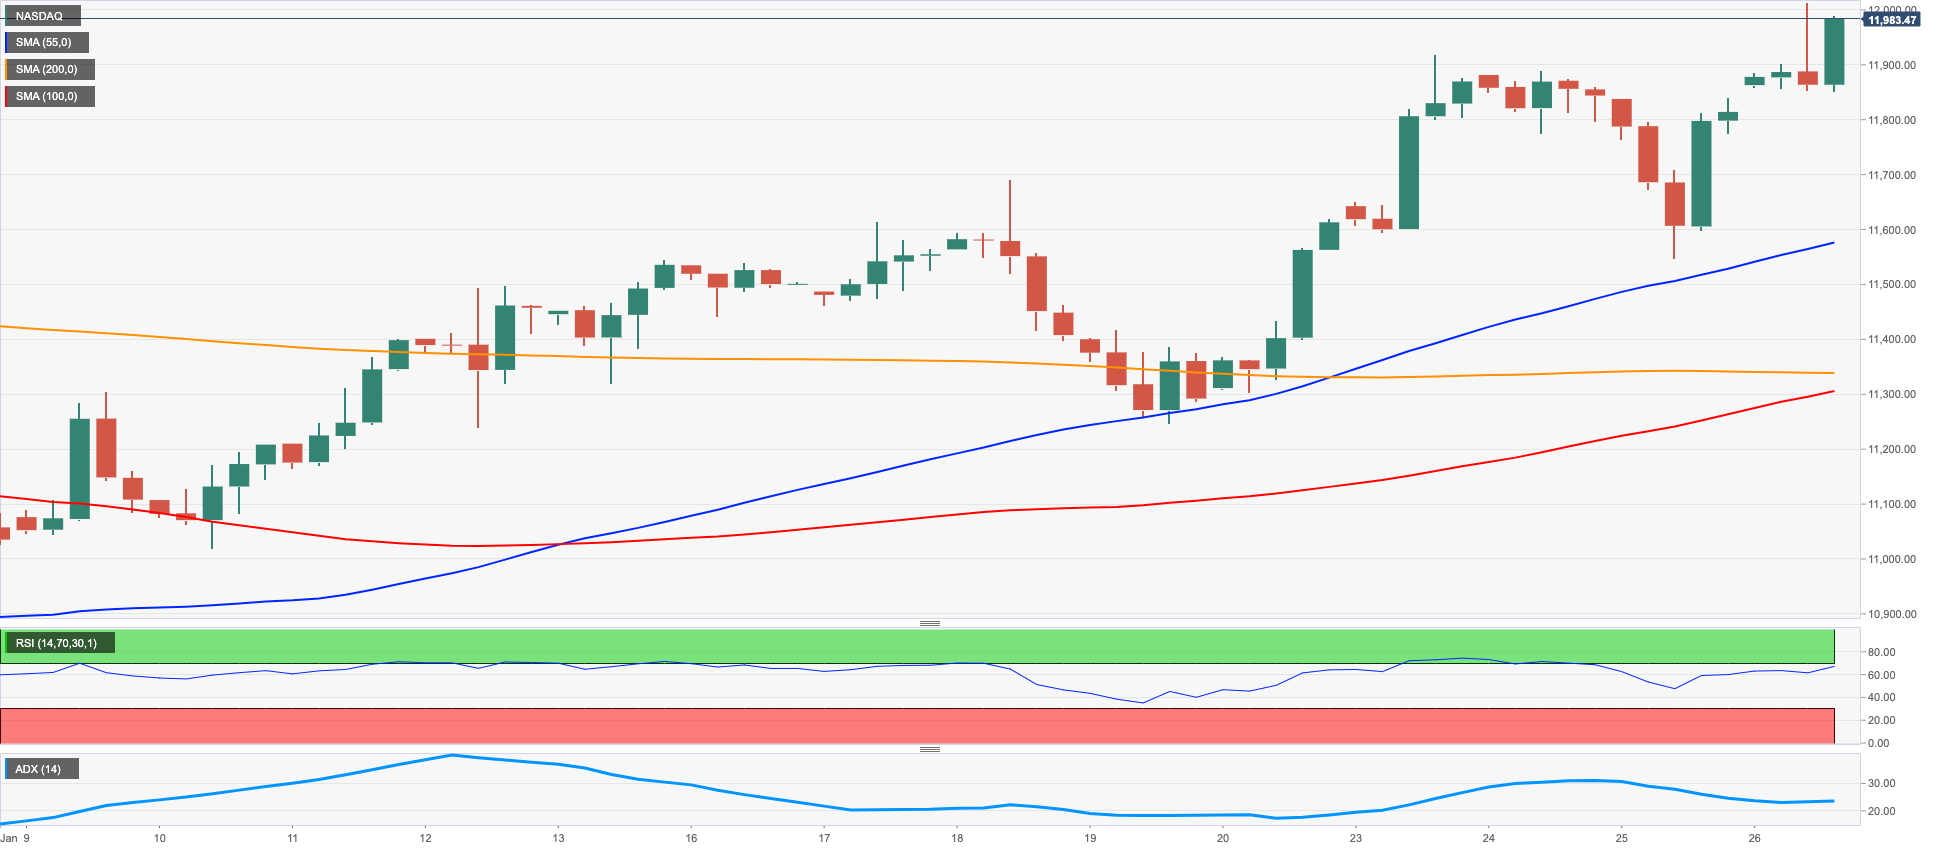
NASDAQ
Tech equities measured by the Nasdaq 100 traded on a positive tone and surpassed the key 12000 mark for the first time since mid-December 2022 on Thursday.
The tech reference index picked up extra pace almost exclusively in response to the outstanding performance of electric-car maker Tesla after it topped earnings and sales estimates, while E.Musk predicted an increase of sales this year.
Extra oxygen for the tech sector came after the US docket saw the economy expand more than expected in the October-December period, although at a slower pace than the previous quarter, showing at the same time that the Fed’s tightening process is having a decelerating effect on the economy.
The Nasdaq 100 printed a new 2023 high at 12018, where the 200-day SMA also sits. Beyond this region emerges the December 2022 top at 12166 (December 13) followed by the September 2022 peak at 12752 (September 12). On the flip side, the 11440 region, where the 100- and 55-day SMAs converge, appears as an immediate contention zone prior to the weekly low at 11251 (January 19) and the January low at 10696 (January 6). South from here comes the December 2022 low at 10671 (December 22) seconded by the November 2022 low at 10632 (November 4) and the 2022 low at 10440 (October 13). The daily RSI edged higher and trespassed the 65 area.
Top Gainers: Tesla, Pinduoduo, Datadog
Top Losers: CSX, Rivian Automotive, AstraZeneca ADR
Resistance levels: 12018 12166 12752 (4H chart)
Support levels: 11550 11447 11251 (4H chart)
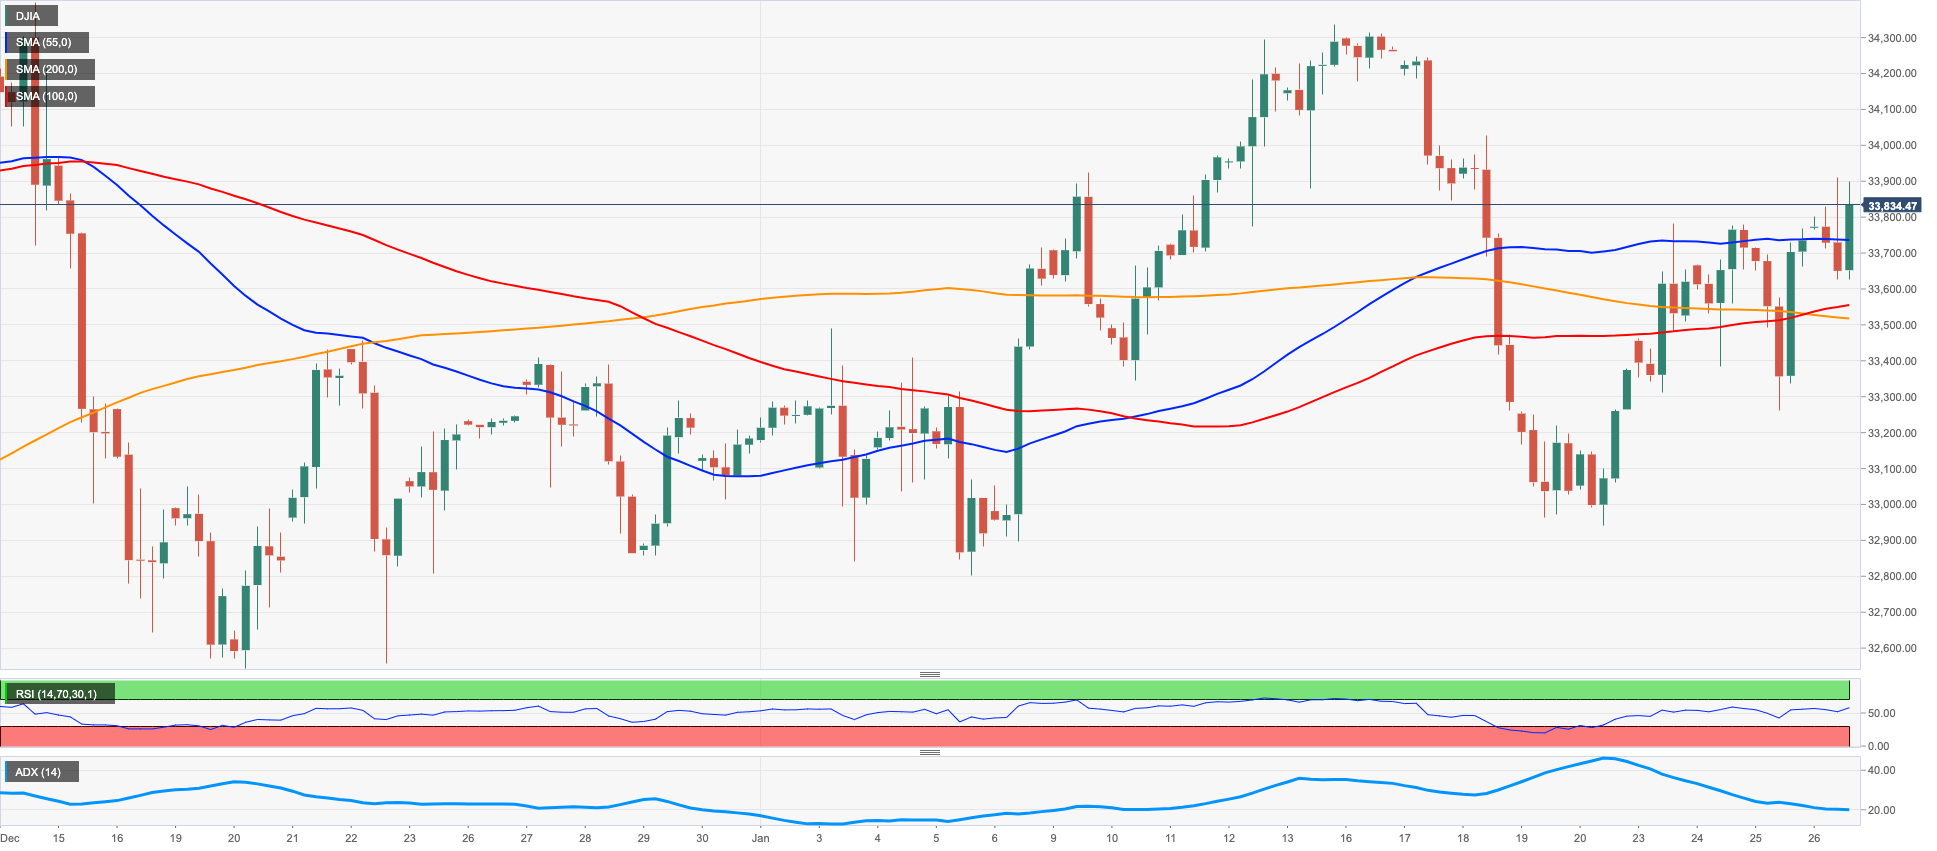
DOW JONES
Equities measured by the Dow Jones added to the ongoing uptrend and charted decent gains near the 34000 mark on Thursday.
Better-than-expected results from the US docket earlier in the session alleviated recession concerns and boosted the optimism among market participants, although equally solid figures from weekly claims were also a reminder of the still tight conditions of the labour market.
Extra support for US stocks came from Tesla’s outperformance, which also lifted spirits on Thursday.
On the whole, the Dow Jones gained 0.24% to 33825, the S&P500 advanced 0.55% to 4038 and the tech-reference Nasdaq Composite rose 0.84% to 11408.
Further upside in the Dow Jones now needs to clear the weekly top at 33921 (January 26) to allow for a probable visit to the 2023 peak at 34342 (January 13) and the December 2022 top at 34712 (December 13). Further up aligns the April 2022 peak at 35492 ahead of the February 2022 high at 35824 (February 9). On the contrary, the 55-day SMA at 33581 offers initial support prior to the weekly low at 32948 (January 20) and the December 2022 low at 32573 (December 22). A drop below the latter exposes the key 200-day SMA at 32350 seconded by the November 2022 low at 31727 (November 3). South from here turns up the minor support at 30206 (October 21 2022) before the 2022 low at 28660 (October 13). The daily RSI rose past the 55 level.
Top Performers: Chevron, Salesforce Inc, Microsoft
Worst Performers: IBM, Merck&Co, American Express
Resistance levels: 33921 34342 34712 (4H chart)
Support levels: 33273 32948 32573 (4H chart)
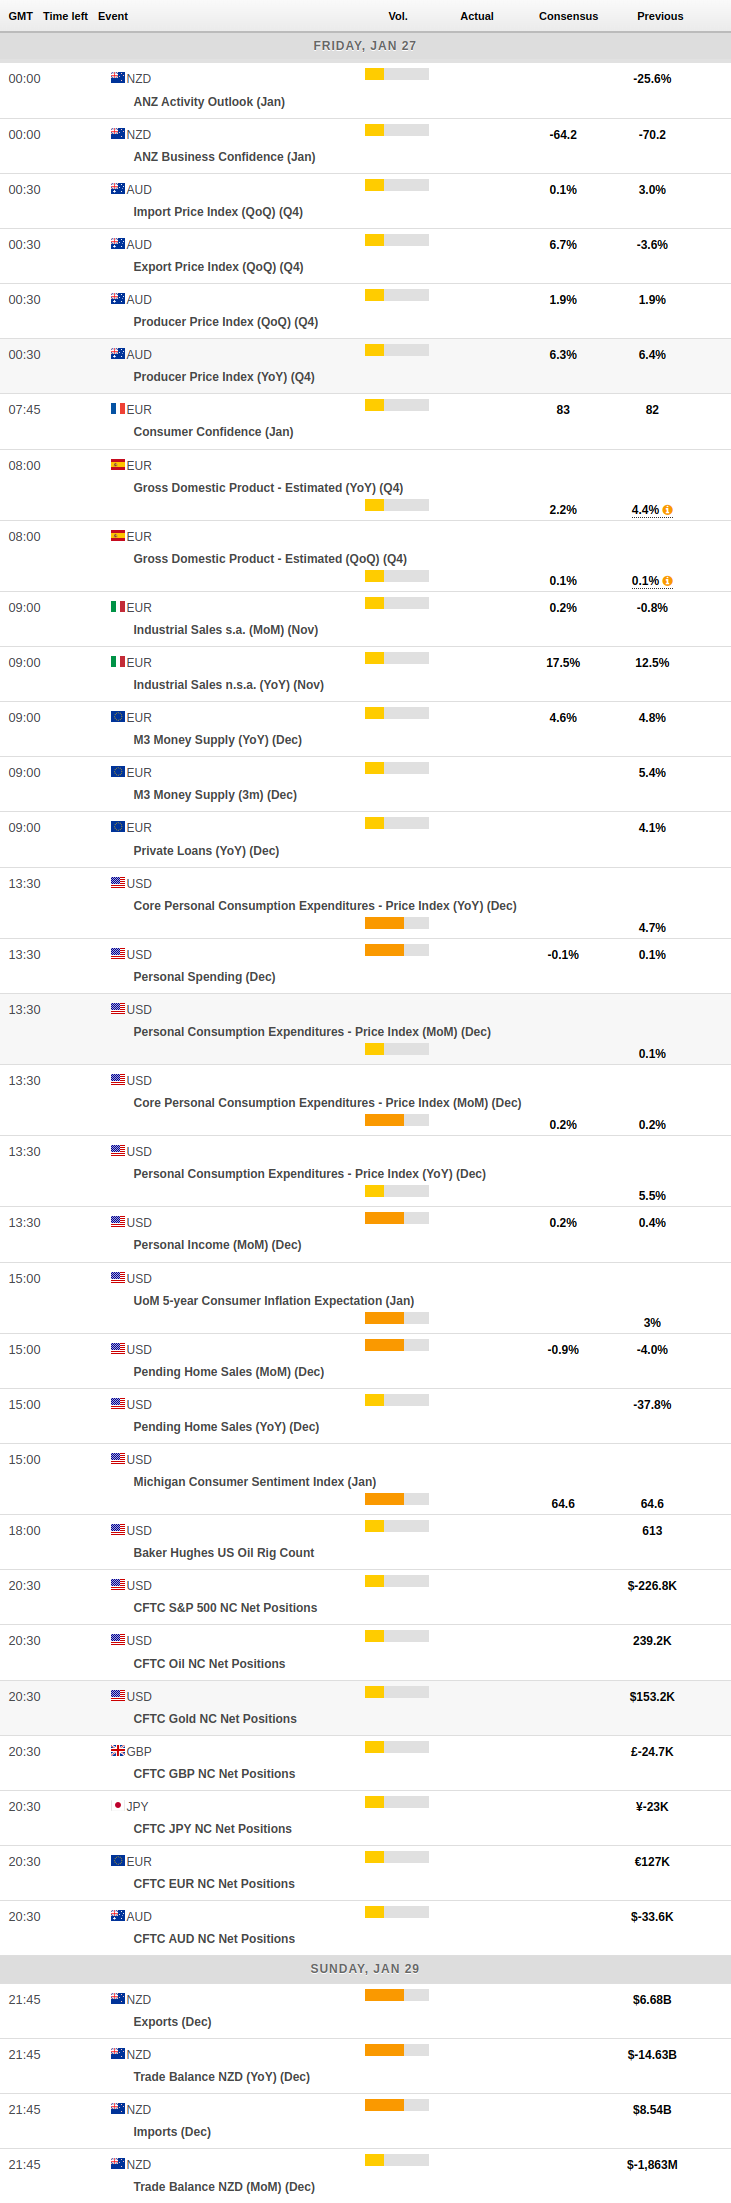
MACROECONOMIC EVENTS
All Information & Updates provided by:

All information relating to the financial markets available on this page has been prepared and issued by FXStreet (Forexstreet SL, Spain, Reg: B62498233) on the basis of publicly available information and all information believed to be reliable and does not conflict with Kuwaiti local laws, and all necessary care has been taken to before the company to ensure that the facts mentioned are correct from the source.
NCM Investment nor any of its directors or employees shall in any way be held responsible for the contents of this news, and the information contained on this page is intended only to provide clients with publicly available information and should not be construed as investment advice, report or analysis and/or constitute an offer or invitation to buy or sell financial instruments of any kind.
RISK WARNING: Forex and CFDs are highly risky leveraged products, as losses can exceed deposits. Please ensure you understand all the risks and take independent advice if necessary. NCM will segregate the clients based on the criteria of the regulator and its bylaws. NCM does not provide any advisory service; the material published does not constitute advice or a recommendation for a transaction in any financial instrument. NCM accepts no responsibility for any use of the content presented and any consequences of that use. Anyone acting on the information provided does so at their own risk.