
- Contact Us:
-

-

-

-


Daily Market Updates
30 Jan 2023
USDJPY
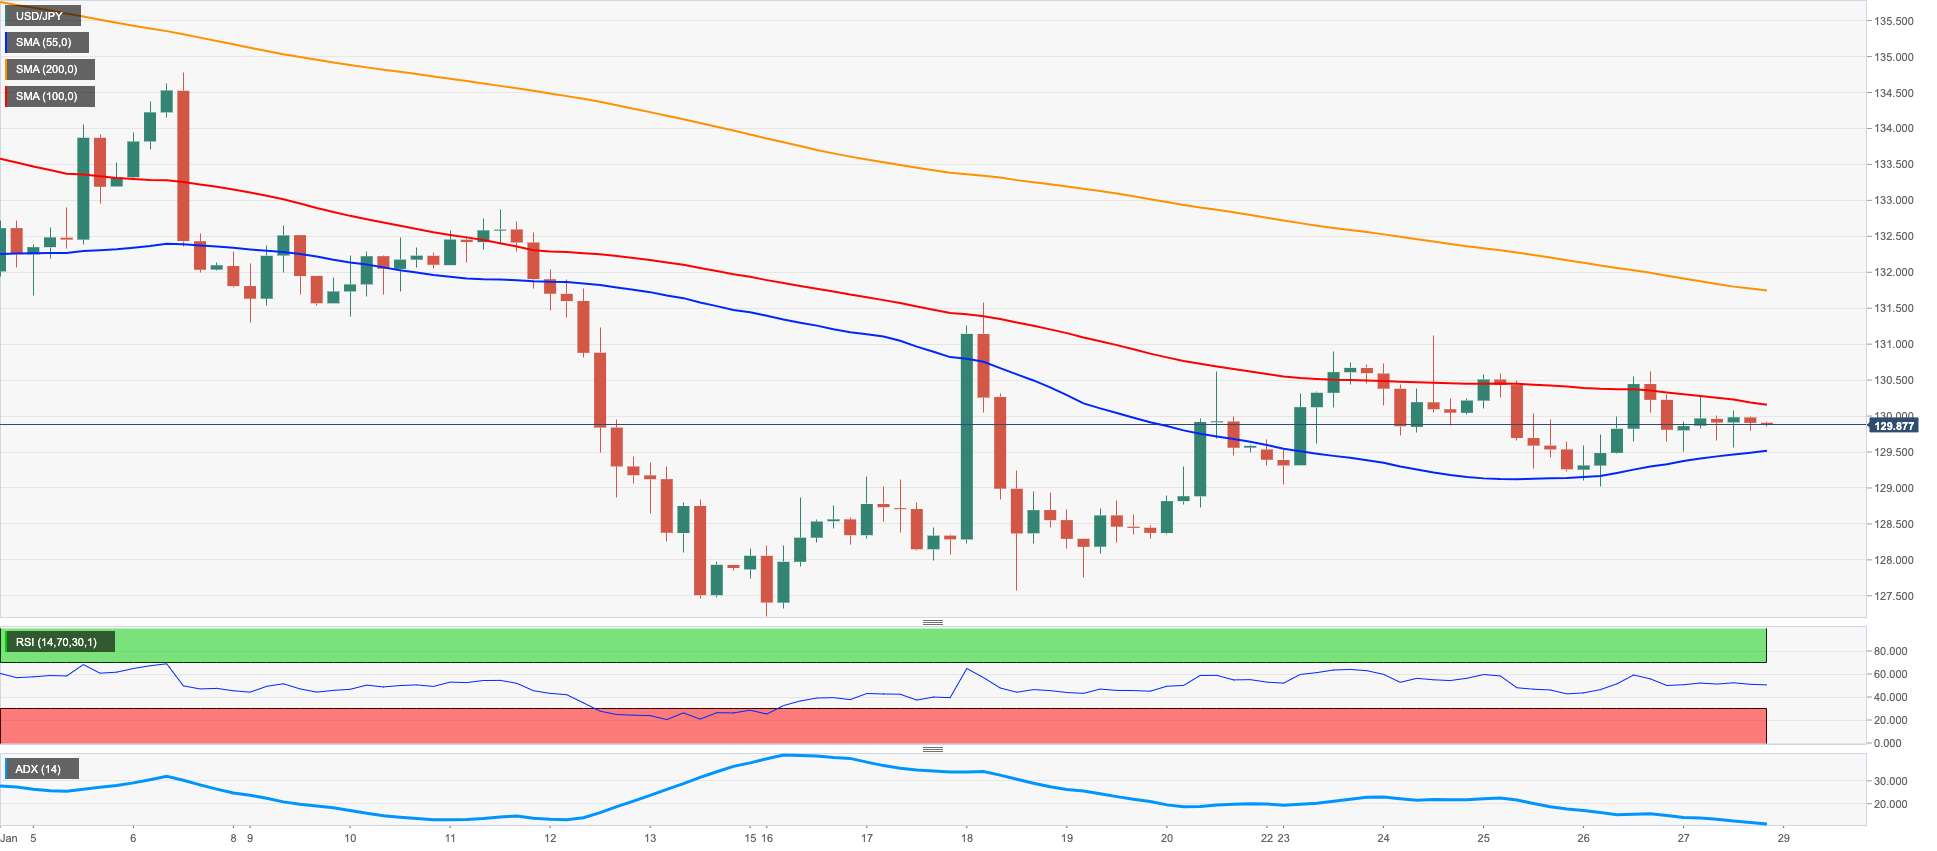
USD/JPY came under pressure and set aside Thursday’s pullback, resuming the downside and returning to the area below the key 130.00 support.
The daily retracement in the pair came in contrast to further advance in the greenback, while another bounce in US yields also failed to lend legs to the spot. In the Japanese debt market, the JGB 10-year yields advanced for the fourth session in a row and poked with the 0.50% level.
In the Japanese docket, the Tokyo headline CPI rose 4.4% in the year to January, while the Core CPI advanced 4.3% YoY and the CPI Ex Food and Energy gained 1.7% over the last twelve months.
Further weakness in USD/JPY should meet the next support of note at the 2023 low at 127.21 (January 16) ahead of the May 2022 low at 126.36 (May 24) and the weekly low at 121.27 (March 31 2022). Having said that, the weekly high at 131.11 (January 24) now emerges as the next target in case bulls regain the upper hand. North from here emerges another weekly top at 131.57 (January 20) prior to the 2023 peak at 134.77 (January 6) and the key 200-day SMA at 136.74. The breakout of this region exposes weekly highs at 138.17 (December 15 2022) and 139.89 (November 30 2022) just ahead of the round level at 140.00. The daily RSI deflated to the 43 area.
Resistance levels: 130.61 131.11 131.57 (4H chart)
Support levels: 129.47 129.02 127.56 (4H chart)
GBPUSD
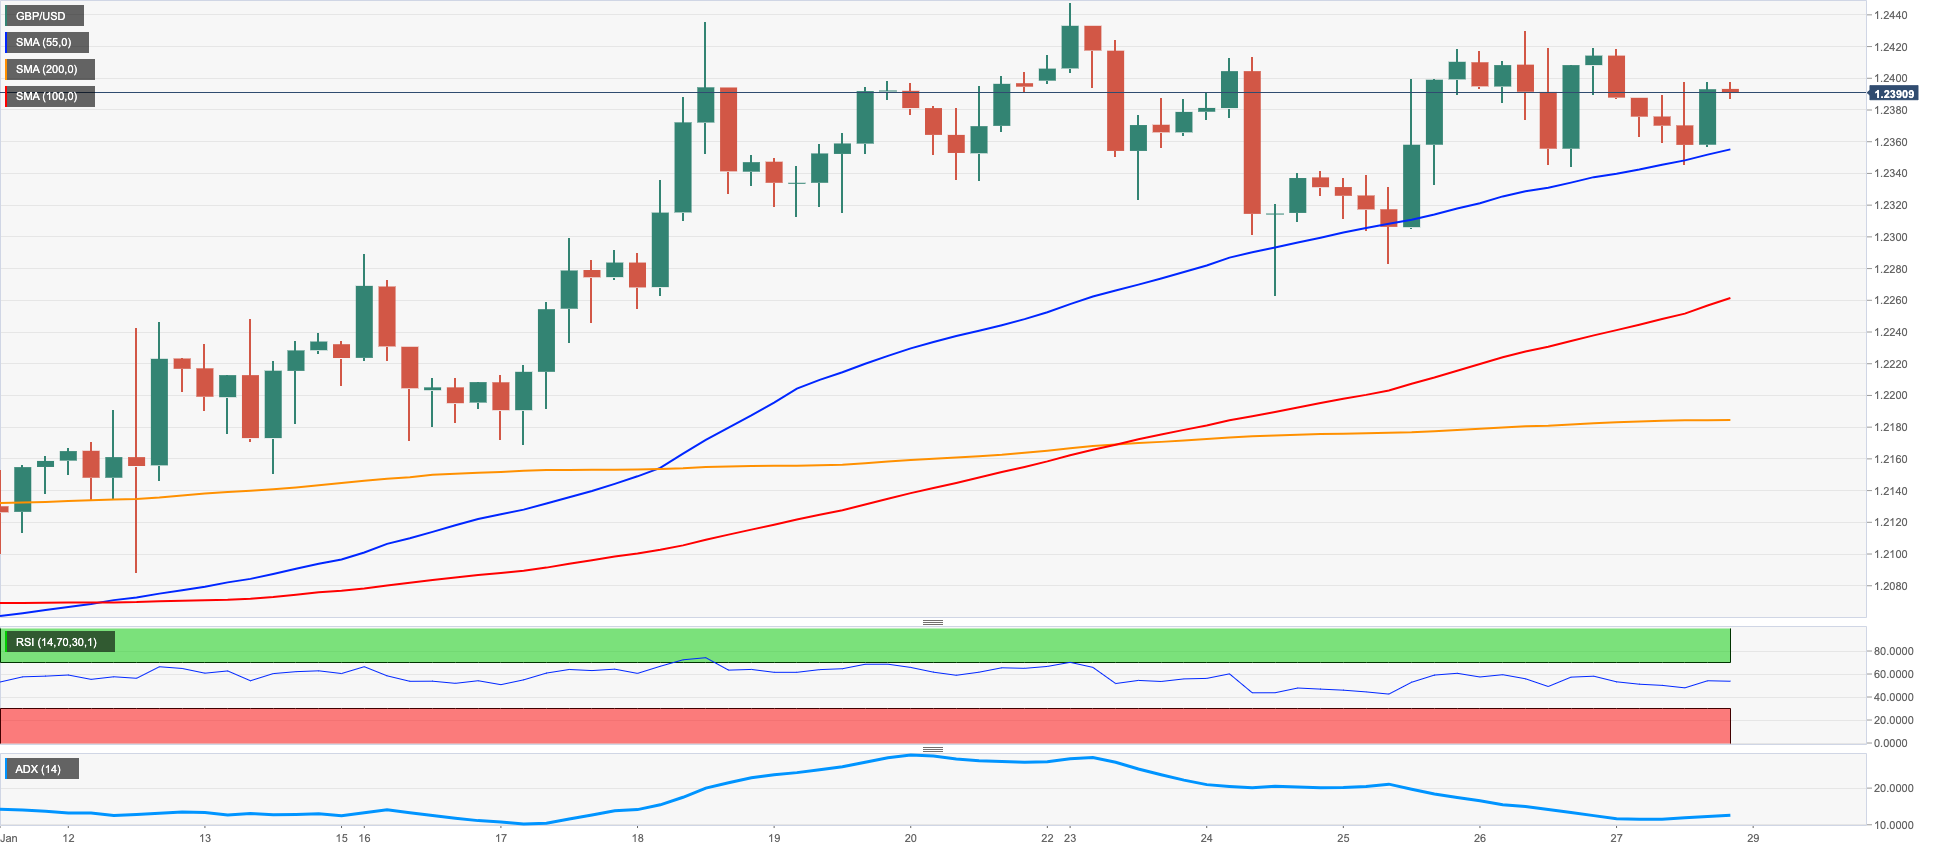
GBP/USD traded with modest losses and slipped back below 1.2400 the figure at the end of the week, reversing at the same time two daily advances in a row.
The renewed weakness in Cable came in response to extra upside pressure in the dollar, once again sustained by better-than-expected figures from the US calendar and also helped by the corrective upside in US yields across the curve.
Absent data releases in the UK calendar on Friday, all the attention shifted to Chancellor Hunt’s remarks. Indeed, Hunt acknowledged that the fiscal sector is recovering at a slower pace than expected, at the time when he suggested the idea of getting a low-tax economy when the time is right after noting the absence of headroom for tax cuts for the time being.
Next in the UK calendar will be Mortgage Approvals and Mortgage Lending for the month of December, both due on January 31.
Next on the upside for GBP/USD still appears the 2023 peak at 1.2447 (January 23). A move beyond this level could open the door to the May 2022 high at 1.2666 (May 27) ahead of the key 200-week SMA at 1.2906 and the psychological 1.3000 level. In the opposite direction, there is an initial support at the weekly low at 1.2263 (January 24), which if breached it could lead up to a test of the 55-day SMA at 1.2133 ahead of the weekly low at 1.2084 (January 12) and the round level at 1.2000. Down from here comes the key 200-day SMA at 1.1960 followed by the January low at 1.1841 (January 6). The daily RSI lost further momentum and approached the 62 zone.
Resistance levels: 1.2430 1.2447 1.2558 (4H chart)
Support levels: 1.2344 1.2282 1.2263 (4H chart)
AUDUSD
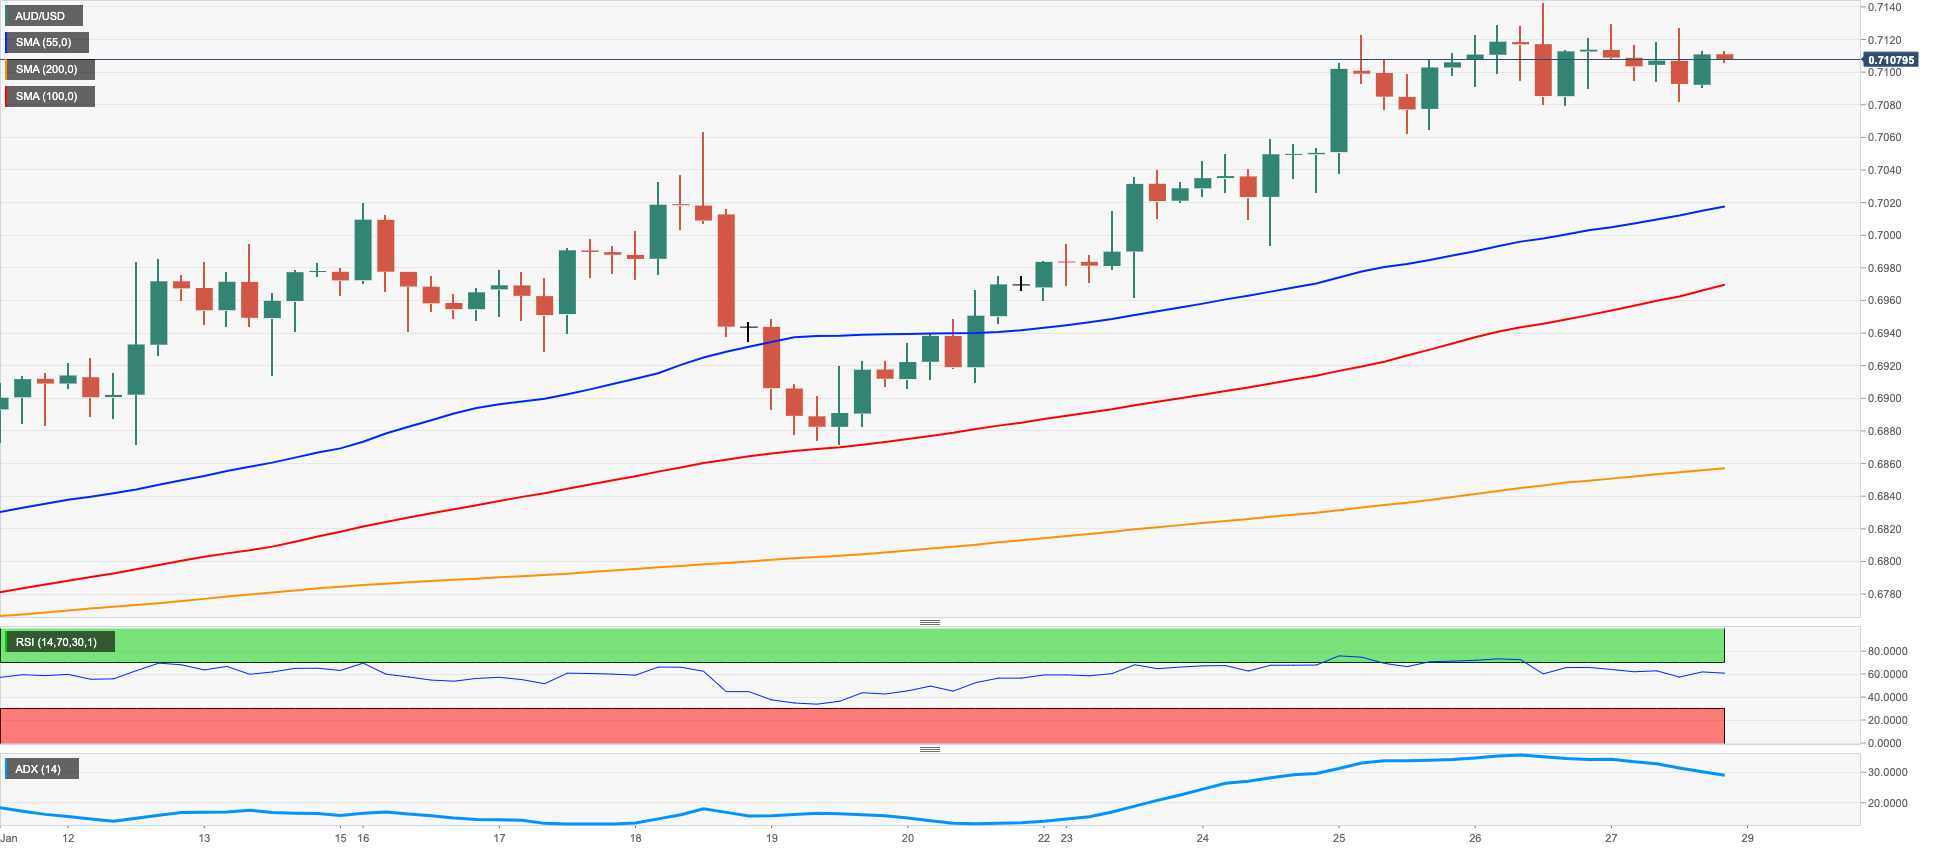
Friday’s vacillating price action motivated AUD/USD to close the session with marginal losses just above 0.7100 the figure.
On a weekly basis, the pair reversed the previous small downtick and advanced beyond the 200-week SMA (0.7071), revisiting at the same time an area last traded back in early June 2022.
Further strength in the dollar in combination with the offered stance in the commodity complex weighed on the Aussie dollar on Friday and sparked some profit taking in light of the recent needle-like advance.
Data wise Down Under, results for the October-December period saw Export Prices contract 0.9% QoQ and Import Prices rise 1.8% QoQ. Additionally, Producer Prices rose 0.7% inter-quarter and 5.8% from a year earlier.
The outlook for AUD/USD remains tilted to the positive side and initially targets the 2023 high at 0.7142 (January 26). North from here emerges the round level at 0.7200 seconded by the June 2022 top at 0.7282 (June 3) and the round level at 0.7300. The other way around, there are no support levels of significance until the weekly low at 0.6871 (January 19) prior to the key 200-day SMA at 0.6810. The loss of this region could put the January low at 0.6688 (January 3) to the test before the December low at 0.6629 (December 20) and weekly lows at 0.6584 (November 21) and 0.6386 (November 10). The daily RSI receded to the sub-69 region.
Resistance levels: 0.7142 0.7247 0.7282 (4H chart)
Support levels: 0.7082 0.7061 0.6962 (4H chart)
GOLD
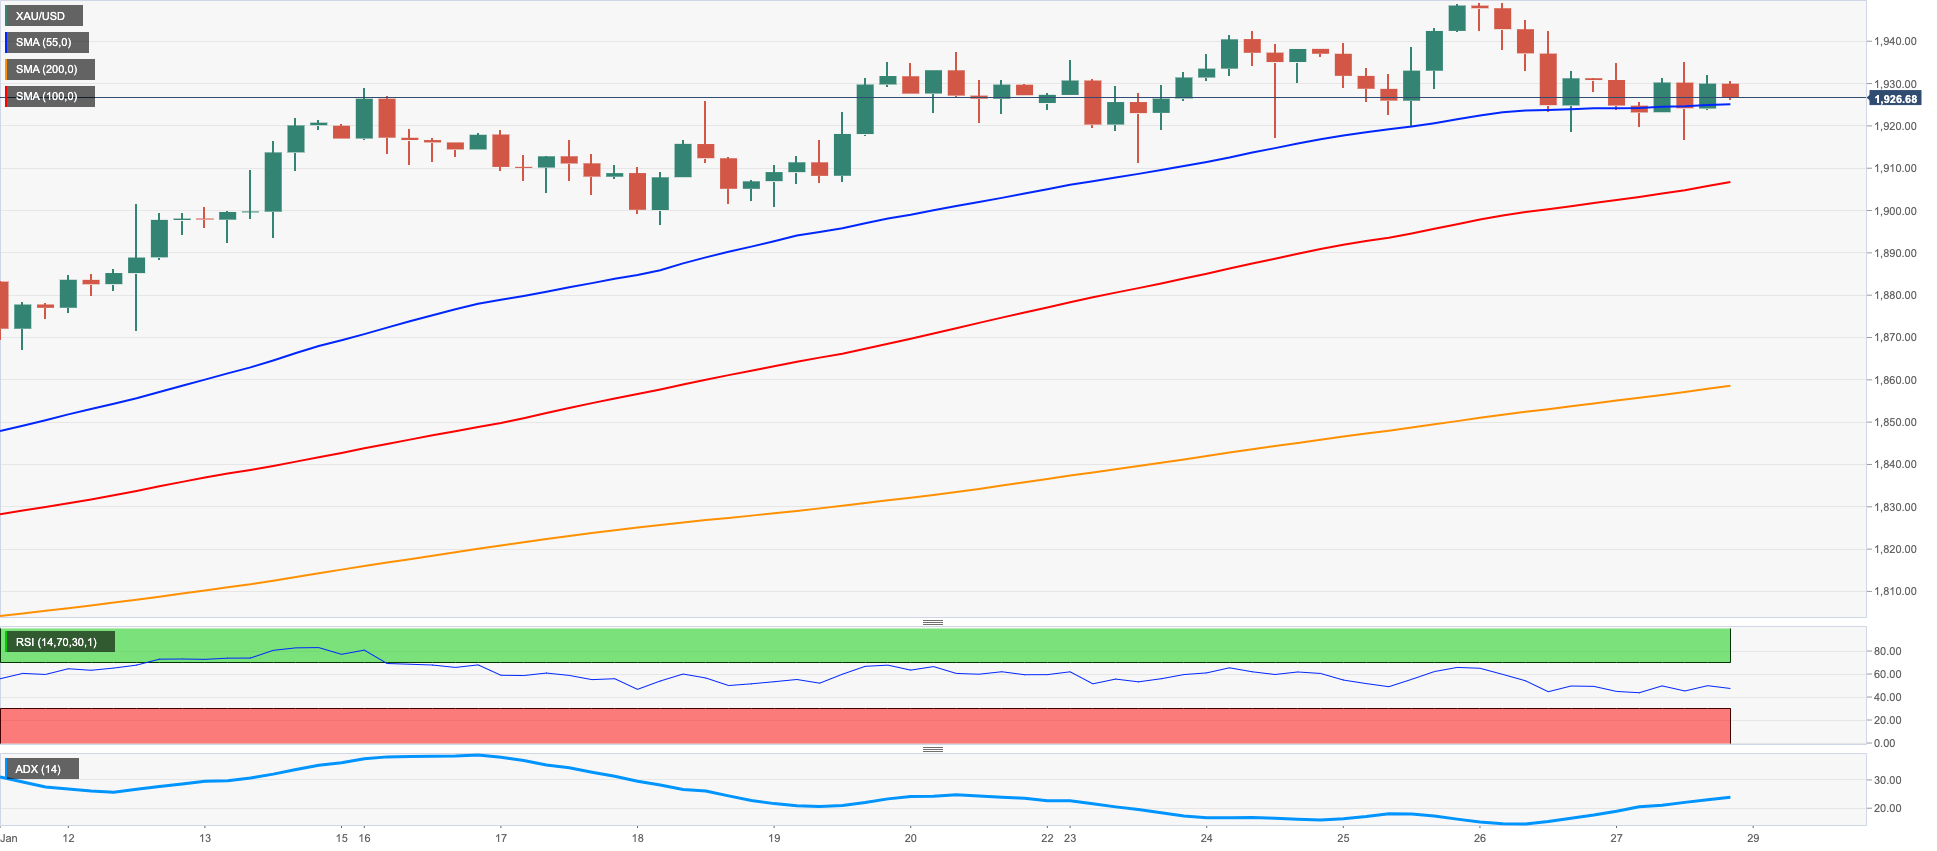
Gold prices swung between gains and losses and ended Friday’s session just below Thursday’s levels near $1930 per ounce troy.
Despite the pessimism seen in the second half of the week, bullion managed well to keep the rally well in place for the sixth week in a row and has already gained nearly 6% since the beginning of the new year.
In fact, the humble advance in the dollar and further recovery in US yields across the curve prompted the corrective move in the precious metal in the last couple of sessions and following multi-month highs near $1950 (January 26).
Moving forward, the yellow metal is expected to face a difficult week in light of the FOMC and ECB events, where market participants have already anticipated further tightening.
The 2023 top at $1949 (January) emerges as the initial up barrier for gold for the time being. Beyond this level, the April 2022 peak at $1998 (April 18) closely followed by the psychological $2000 level and the 2022 high at $2070 (March 8). On the other way, weekly lows at $1896 (January 18) and $1867 (January 11) appear as minor support levels ahead of the interim 55-day SMA at $1821. A drop below the latter exposes the more relevant 200-day SMA at $1776 ahead of the 100-day SMA at $1753 and the weekly low at $1727 (November 23).
Resistance levels: $1949 $1955 $1982 (4H chart)
Support levels: $1916 $1896 $1867 (4H chart)
CRUDE WTI
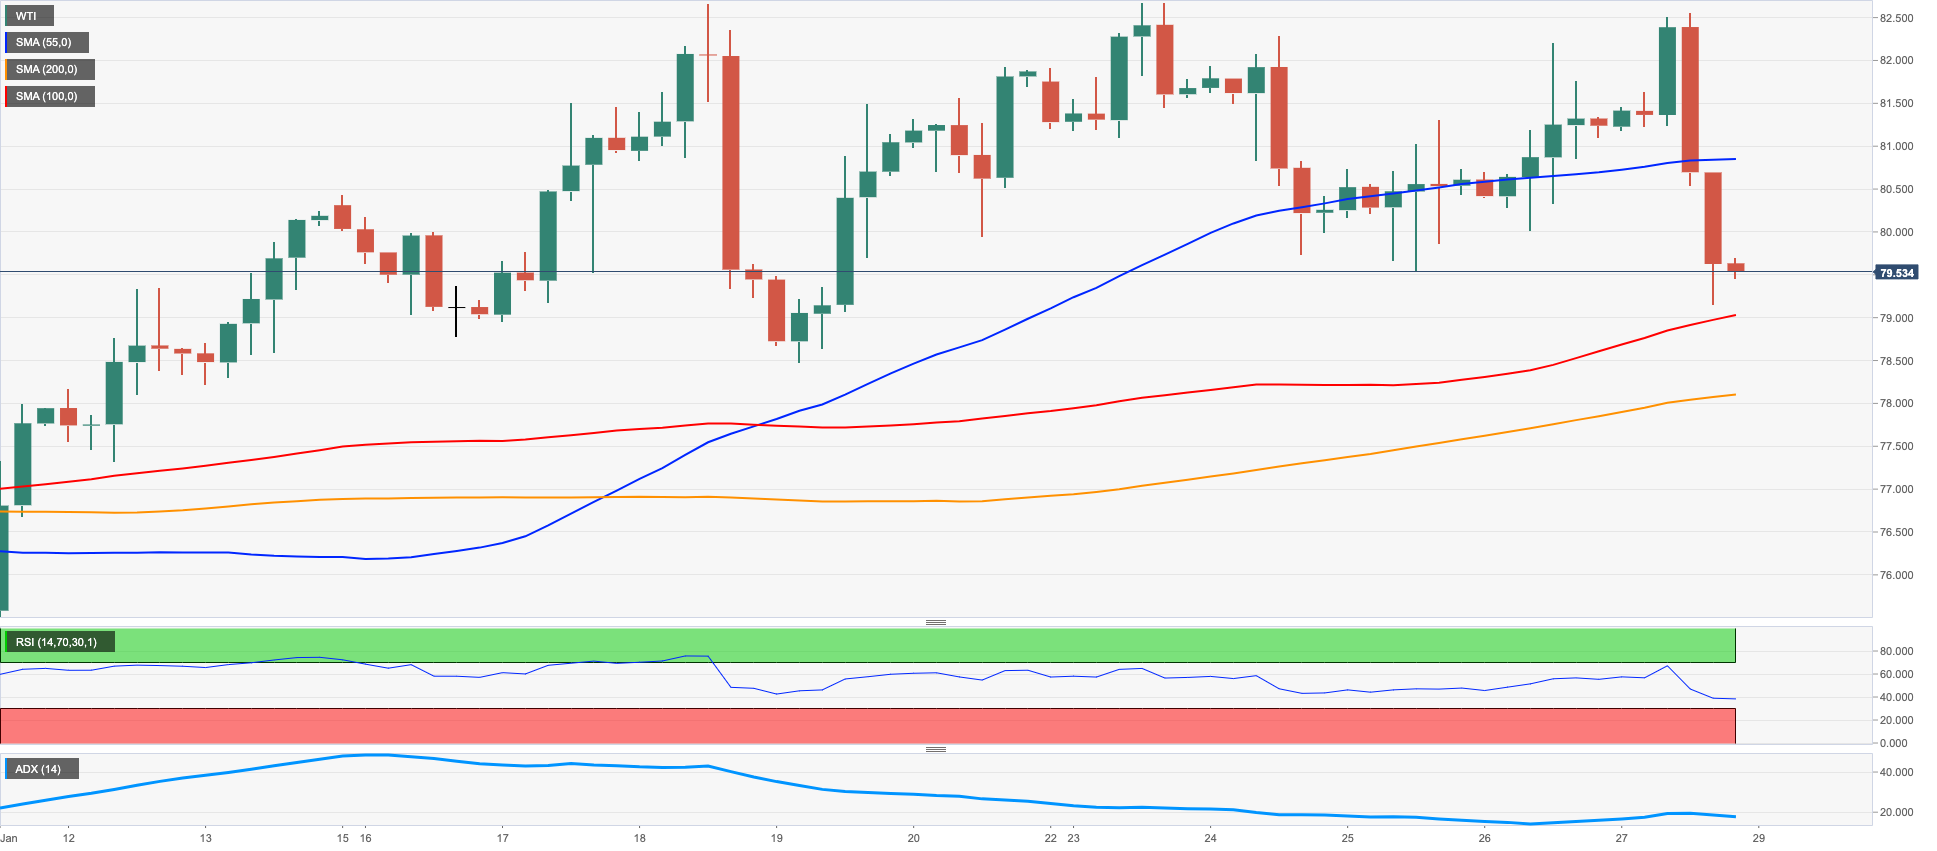
Prices of the West Texas Intermediate (WTI) dropped and closed Friday’s session in multi-day lows in the vicinity of the $79.00 mark per barrel.
The daily retracement in prices came mostly in response to increasing Russian crude oil supply and some profit taking following the strong upside seen since the beginning of the year.
Also collaborating with the corrective decline appeared the marked increase in US crude oil supplies at Cushing (+4.3M barrels) in the week to January 20, all eclipsing prospects for a strong demand coming from the Chinese reopening and supported by auspicious results from US fundamentals.
In the calendar, driller Baker Hughes said the US oil rig count went down by 4 in the week to January 27, taking the total US active oil rigs to 609.
A deeper drop below the provisional 55-day SMA at $78.59 could prompt the January low at $72.50 (January 5) to re-emerge on the horizon prior to the 2022 low at $70.10 (December 9). South from here comes the key round level at $70.00 followed by the weekly low at $66.15 (December 20 2021) and the 200-week SMA at $65.72. Just the opposite, bouts of strength should initially target the 2023 high at $82.60 (January 23) ahead of the December 2022 top at $83.32 (December 1) and the $90.08 level (November 11 2022). Up from here lines up the 200-day SMA at $92.29 before the November 2022 top at $93.73 and the weekly peak at $97.65 (August 30 2022), all preceding the key $100.00 mark per barrel.
Resistance levels: $82.44 $83.32 $88.65 (4H chart)
Support levels: $79.08 $78.08 $77.73 (4H chart)
GER40
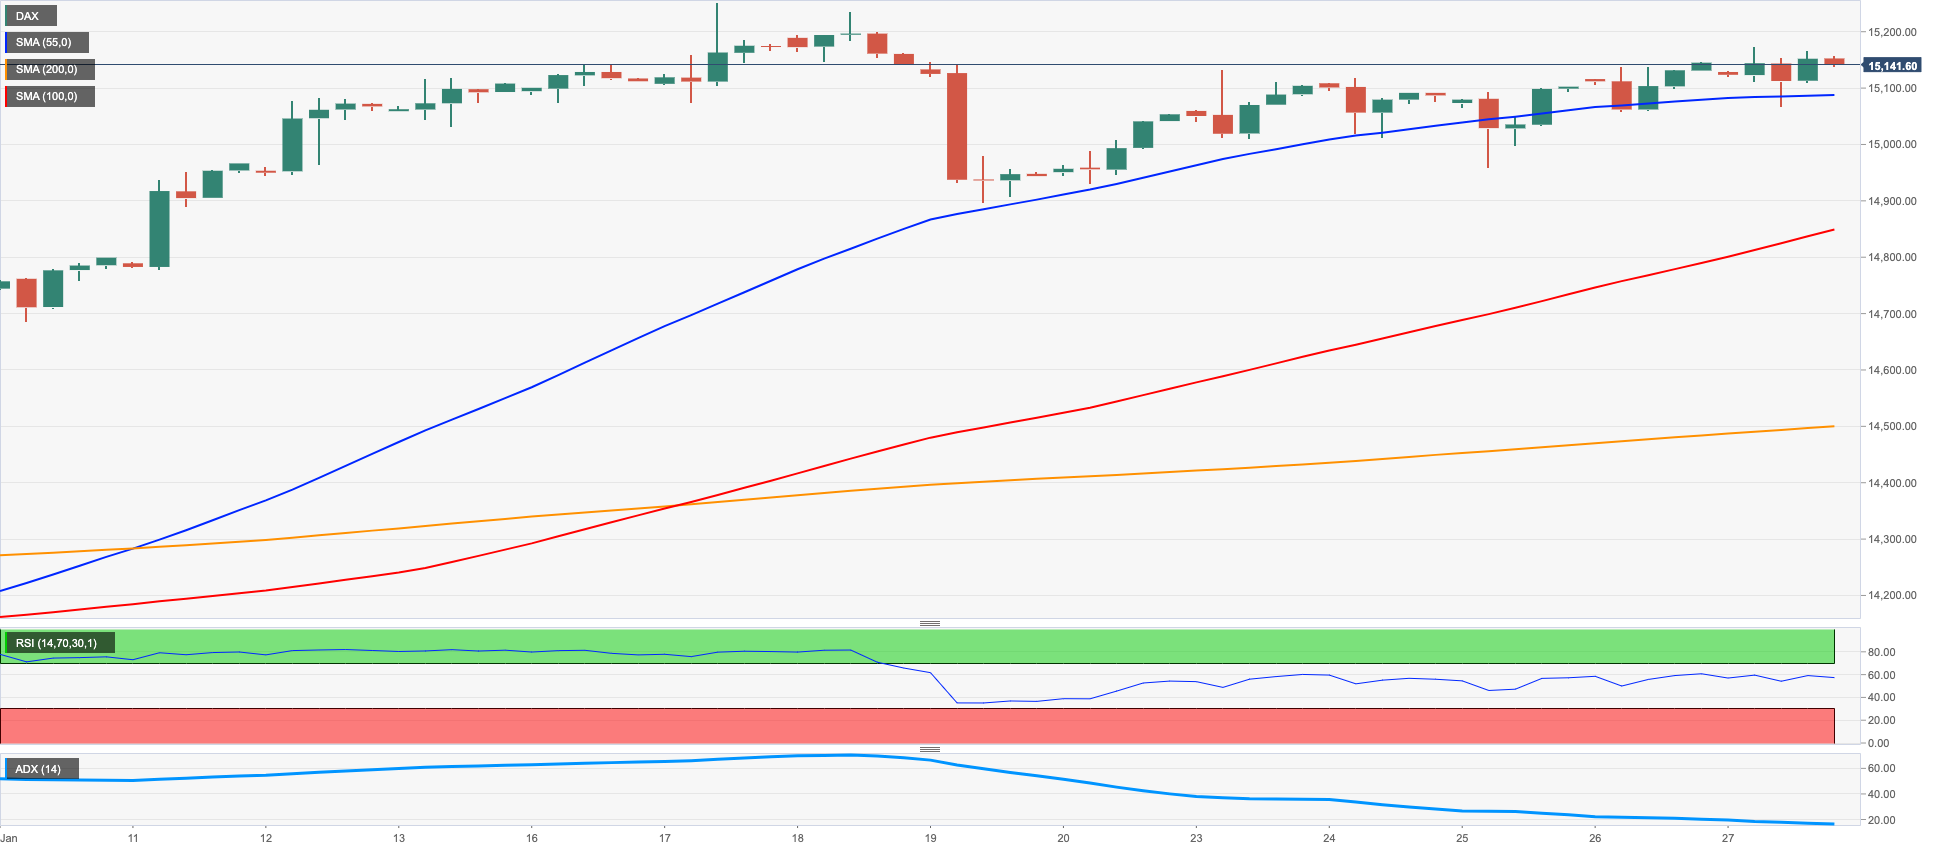
German equities tracked by the benchmark index DAX 40 advanced for the second session in a row on Friday, keeping the auspicious trade – and the 15000 mark - well in place in the second half of the week.
The broad-based optimism in European stock indices was propped up by positive data releases in the US calendar, showing that disinflation remained unchanged in December while the economy maintained its resilience.
In addition, the upside bias in stocks were also underpinned by positive sentiment gauges in Germany published earlier in the week and ahead of the ECB gathering on February 2. On the latter, investors have already priced in a half point increase in the policy rate.
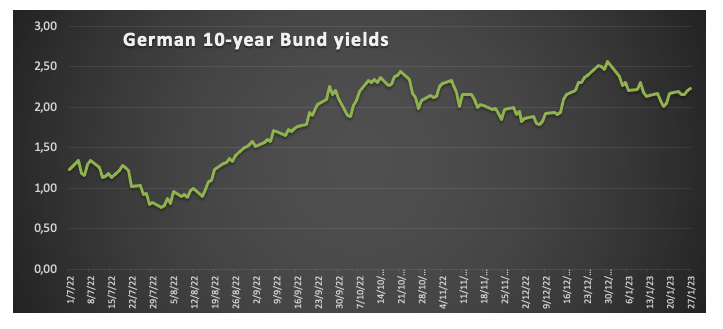
The positive session in the DAX 40 also came in tandem with the rebound in the German 10-year Bund yields to multi-session peaks near 2.30% up for the second straight session on Friday.
Immediately to the upside for the DAX 40 turns up the 2023 top at 15262 (January 17) followed by the round level at 16000 and the 2022 peak at 16285 (January 5). On the contrary, the weekly low at 14906 (January 19) is expected to hold the initial test prior to the temporary 55-day SMA at 14478 and the December 2022 low at 13791 (December 20). A drop below the latter could put the key 200-day SMA at 13612 to the test before the November 2022 low at 13022 (November 3) and the minor support at 12548 (October 21 2022). The daily RSI remained consolidative near 67.
Best Performers: Fresenius Medical Care, Heidelbergcement, Continental AG
Worst Performers: Sartorius AG VZO, Airbus Group, RWE AG ST
Resistance levels: 15186 15269 15542 (4H chart)
Support levels: 14969 14906 14542 (4H chart)
NASDAQ
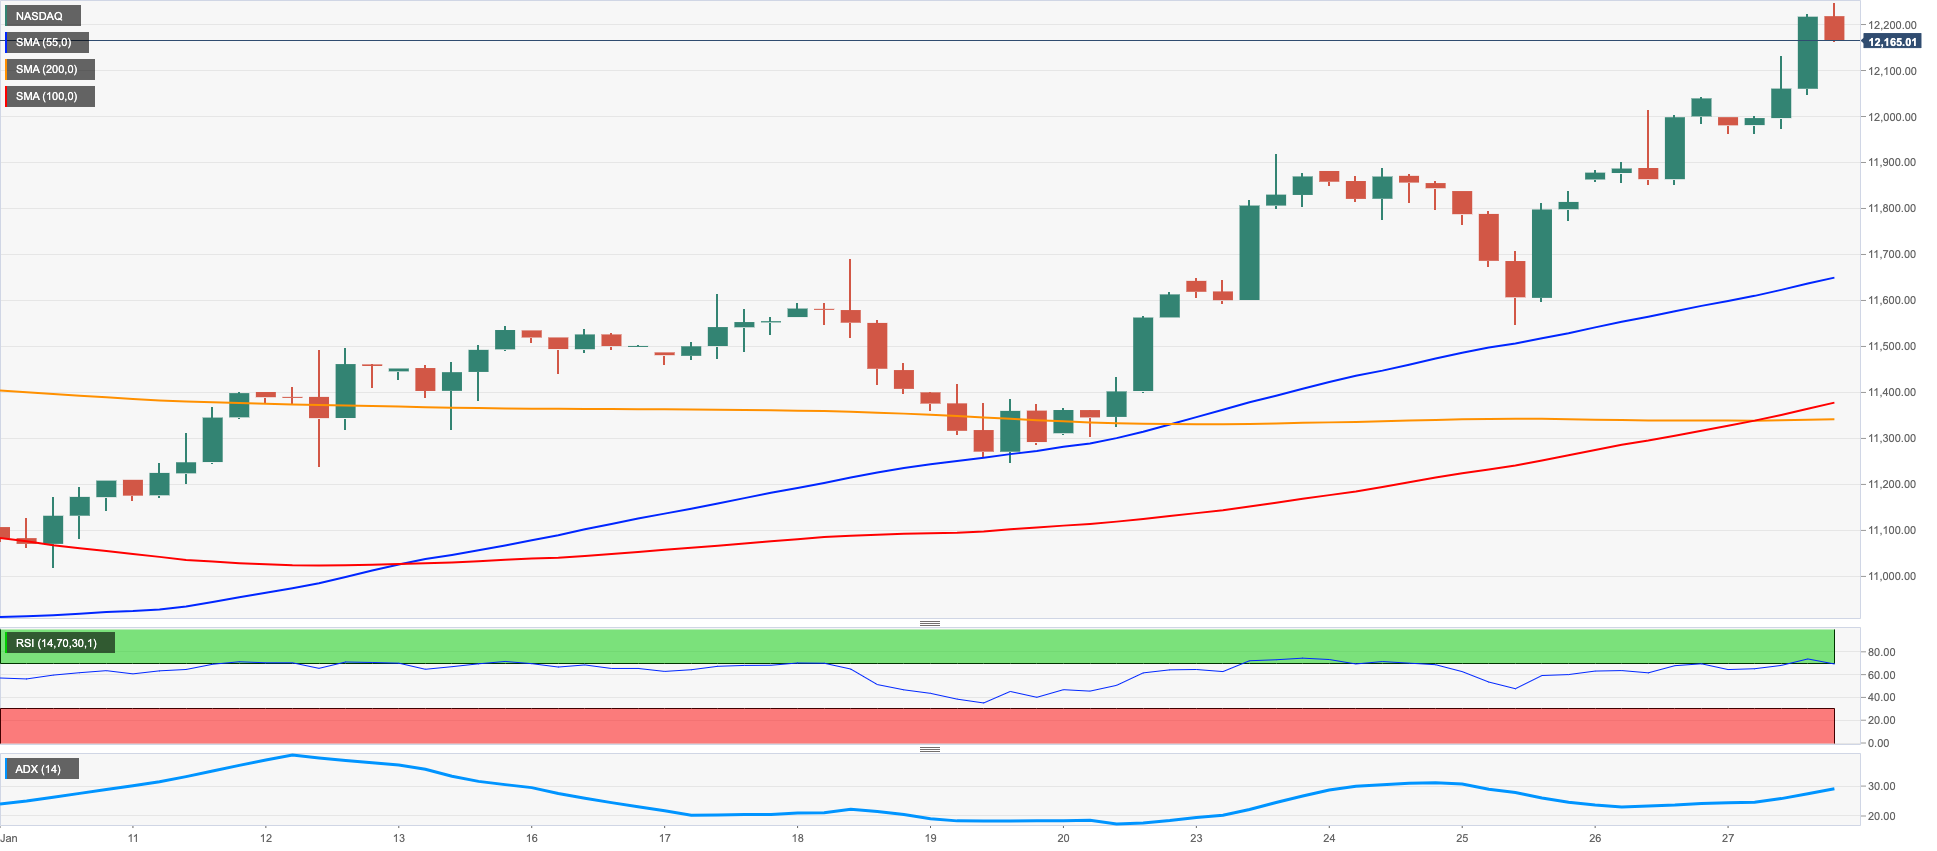
Further upside momentum in the tech sector propelled the reference index Nasdaq 100 to the area north of the key 12000 mark for the first time since early September 2022.
Indeed, auspicious results from the US calendar coupled with declining US inflation (this time measured by the PCE and Core PCE) sustained the upbeat mood among investors, all underpinned at the same time by better-than-expected results from tech megacaps.
The Nasdaq 100, however, is expected to remain under the microscope in the next sessions in light of the upcoming FOMC event and the most likely scenario of a 25 bps interest rate hike.
The new 2023 top at 12248 now emerges as the immediate up barrier for the Nasdaq 100. The breakout of this region could put a test of the September 2022 high at 12752 (September 12) back on the radar. By contrast, there is initial support at the weekly low at 11550 (January 25) prior to another weekly low at 11251 (January 19) and ahead of the January low at 10696 (January 6). The loss of the latter could open the door to the December 2022 low at 10671 (December 22) ahead of the November 2022 low at 10632 (November 4) and the 2022 low at 10440 (October 13). The daily RSI marched further north and flirted with the 69 zone.
Top Gainers: Lucid Group, Tesla, Rivian Automotive
Top Losers: KLA Corp, Intel, Charter Communications Inc
Resistance levels: 12248 12752 13175 (4H chart)
Support levels: 11550 11447 11251 (4H chart)
DOW JONES
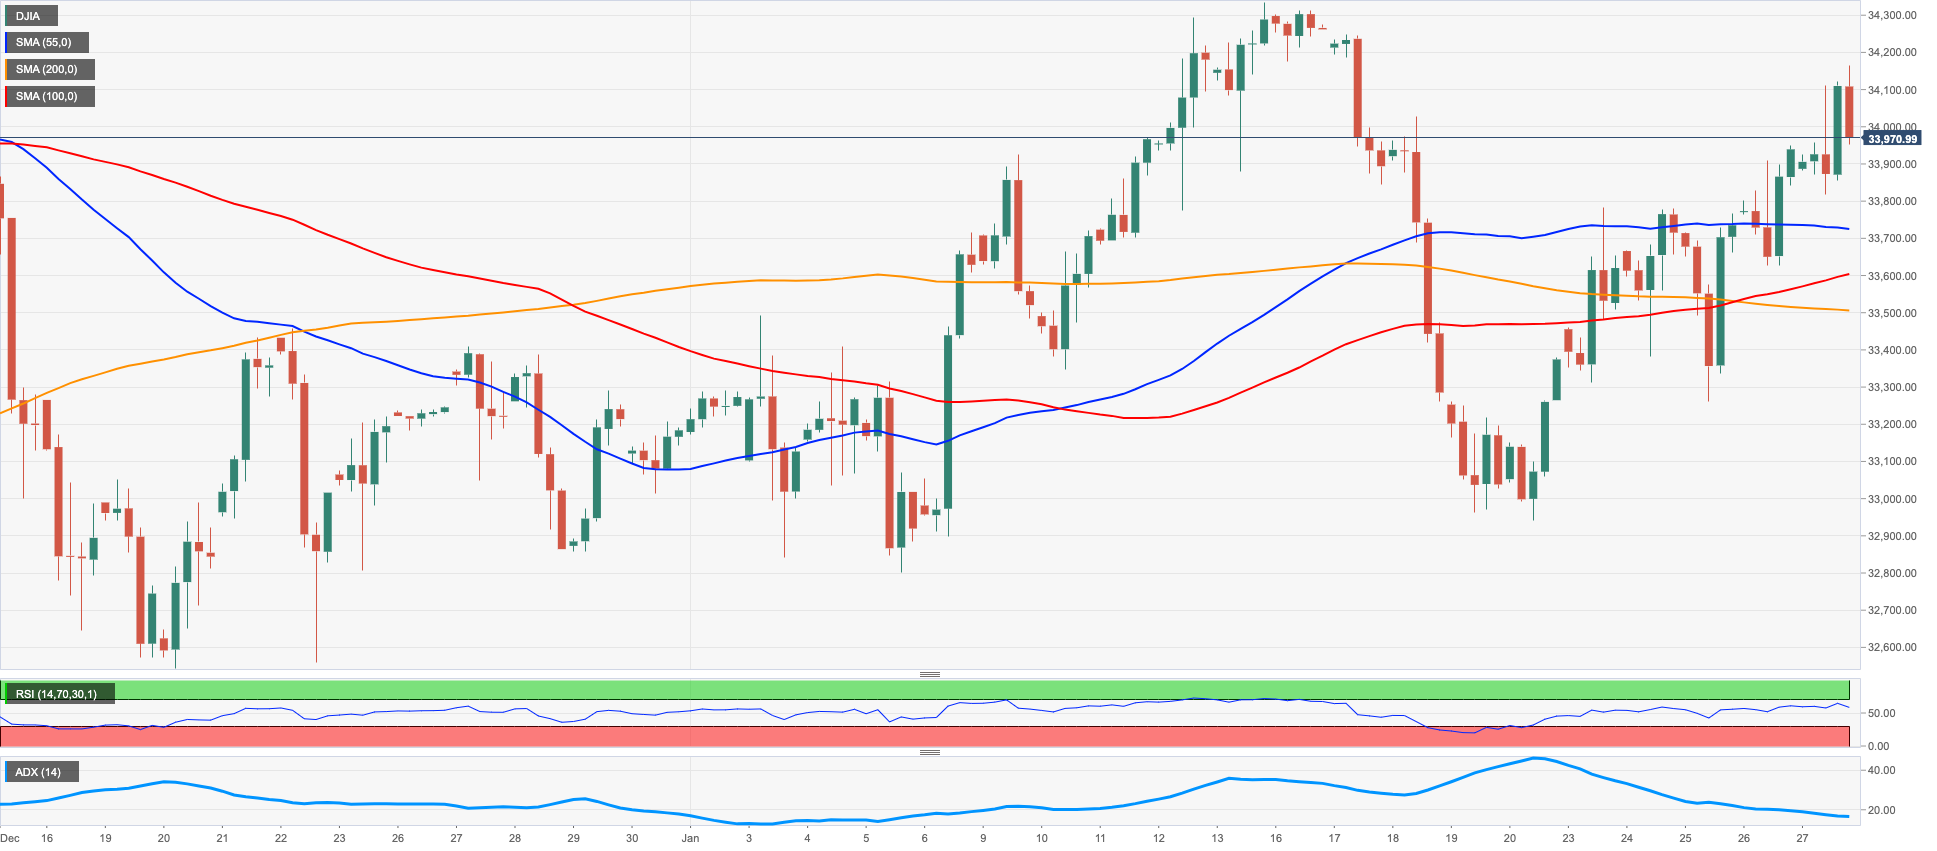
US stocks gauged by the Dow Jones added to the weekly rally and ended with marginal gains just below the 34000 mark on Friday.
In fact, the continuation of the upside momentum in US equities was accompanied by further US data suggesting inflation (measured by the PCE) continued to drift lower in December amidst a decline in consumer spending.
In addition, speculation of a pivot in the Fed’s policy remained everything but abated despite the hawkish rhetoric from Fed’s policy makers and was also behind the improved sentiment among market participants. It is worth recalling that the Federal Reserve is largely expected to raise rates by 25 bps at its February 1 meeting.
All in all, the Dow Jones rose 0.08% to 33978, the S&P500 gained 0.25% to 4070 and the tech-heavy Nasdaq Composite advanced 0.95% to 11621.
The continuation of the uptrend in the Dow Jones now needs to clear the weekly peak at 34164 (January 27). The surpass of this level could motivate the 2023 high at 34342 (January 13) to emerge on the horizon prior to the December 2022 peak at 34712 (December 13). Further up appears the April 2022 high at 35492 before the February 2022 high at 35824 (February 9). On the other hand, there is initial support at the weekly low at 32948 (January 20) seconded by the December 2022 low at 32573 (December 22). A deeper pullback could see the key 200-day SMA at 32349 revisited ahead of the November 2022 low at 31727 (November 3), while the minor support at 30206 (October 21 2022) precedes the 2022 low at 28660 (October 13). The daily RSI ticked higher and approached the 57 level.
Top Performers: American Express, Visa A, Walgreen Boots
Worst Performers: Intel, Chevron, Travelers
Resistance levels: 34164 34342 34712 (4H chart)
Support levels: 33273 32948 32573 (4H chart)
MACROECONOMIC EVENTS

All Information & Updates provided by:

All information relating to the financial markets available on this page has been prepared and issued by FXStreet (Forexstreet SL, Spain, Reg: B62498233) on the basis of publicly available information and all information believed to be reliable and does not conflict with Kuwaiti local laws, and all necessary care has been taken to before the company to ensure that the facts mentioned are correct from the source.
NCM Investment nor any of its directors or employees shall in any way be held responsible for the contents of this news, and the information contained on this page is intended only to provide clients with publicly available information and should not be construed as investment advice, report or analysis and/or constitute an offer or invitation to buy or sell financial instruments of any kind.
RISK WARNING: Forex and CFDs are highly risky leveraged products, as losses can exceed deposits. Please ensure you understand all the risks and take independent advice if necessary. NCM will segregate the clients based on the criteria of the regulator and its bylaws. NCM does not provide any advisory service; the material published does not constitute advice or a recommendation for a transaction in any financial instrument. NCM accepts no responsibility for any use of the content presented and any consequences of that use. Anyone acting on the information provided does so at their own risk.