
- Contact Us:
-

-

-

-


Daily Market Updates
31 Jan 2023
USDJPY
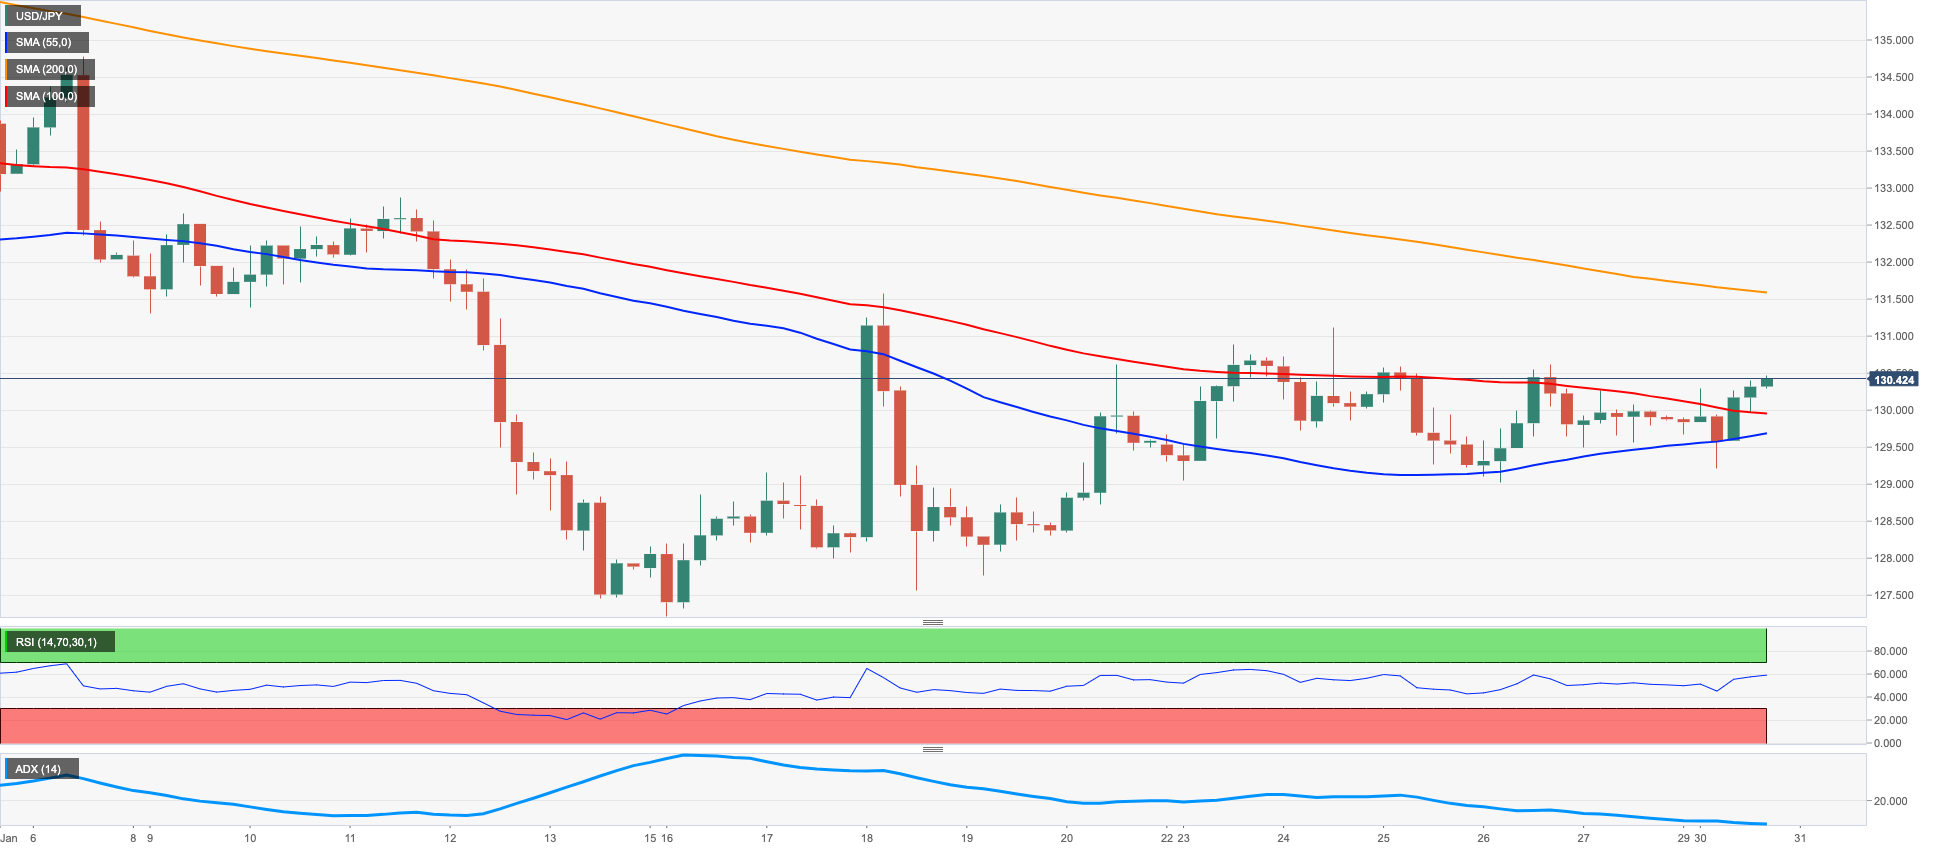
USD/JPY extended further the multi-session consolidative theme, setting aside Friday’s daily losses and posting decent gains above the 130.00 hurdle at the beginning of the week.
The continuation of the erratic activity in the pair came amidst the equally directionless trend in the risk appetite, while another positive performance in the buck and US yields across the curve also accompanied the uptick in spot.
Still around yields, the JGB 10-year reference advanced for the fifth session in a row and flirted with the 0.50% level.
Extra weakness around the Japanese yen also came after the BoJ Governor reiterated before the Parliament the bank’s commitment to maintain the 2% inflation goal and the current accommodative stance.
There were no data releases in Japan on Monday.
In case USD/JPY breaks above the ongoing consolidative theme, it should meet the initial up barrier at the weekly top at 131.11 (January 24) prior to another weekly peak at 131.57 (January 20) and the 2023 high at 134.77 (January 6). North from here aligns the key 200-day SMA at 136.75 followed by weekly tops at 138.17 (December 15 2022) and 139.89 (November 30 2022), all preceding the key round level at 140.00. In the opposite direction, the 2023 low at 127.21 (January 16) remains the initial contention level followed by the May 2022 low at 126.36 (May 24) and the weekly low at 121.27 (March 31 2022). The daily RSI advanced decently above the 46 level.
Resistance levels: 130.61 131.11 131.57 (4H chart)
Support levels: 129.19 129.02 127.56 (4H chart)
GBPUSD
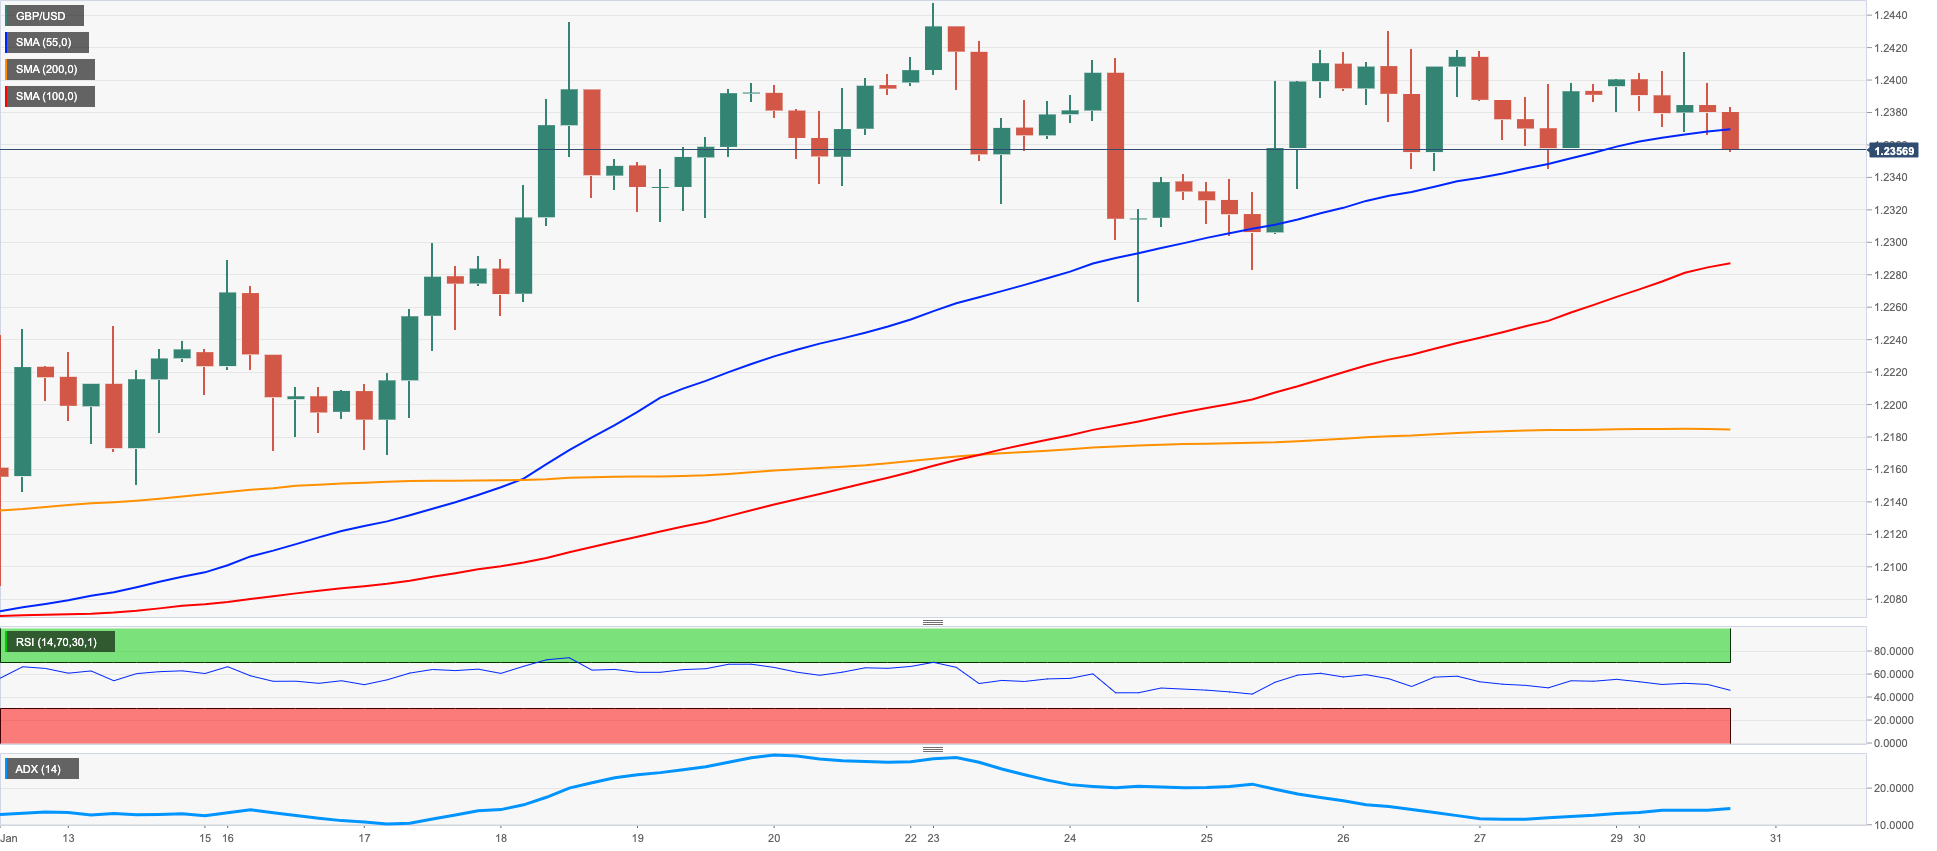
GBP/USD started the week in a weak note and added to the weakness seen at the end of last week, this time deflating to the mid-1.2300s against the backdrop of further recovery in the dollar.
Indeed, diminishing risk appetite put Cable under pressure on Monday amidst rising cautiousness ahead of the FOMC, ECB and BoE meetings due later in the week. Fresh news on the UK political scenario could have also played against any bounce in the Sterling.
In the UK debt market, the 10-year Gilt yields followed their major European peers and rose to multi-session tops near 3.40%.
The UK docket remained empty on Monday, while Mortgage Approvals and Mortgage Lending for the month of December will be published on January 31.
There are no changes to the topside in GBP/USD, which remains focused on the 2023 high at 1.2447 (January 23) prior to the May 2022 top at 1.2666 (May 27) and the key 200-week SMA at 1.2903, which precedes the psychological 1.3000 mark. On the flip side, the weekly low at 1.2263 (January 24) should offer initial contention ahead of the provisional 55-day SMA at 1.2144 and the weekly low at 1.2084 (January 12). The loss of this level could put the round level at 1.2000 to the test ahead of the key 200-day SMA at 1.1958 and the January low at 1.1841 (January 6). The daily RSI grinded lower to the sub-60 area.
Resistance levels: 1.2430 1.2447 1.2558 (4H chart)
Support levels: 1.2344 1.2282 1.2263 (4H chart)
AUDUSD
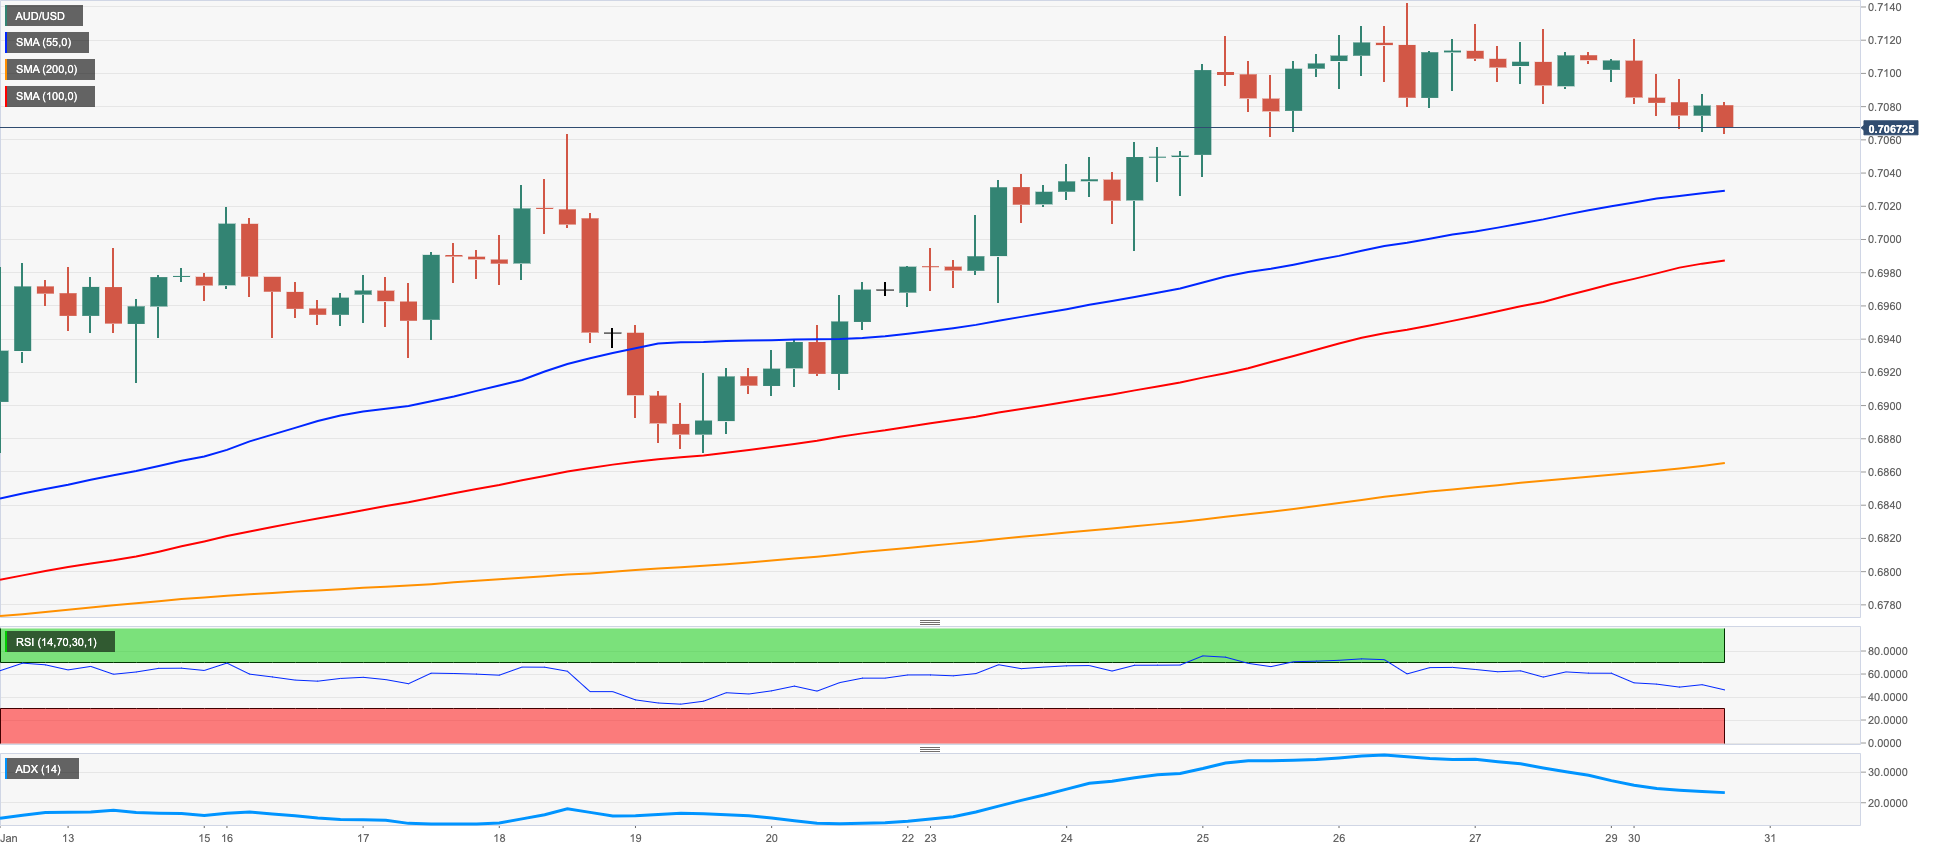
AUD/USD started the week in a negative fashion and added to Friday’s pullback, returning at the same time to the area below the 0.7100 support, or 3-day lows, on Monday.
The positive price action around the greenback and the broad-based bearish mood in the commodity complex kept the Aussie dollar under downside pressure, which extended further the rejection from YTD peaks around 0.7140 recorded on January 26.
On the latter, while copper prices retreated for the second session in a row, prices of the iron ore climbed past the $128.00 mark for the first time since late June 2022.
The Australian calendar was empty on Monday, whereas Housing Credit figures and advanced Retail Sales are due on Tuesday along with key releases in China (NBS Manufacturing PMI, Industrial Profits, NBS Non Manufacturing PMI).
If bulls regain the initiative, AUD/USD is then expected to confront the 2023 top at 0.7142 (January 26) prior to the round level at 0.7200. Once the latter is cleared, a potential test of the June 2022 peak at 0.7282 (June 3) could emerge on the horizon ahead of the round level at 0.7300. Having said that, further weakness is expected to meet the next support of note at the key 0.7000 level seconded by the weekly low at 0.6871 (January 19) and the key 200-day SMA at 0.6809. South from here comes the January low at 0.6688 (January 3) followed by the December low at 0.6629 (December 20). The daily RSI deflated to the proximity of the 63 region.
Resistance levels: 0.7142 0.7247 0.7282 (4H chart)
Support levels: 0.7065 0.6993 0.6962 (4H chart)
GOLD
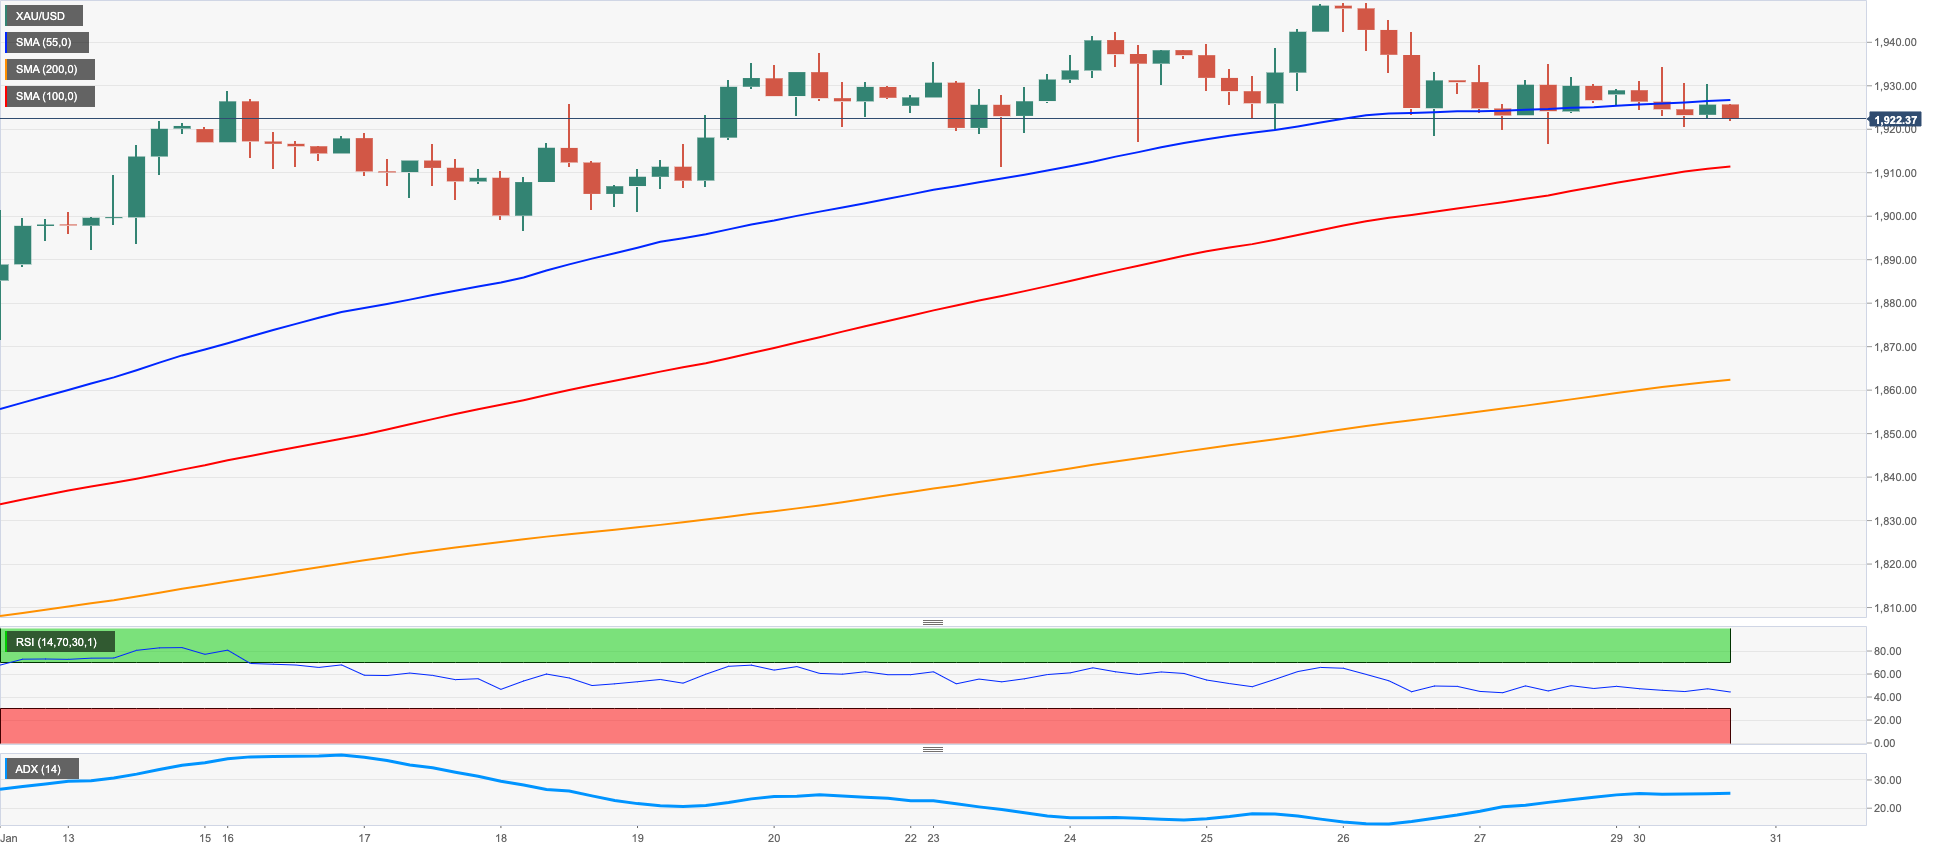
Prices of the ounce troy of the yellow metal dropped for the third session in a row on Monday, revisiting at the same time the $1920 region amidst quite a narrow trading range.
The firmer mood around the greenback in combination with the march north in US yields across the curve undermined the sentiment around bullion and extended further the recent offered stance.
In the very near term, bullion is expected to maintain the side-lined stance in light of key meetings by the Fed, the ECB and the BoE due later in the week.
Immediately to the upside for gold emerges the 2023 peak at $1949 (January) ahead of the April 2022 high at $1998 (April 18), which precedes the psychological $2000 level and the 2022 top at $2070 (March 8). The other way around, initial contention is seen at weekly lows at $1896 (January 18) and $1867 (January 11) prior to the provisional 55-day SMA at $1825 and the more important 200-day SMA at $1776. The breach of the latte could put the 100-day SMA at $1755 to the test seconded by the weekly low at $1727 (November 23).
Resistance levels: $1935 $1949 $1955 (4H chart)
Support levels: $1916 $1896 $1867 (4H chart)
CRUDE WTI
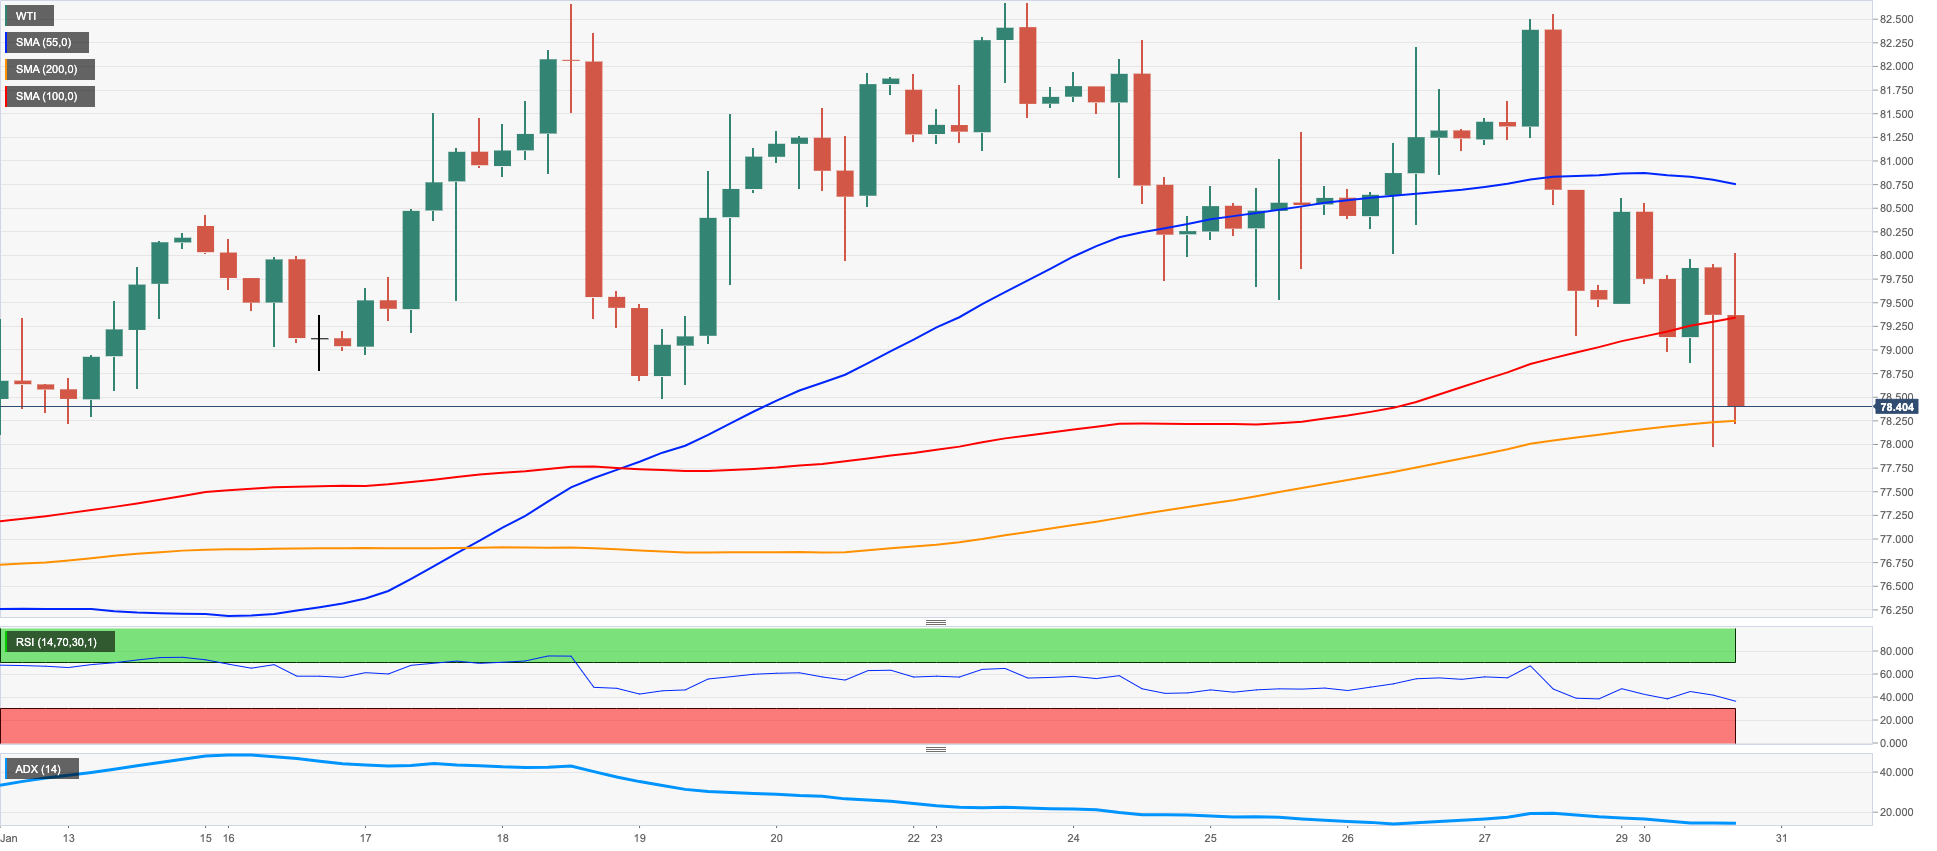
Prices of the WTI added to Friday’s decline and extended the correction to multi-day lows in the sub-$78.00 region per barrel on Monday.
Buyers remained absent and exposed further weakness in the commodity amidst solid prints from exports of Russian crude oil - in spite of the current G7 price cap and EU ban – and recession fears in light of widely anticipated rate hikes by the Federal Reserve (Wednesday), the ECB and the BoE (both on Thursday).
Somewhat limiting the downside appeared usual positive prospects regarding the Chinese demand and the drone attack to a military facility in Isfahan (Iran).\
Later in the week, the OPEC+ will meet and is expected to leave the status quo on the oil output policy unchanged.
Further losses in the WTI should not meet any support of note until the January low at $72.50 (January 5). The breakdown of this region could spark a deeper move to the 2022 low at $70.10 (December 9) just before the key round level at $70.00. South from here comes the weekly low at $66.15 (December 20 2021) followed by the 200-week SMA at $65.79. Conversely, the 2023 top at $82.60 (January 23) emerges as the immediate hurdle before the December 2022 peak at $83.32 (December 1) and the $90.08 level (November 11 2022). The surpass of this level exposes the 200-day SMA at $92.17 ahead of the November 2022 peak at $93.73 (November 7). Further up is seen the weekly high at $97.65 (August 30 2022) followed by the key $100.00 mark per barrel.
Resistance levels: $80.44 $82.44 $83.32 (4H chart)
Support levels: $77.91 $73.81 $72.42 (4H chart)
GER40
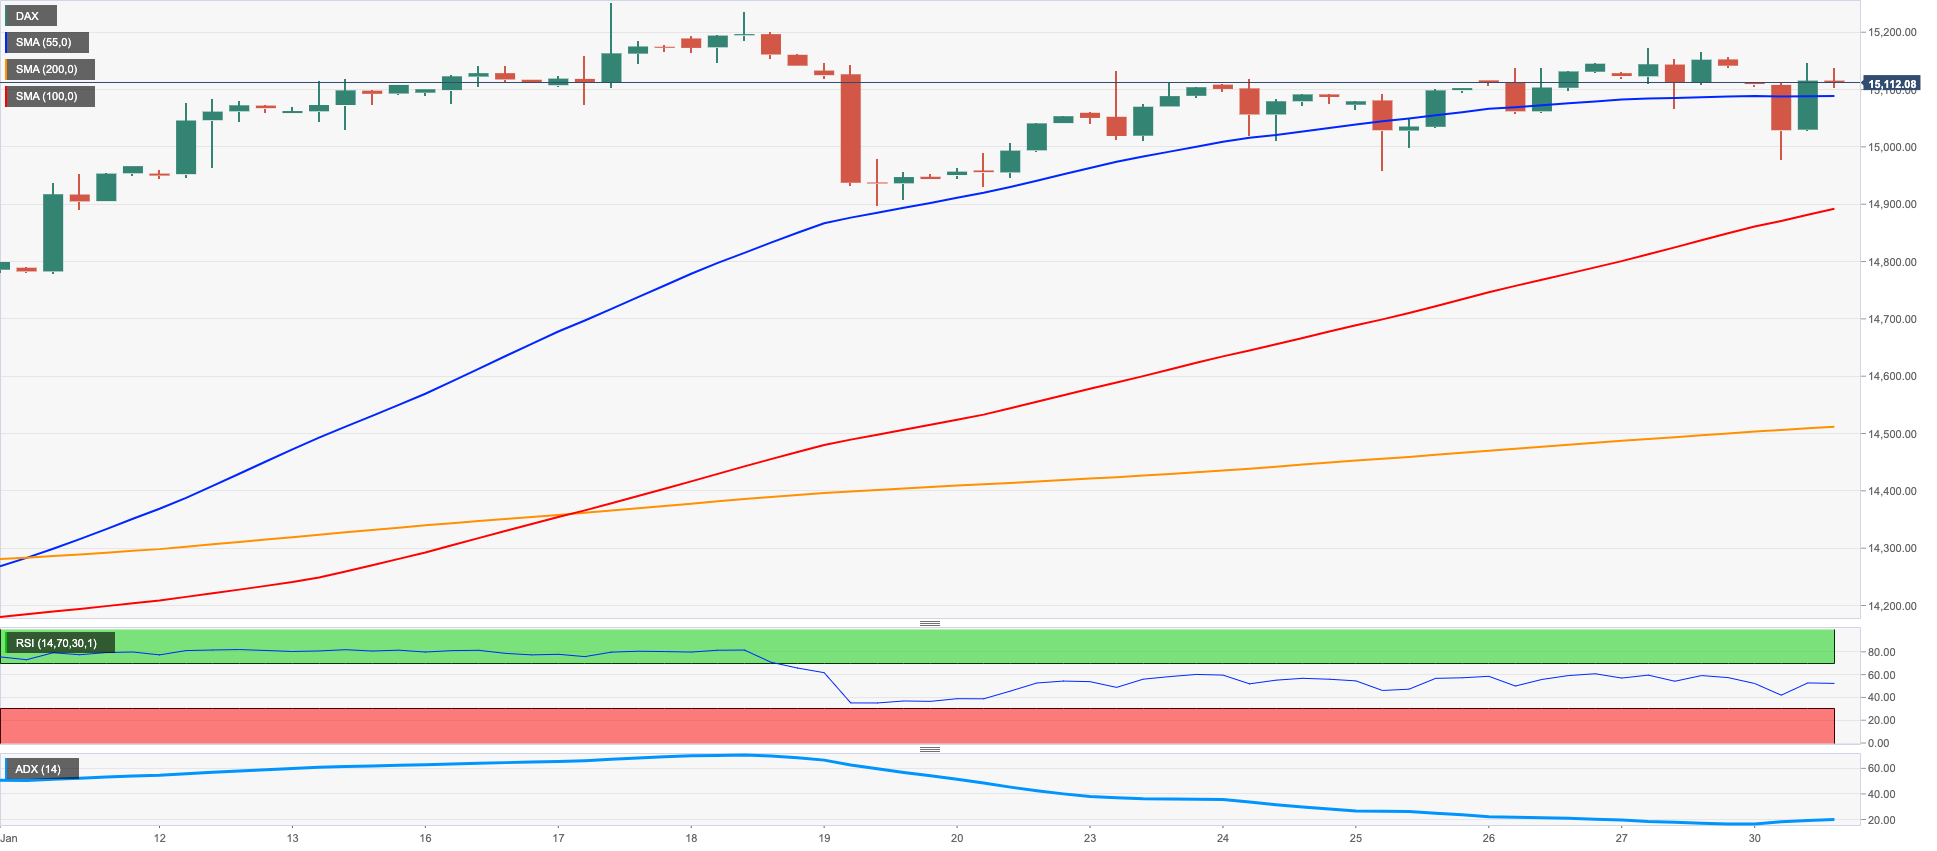
The German stock benchmark DAX 40 left behind two sessions in a row with gains and kicked in the new week marginally on the defensive albeit well above the key 15000 mark.
Investors’ mood was tilted towards the risk-off trade ahead of key interest rate decisions by major central banks due later in the week (Fed, ECB, BoE), while higher-than-expected flash inflation figures in Spain somehow boosted speculation of further (more aggressive?) tightening by the ECB.
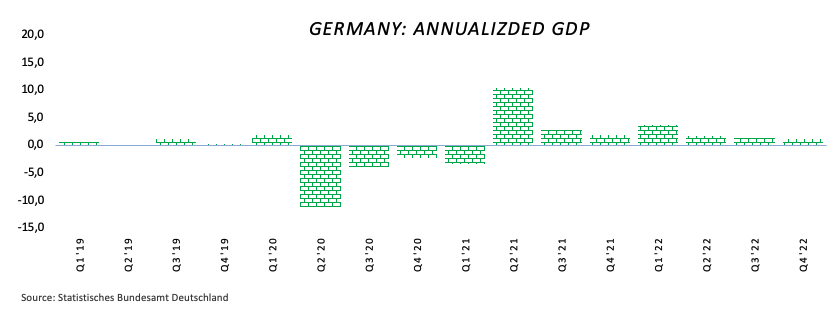
Data wise in Germany, preliminary GDP figures surprised to the downside after the economy is now seen contracting 0.2% QoQ during the October-December period and expanding 1.1% on an annualized basis.
In the money market, the 10-year Bund yields extended the rebound to 4-week highs past the 2.30% level.
While the DAX 40 remains within a consolidative range, it faces the next up barrier at the 2023 peak at 15262 (January 17) ahead of the round level at 16000 and the 2022 high at 16285 (January 5). On the other hand, there is initial support at the weekly low at 14906 (January 19) before the provisional 55-day SMA at 14494 and the December 2022 low at 13791 (December 20). Down from here lines up the key 200-day SMA at 13617 ahead of the November 2022 low at 13022 (November 3) and the minor support at 12548 (October 21 2022). The daily RSI receded a tad below 66.
Best Performers: Beiersdorf AG, SAP, Merck
Worst Performers: Infineon, Continental AG, Zalando SE
Resistance levels: 15186 15269 15542 (4H chart)
Support levels: 14969 14906 14542 (4H chart)
NASDAQ
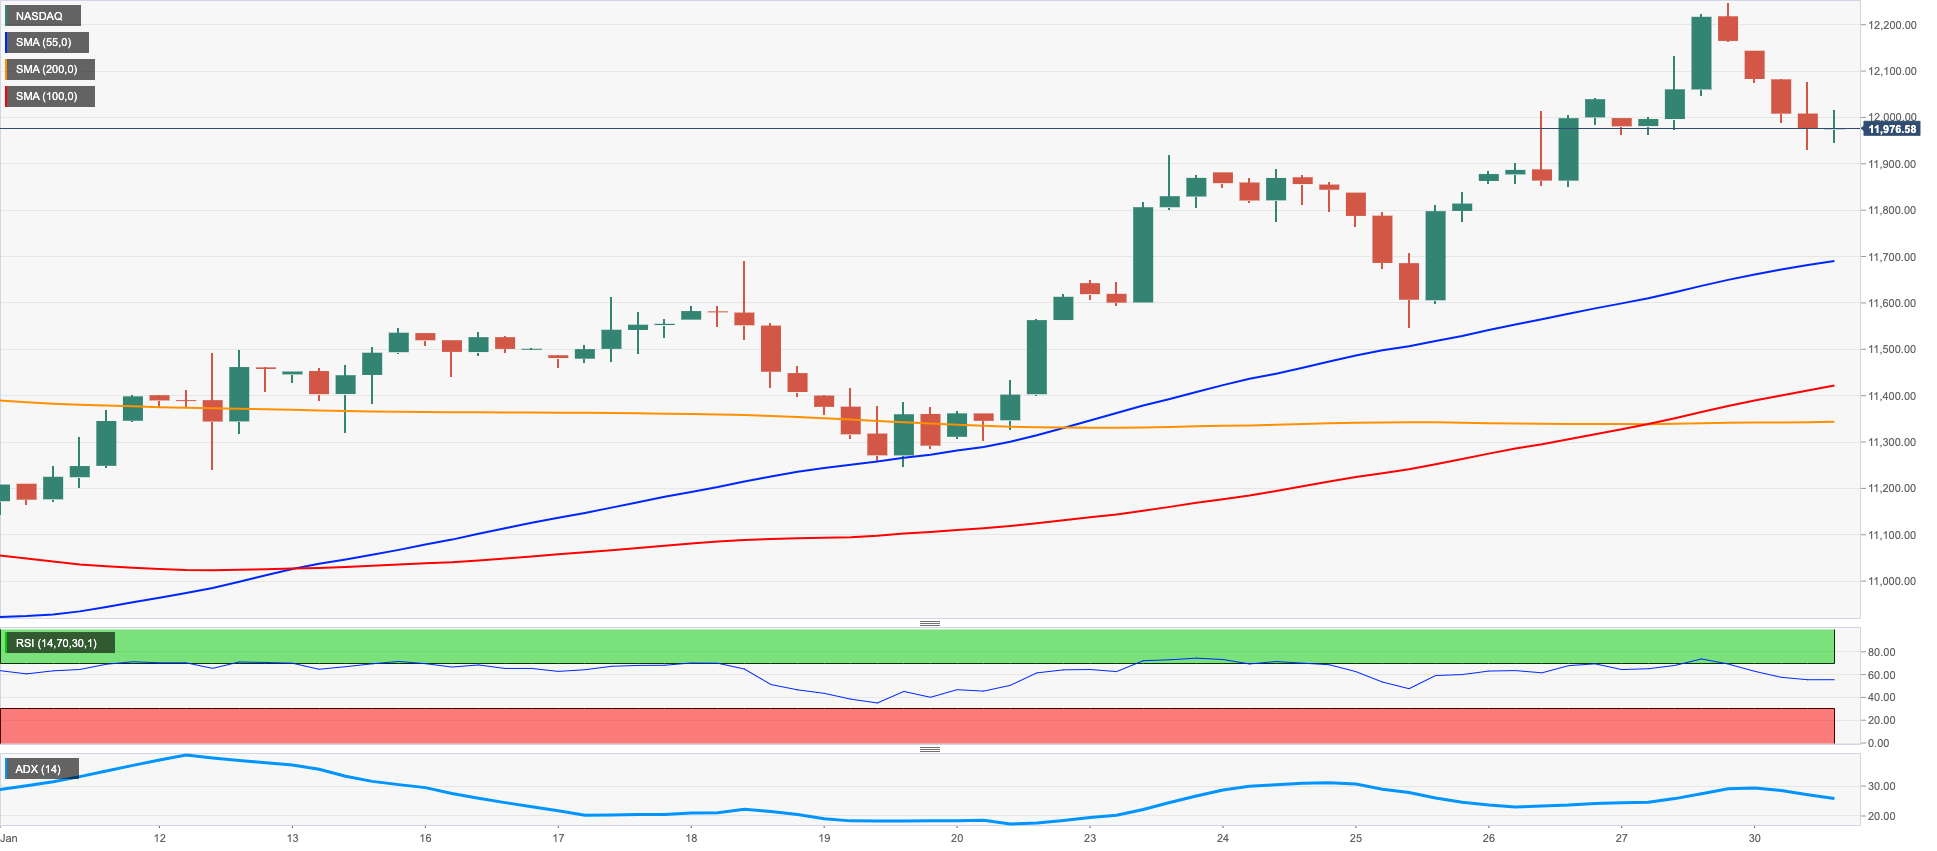
Tech equities gauged by the Nasdaq 100 snapped two consecutive daily advances and retreated markedly at the beginning of the week, putting the 15000 level to the test at the same time.
Indeed, the tech sector succumbed to the increasing cautiousness among traders ahead of the most likely 25 bps rate hike by the Federal Reserve at its February 1 meeting, while the ECB and the BoE are seen following suit albeit by a 50 bps rate raise on the following day.
In addition, megacaps Alphabet, Apple and Amazon traded in a poor fashion ahead of their corporate earnings results expected later in the week.
So far, the Nasdaq 100 should clear the 2023 peak at 12248 (January 27) to allow for gains to accelerate to the September 2022 top at 12752 (September 12). On the contrary, immediate contention turns up the weekly low at 11550 (January 25) ahead of another weekly low at 11251 (January 19) and followed by the January low at 10696 (January 6). Once breached, the index could see the December 2022 low at 10671 (December 22) retested prior to the November 2022 low at 10632 (November 4) and the 2022 low at 10440 (October 13). The daily RSI deflated to the proximity of 62.
Top Gainers: O’Reilly Automotive, Paychex, Enphase
Top Losers: Lucid Group, Rivian Automotive, Pinduoduo
Resistance levels: 12248 12752 13175 (4H chart)
Support levels: 11928 11550 11446 (4H chart)
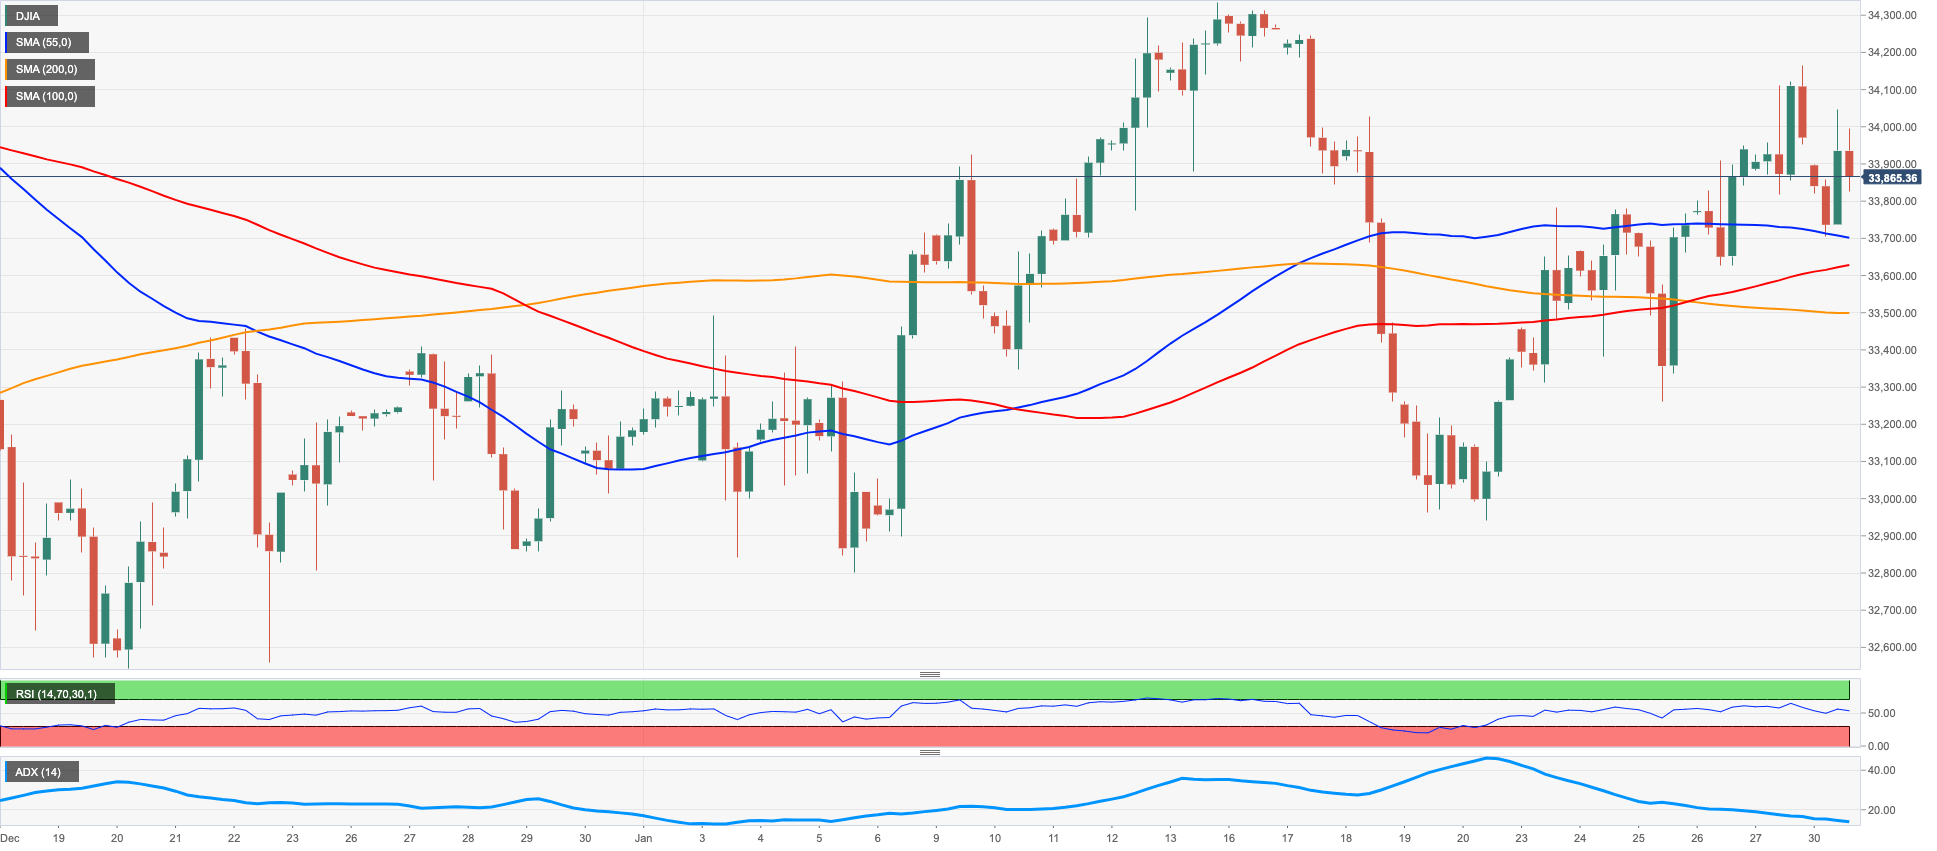
DOW JONES
The cautious tone prevailed among investors ahead of key central bank meetings due later in the week as well as the key US labour market report due towards the end of the week.
Against that backdrop, US equities tracked by the Dow Jones started the week slightly on the defensive and slipped back to the negative territory for the first time after six consecutive advances.
Further gains in the greenback and higher US yields also undermined investors’ sentiment and favoured the corrective decline on Monday.
On the whole, the Dow Jones dropped 0.33% to 33867, the S&P500 retreated 0.88% to 4034 and the tech-benchmark Nasdaq Composite deflated 1.59% to 11436.
The Dow Jones continues to face the immediate up barrier at the weekly high at 34164 (January 27) prior to the 2023 top at 34342 (January 13) and the December 2022 high at 34712 (December 13). The breakout of the latter could prompt a test of the April 2022 top at 35492 to emerge on the horizon ahead of the February 2022 top at 35824 (February 9). Just the opposite, the 55-day SMA at 33618 offers interim support ahead of the weekly low at 32948 (January 20). A deeper drop could revisit the December 2022 low at 32573 (December 22) ahead of the key 200-day SMA at 32348 and the November 2022 low at 31727 (November 3).The daily RSI remained stable near the 57 zone.
Top Performers: Goldman Sachs, American Express, Verizon
Worst Performers: J&J, Chevron, Microsoft
Resistance levels: 34164 34342 34712 (4H chart)
Support levels: 33273 32948 32573 (4H chart)
MACROECONOMIC EVENTS

All Information & Updates provided by:

All information relating to the financial markets available on this page has been prepared and issued by FXStreet (Forexstreet SL, Spain, Reg: B62498233) on the basis of publicly available information and all information believed to be reliable and does not conflict with Kuwaiti local laws, and all necessary care has been taken to before the company to ensure that the facts mentioned are correct from the source.
NCM Investment nor any of its directors or employees shall in any way be held responsible for the contents of this news, and the information contained on this page is intended only to provide clients with publicly available information and should not be construed as investment advice, report or analysis and/or constitute an offer or invitation to buy or sell financial instruments of any kind.
RISK WARNING: Forex and CFDs are highly risky leveraged products, as losses can exceed deposits. Please ensure you understand all the risks and take independent advice if necessary. NCM will segregate the clients based on the criteria of the regulator and its bylaws. NCM does not provide any advisory service; the material published does not constitute advice or a recommendation for a transaction in any financial instrument. NCM accepts no responsibility for any use of the content presented and any consequences of that use. Anyone acting on the information provided does so at their own risk.