
- Contact Us:
-

-

-

-


Daily Market Updates
01 Feb 2023
USDJPY
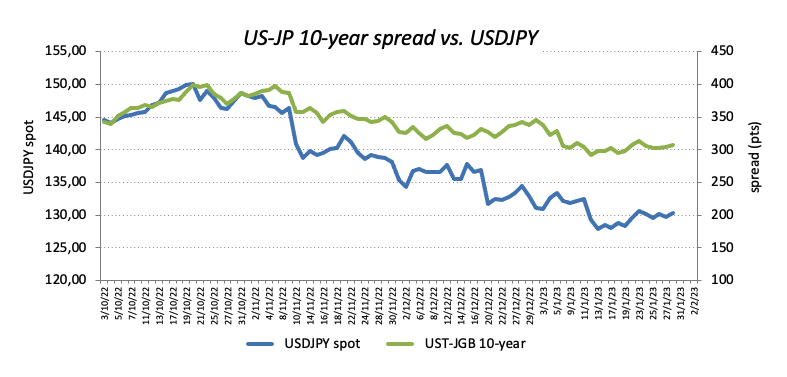
USD/JPY kept the choppiness well and sound on Tuesday, this time fading the optimism seen at the beginning of the week and coming under some renewed pressure on the back of a weak dollar and soft US yields.
The pair, in the meantime, maintained the side-lined fashion around the 130.00 region, always amidst persistent investors’ prudence ahead of the FOMC event on Wednesday.
In the Japanese debt market, the JGB 10-year yields extended the upside bias and flirted with the 0.50% level.
In Japan, December data releases saw the Unemployment Rate unchanged at 2.5% and the Jobs/Applications ratio at 1.35. In addition, preliminary readings now see Industrial Production contracting 2.8% YoY, while Retail Sales expanded 3.8% over the last twelve months and Housing Starts contracted at an annualized 1.7%. Finally, the Consumer Confidence improved slightly to 31 in January.
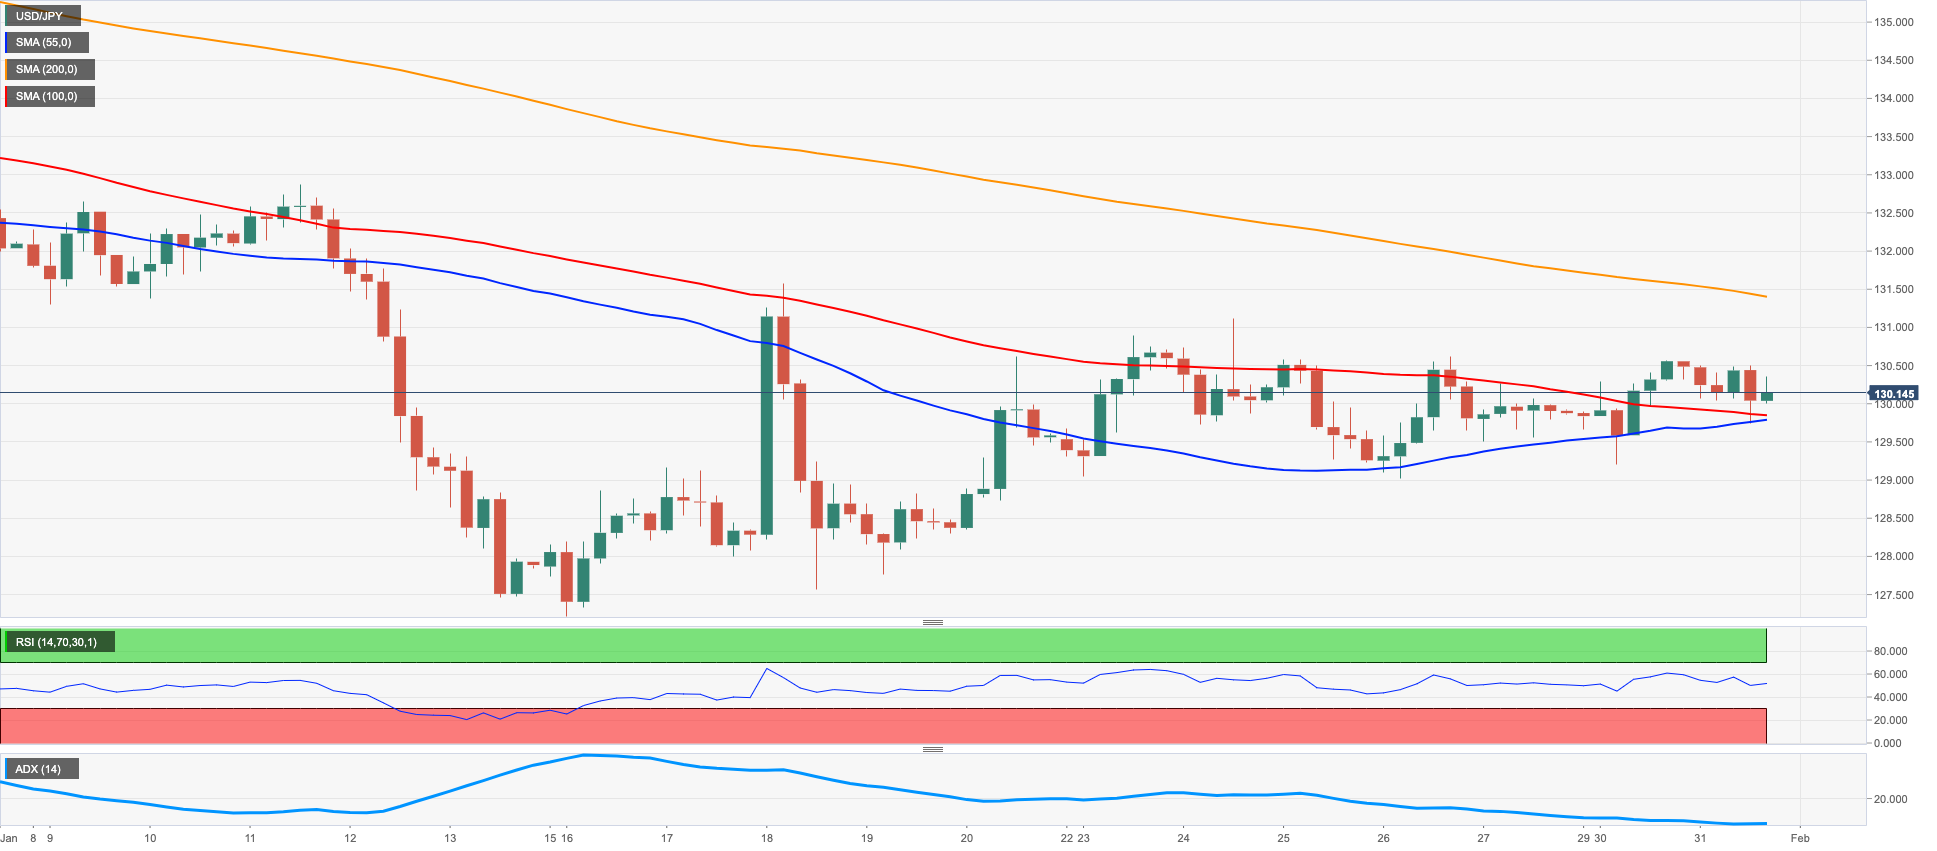
USD/JPY remains consolidative and a breakout of this pattern could prompt a test of the weekly peak at 131.11 (January 24) to emerge on the horizon before another weekly high at 131.57 (January 20) and the 2023 top at 134.77 (January 6). The surpass of this level could pave the way for a move to the key 200-day SMA at 136.76 ahead of weekly tops at 138.17 (December 15 2022) and 139.89 (November 30 2022), all before the key round level at 140.00. On the flip side, there is an initial contention at the 2023 low at 127.21 (January 16) ahead of the May 2022 low at 126.36 (May 24) and the weekly low at 121.27 (March 31 2022). The daily RSI shed some ground and breached 45.
Resistance levels: 130.61 131.11 131.53 (4H chart)
Support levels: 129.19 129.02 127.56 (4H chart)
GBPUSD
GBP/USD retreated to multi-session lows and revisited the sub-1.2300 region on Tuesday. Despite spot managed to find some footing afterwards, it kept the ongoing negative performance unchanged for the third session in a row.
In fact, Cable lost further ground despite the daily pullback in the greenback and the markets’ bias towards the risk-on trade, all prior to key monetary policy meetings by the FOMC, ECB and the BoE.
Data wise in the UK, Mortgage Approvals shrank to 35.612K in December and Mortgage Lending eased to £3.238B in the same month.
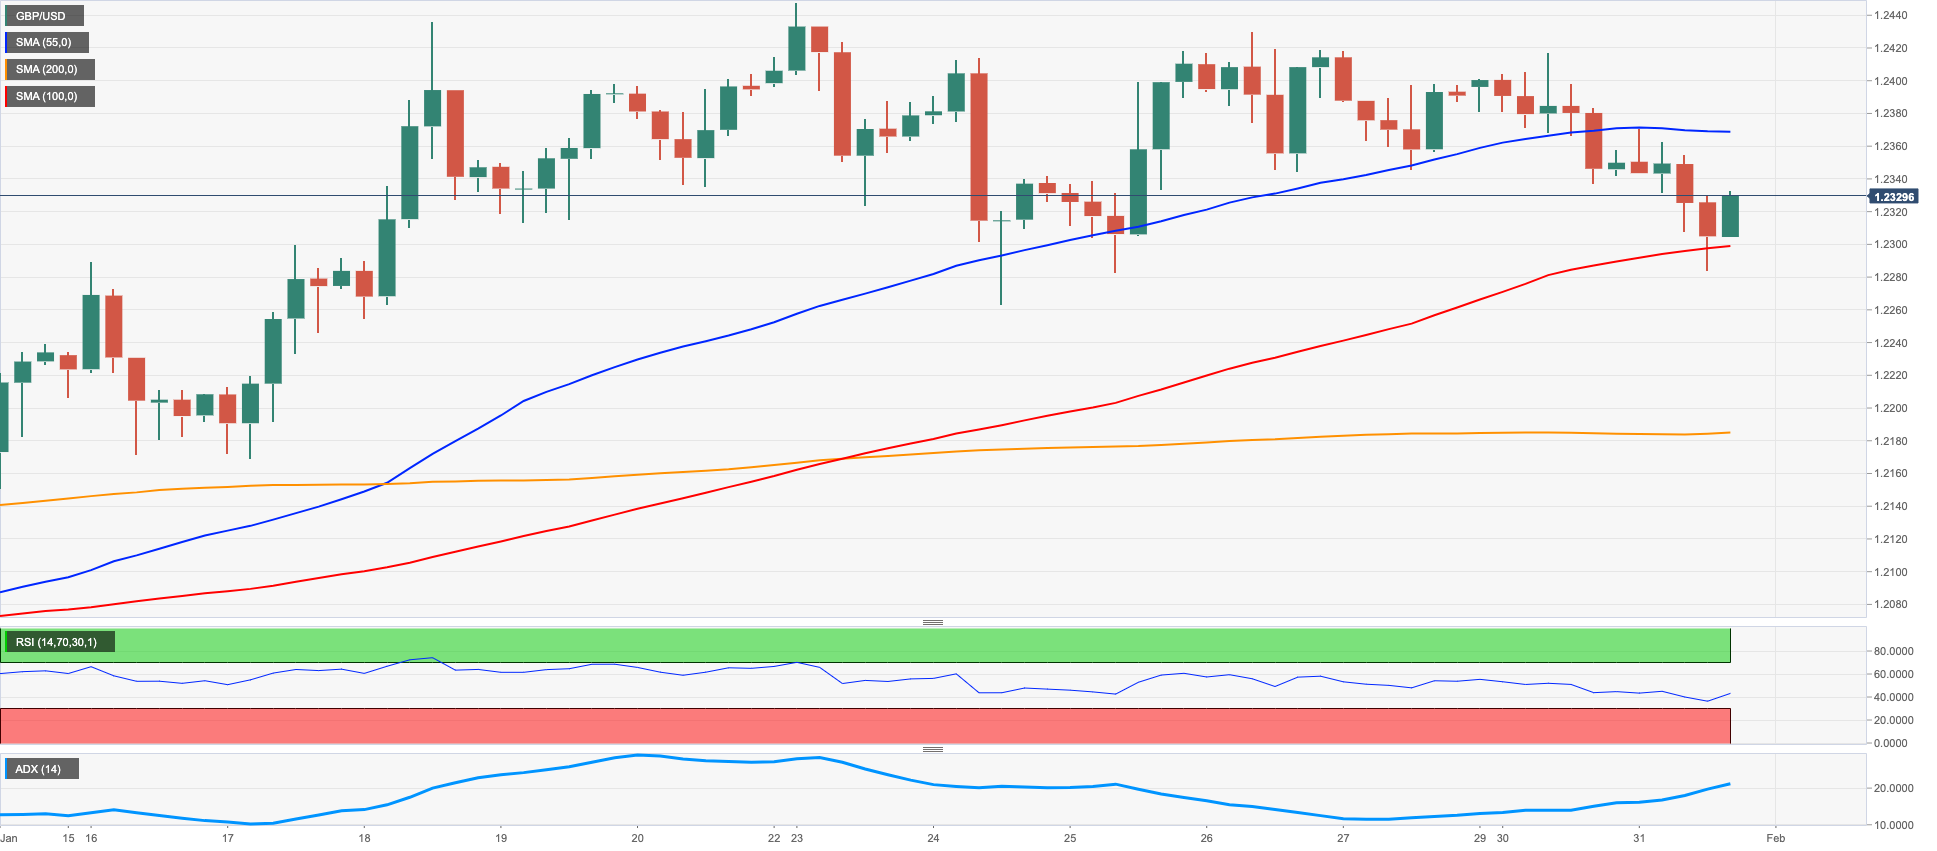
Extra weakness in GBP/USD could put the weekly low at 1.2263 (January 24) to the test prior to the interim 55-day SMA at 1.2152 and the weekly low at 1.2084 (January 12). Once the latter is cleared, the pair could then challenge the round level at 1.2000 before the key 200-day SMA at 1.1957 seconded by the January low at 1.1841 (January 6). By contrast, the big magnet for bulls emerges at the 2023 top at 1.2447 (January 23) seconded by the May 2022 peak at 1.2666 (May 27). Further north turns up the key 200-week SMA at 1.2903 just ahead of the psychological 1.3000 level. The daily RSI shed further ground and flirted with the 57 zone.
Resistance levels: 1.2365 1.2430 1.2447 (4H chart)
Support levels: 1.2295 1.2282 1.2263 (4H chart)
AUDUSD
AUD/USD prolonged the pessimism for the third straight session on the back of the persistent improvement in the greenback on Tuesday.
Indeed, the pair retreated to multi-day lows in the sub-0.7000 region earlier in the session, although some dip buyers re-emerged afterwards and lifted it back to the proximity of Monday’s closing levels.
Another session of positive results in the commodity complex also limited the decline in the Aussie dollar after decent gains in both copper prices and the iron ore, while the recovery in the Chinese manufacturing and services sectors – as per NBS gauges – collaborated with the bounce off daily lows in spot.
In Oz, flash prints showed Retail Sales contracting at a monthly 3.9% in December, while Housing Credit expanded 0.3% from a month earlier.
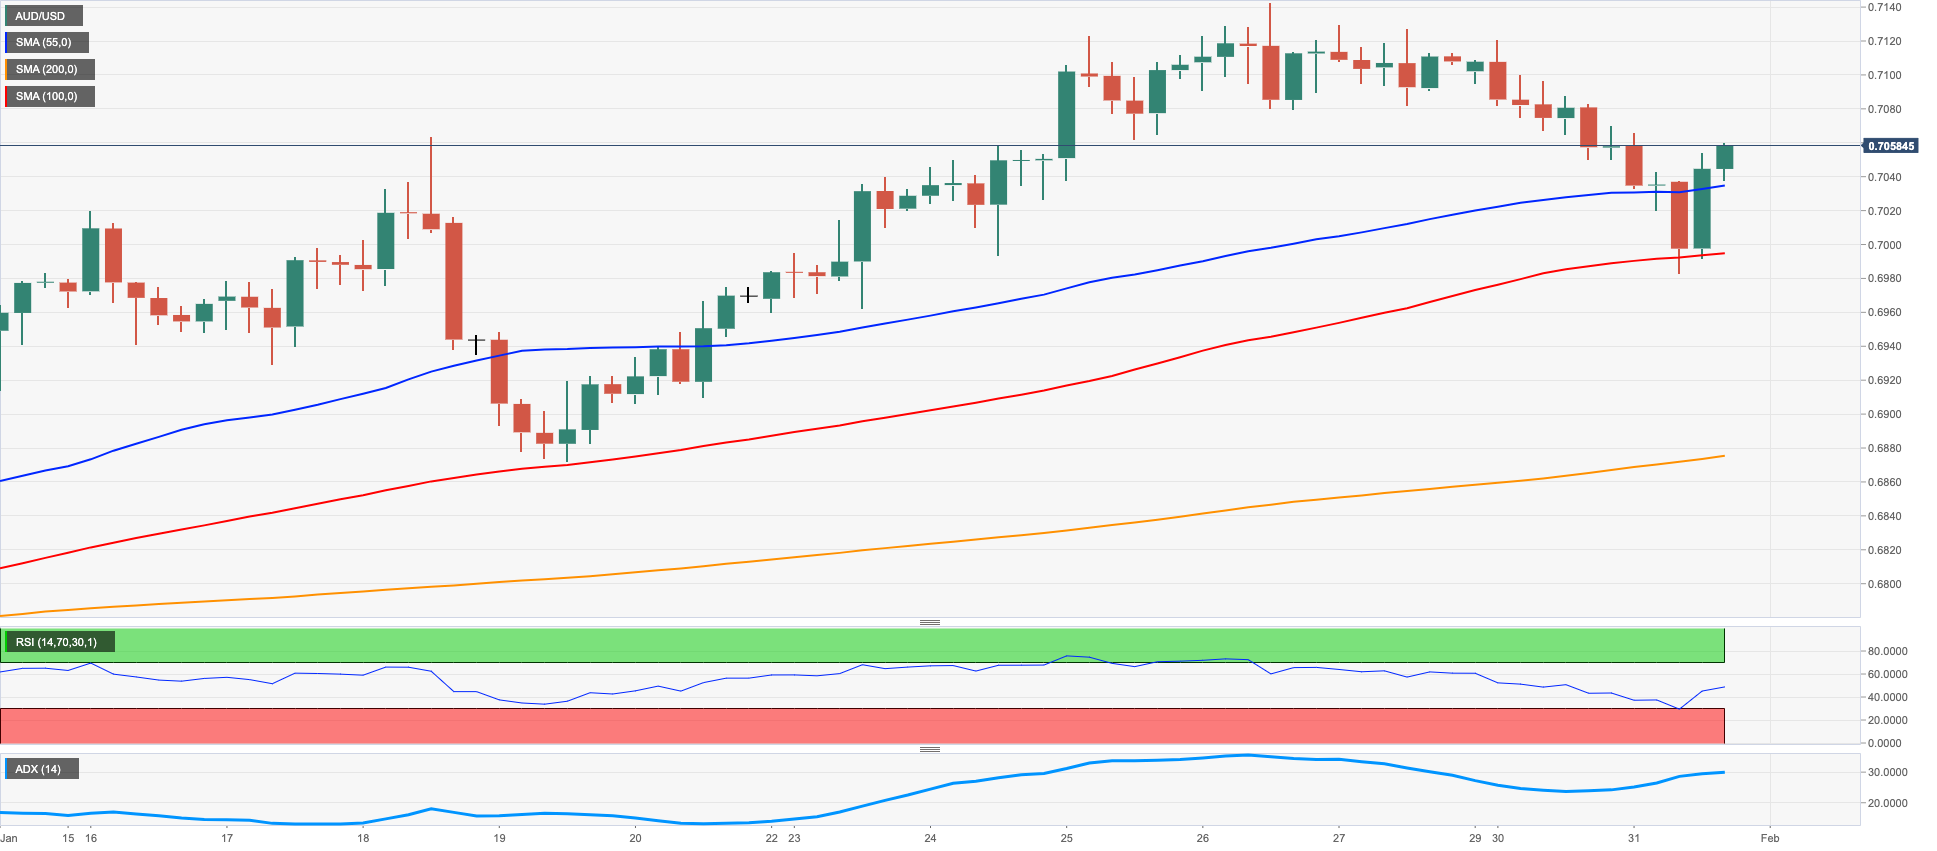
The new weekly low at 0.6983 (January 31) now emerges as the immediate support for AUD/USD. The drop below this level could put the weekly low at 0.6871 (January 19) to the test prior to the key 200-day SMA at 0.6809. Extra decline could see the January low at 0.6688 (January 3) revisited ahead of the December low at 0.6629 (December 20). In the opposite direction, bulls continue to target the 2023 peak at 0.7142 (January 26) seconded by the round level at 0.7200. Further up aligns the June 2022 high at 0.7282 (June 3) before the round level at 0.7300. The daily RSI picked up extra downside traction and approached the 62 region.
Resistance levels: 0.7142 0.7247 0.7282 (4H chart)
Support levels: 0.6983 0.6962 0.6869 (4H chart)
GOLD
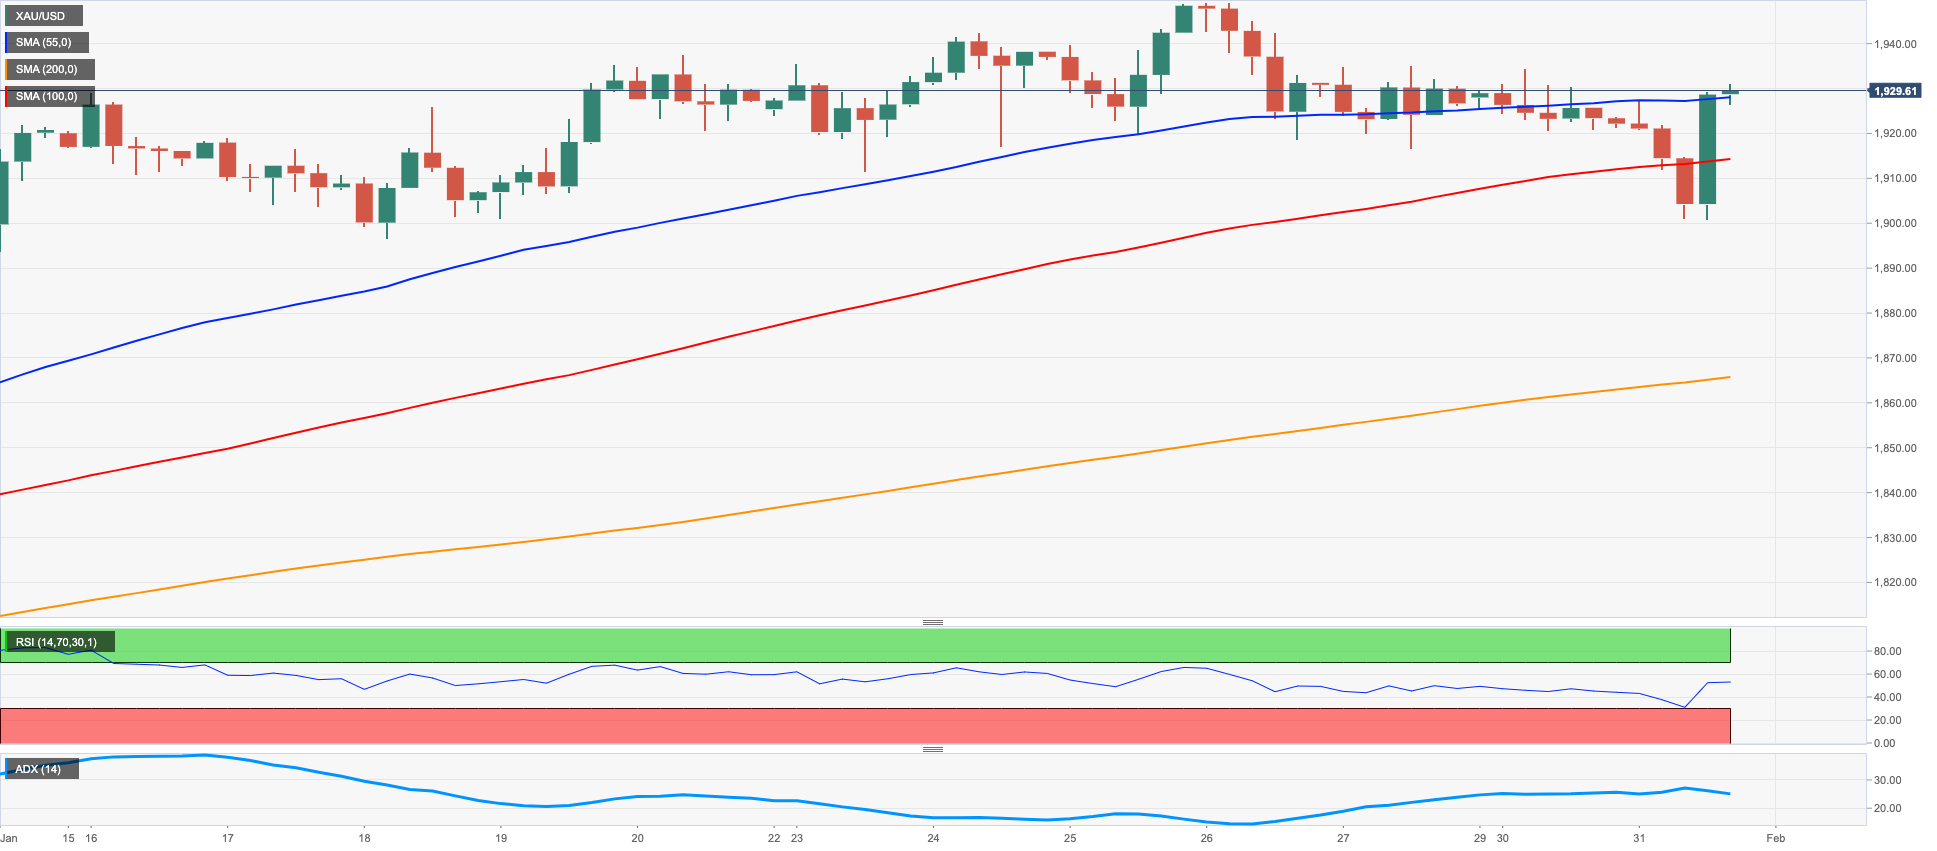
After a volatile session, gold prices managed well to rebound from daily lows in the $1900 neighbourhood to end Tuesday’s session back around the $1930 region.
In fact, the dollar saw its early rebound abruptly trimmed in response to disappointing results from the US labour market, while the mixed-to-bearish performance in US yields across the curve helped with the resumption of the bullish bias in the precious metal.
Bullion, in the meantime, is expected to be under scrutiny in the next couple of sessions, as the FOMC event is due on Wednesday followed by the ECB and BoE gatherings in the following day.
Extra bounce in gold is seen retargeting the 2023 high at $1949 (January) prior to the April 2022 top at $1998 (April 18). Soon after this level appears the psychological $2000 mark seconded by the 2022 peak at $2070 (March 8). Having said that, the weekly low at $1896 (January 18) should offer immediate support followed by another weekly low at $1867 (January 11). South from here comes the interim 55-day SMA at $1827 seconded by the more relevant 200-day SMA at $1776. If bears push harder, then a test of the 100-day SMA at $1757 could emerge on the horizon before the weekly low at $1727 (November 23).
Resistance levels: $1935 $1949 $1955 (4H chart)
Support levels: $1900 $1896 $1863 (4H chart)
CRUDE WTI
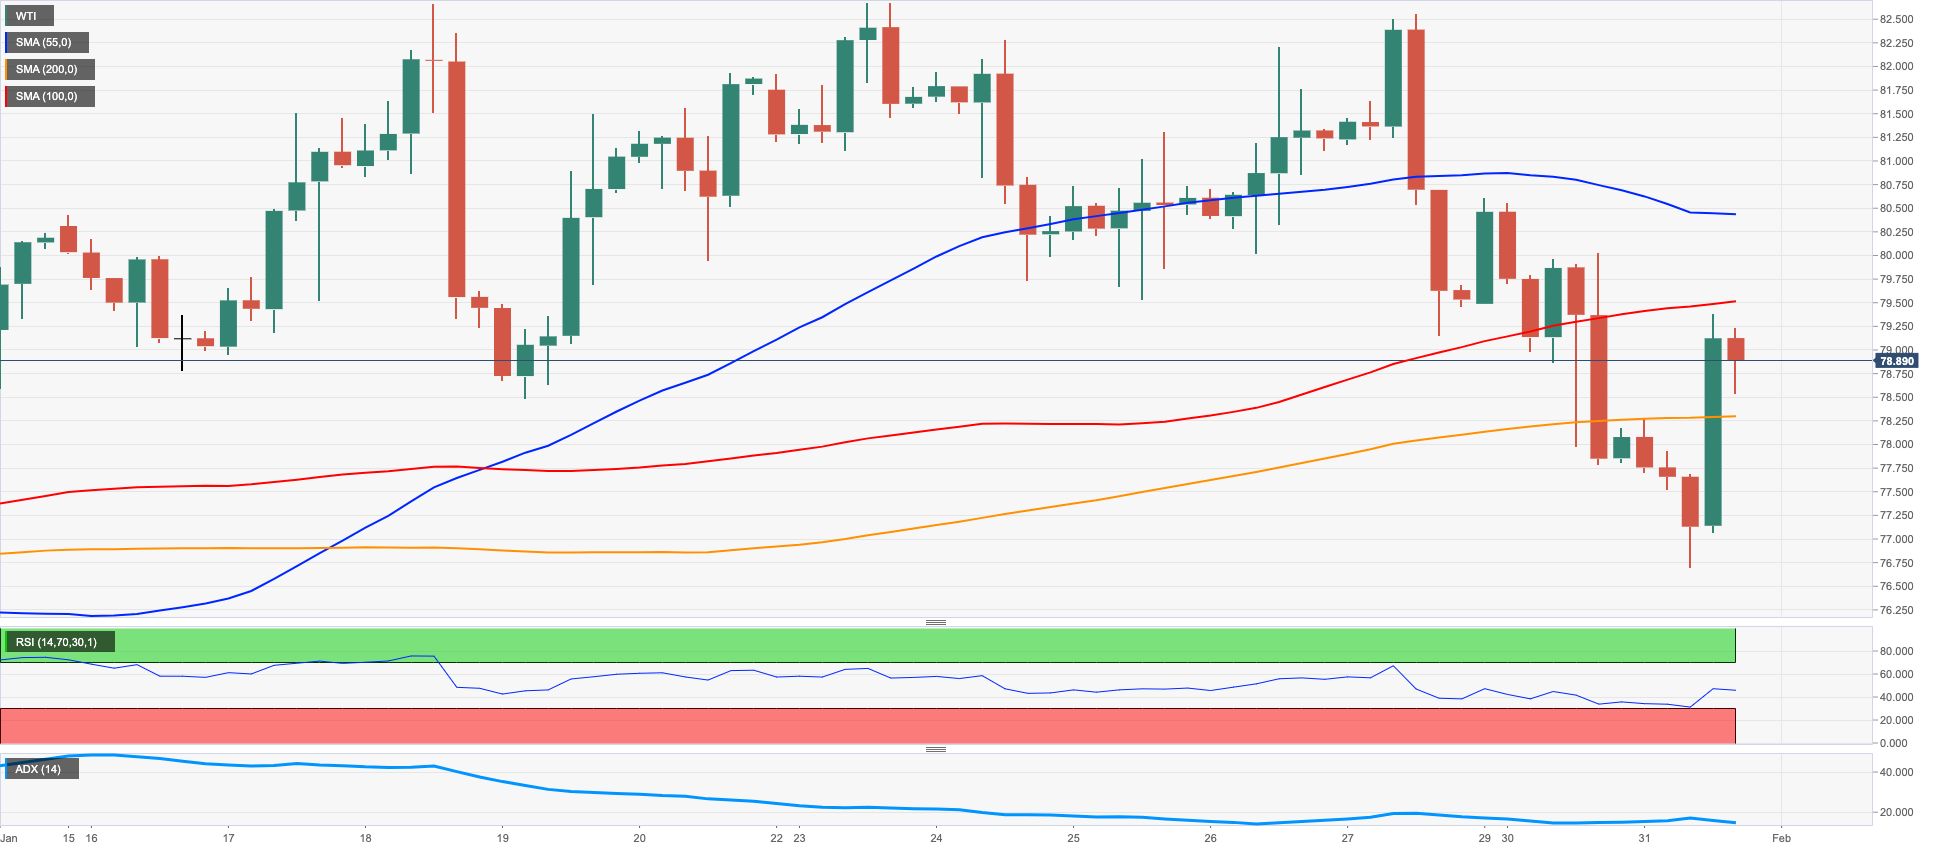
Crude oil prices reversed two consecutive daily pullbacks and regained the $79.00 mark per barrel of the WTI on Tuesday.
The offered stance in the dollar lent support to the recovery in the commodity, which remained propped up by the reopening in China and bets that the OPEC+ will keep its output policy unchanged at its February 1 meeting.
Further legs to the bounce in the WTI came from the rising uncertainty around the Russian oil production vs. the current EU ban on exports and the G7 cap on prices.
Later in the NA session, the API will report on US crude oil inventories in the week to January 27 ahead of the official report by the DoE on Wednesday.
If the recovery in the WTI gathers a more serious impulse, then the next target of note will be at the 2023 peak at $82.60 (January 23), closely followed by the December 2022 high at $83.32 (December 1) and the $90.08 level (November 11 2022). Beyond the latter aligns the 200-day SMA at $92.07 before the November 2022 high at $93.73 (November 7), while the breakout of the weekly top at $97.65 (August 30 2022) is expected to open the door to a probable test of the key $100.00 mark per barrel. In the opposite way, the breakdown of the weekly low at $76.61 (January 31) should lead up to a deeper drop to the 2023 low at $72.50 (January 5) prior to the 2022 low at $70.10 (December 9) and just ahead of the key round level at $70.00.
Resistance levels: $79.21 $80.26 $82.44 (4H chart)
Support levels: $767.61 $73.81 $72.42 (4H chart)
GER40
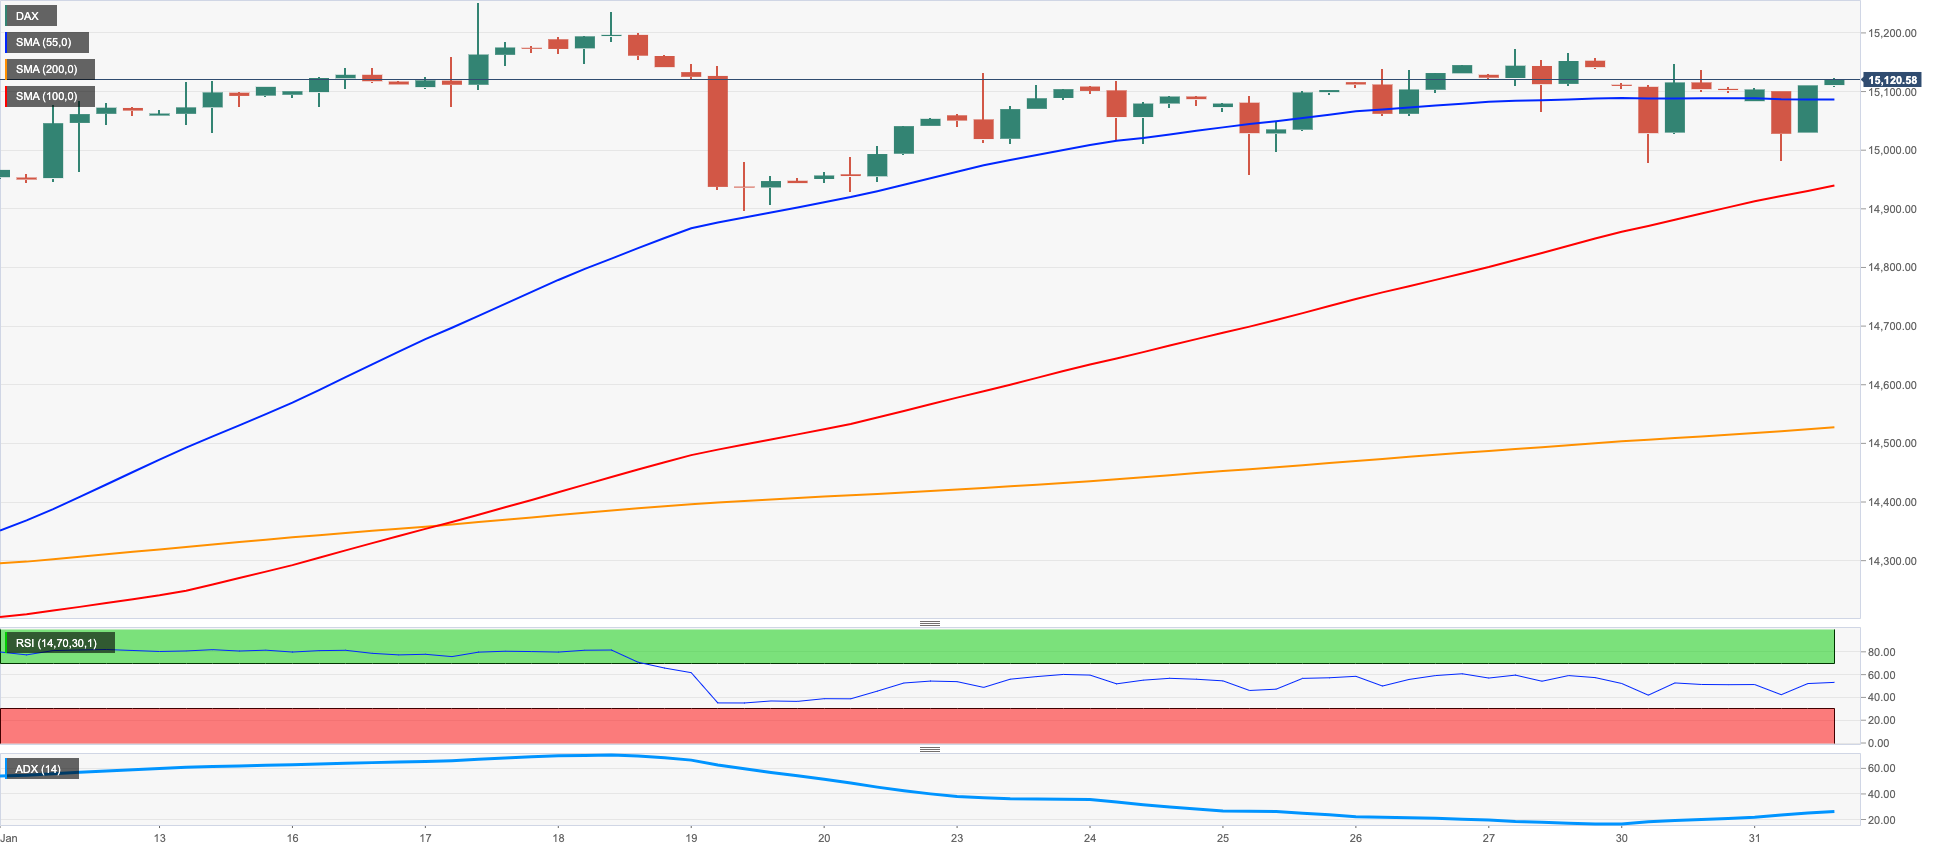
German equities closed around Monday’s levels around the 15100 region when gauged by the benchmark DAX 40 amidst a narrow trading range and increasing cautiousness ahead of the FOMC and ECB meetings on Wednesday and Thursday, respectively.
Despite Tuesday’s marginal advance, the German index gained more than 8% in the first month of the new trading year on the back of alleviated concerns around a recession in the euro bloc – and specially in Germany – the reopening in China and dwindling fears around the energy crisis.
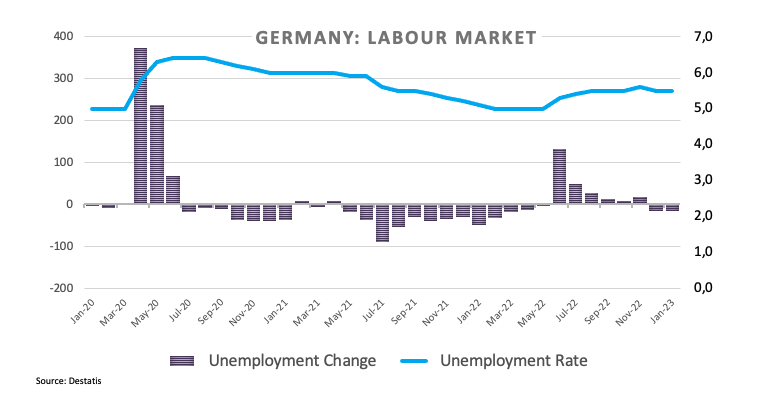
In the German docket, Retail Sales contracted at a monthly 5.3% in December and 6.4% vs. the same month of 2021. Additionally, the Unemployment Rate remained at 5.5% in January and the Unemployment Change dropped by 15K persons in the same period.
The small gain in the index contrasted with a knee-jerk in the German 10-year Bund yields after three daily gains in a row.
Immediately to the upside in the DAX 40 emerges the 2023 high at 15262 (January 17) prior to the round level at 16000 and the 2022 top at 16285 (January 5). Just the opposite, the weekly low at 14906 (January 19) is seen holding the downside ahead of the temporary 55-day SMA at 14509 and the December 2022 low at 13791 (December 20). The breach of this region could put the key 200-day SMA at 13623 to the test followed by the November 2022 low at 13022 (November 3) and the minor support at 12548 (October 21 2022). The daily RSI stayed flat-lined above 65.
Best Performers: MBW ST, Dr Ing hc F Porsche AG, SAP
Worst Performers: Fresenius Medical Care KGAA ST, Sartorius AG VZO, Merck
Resistance levels: 15186 15269 15542 (4H chart)
Support levels: 14969 14906 14584 (4H chart)
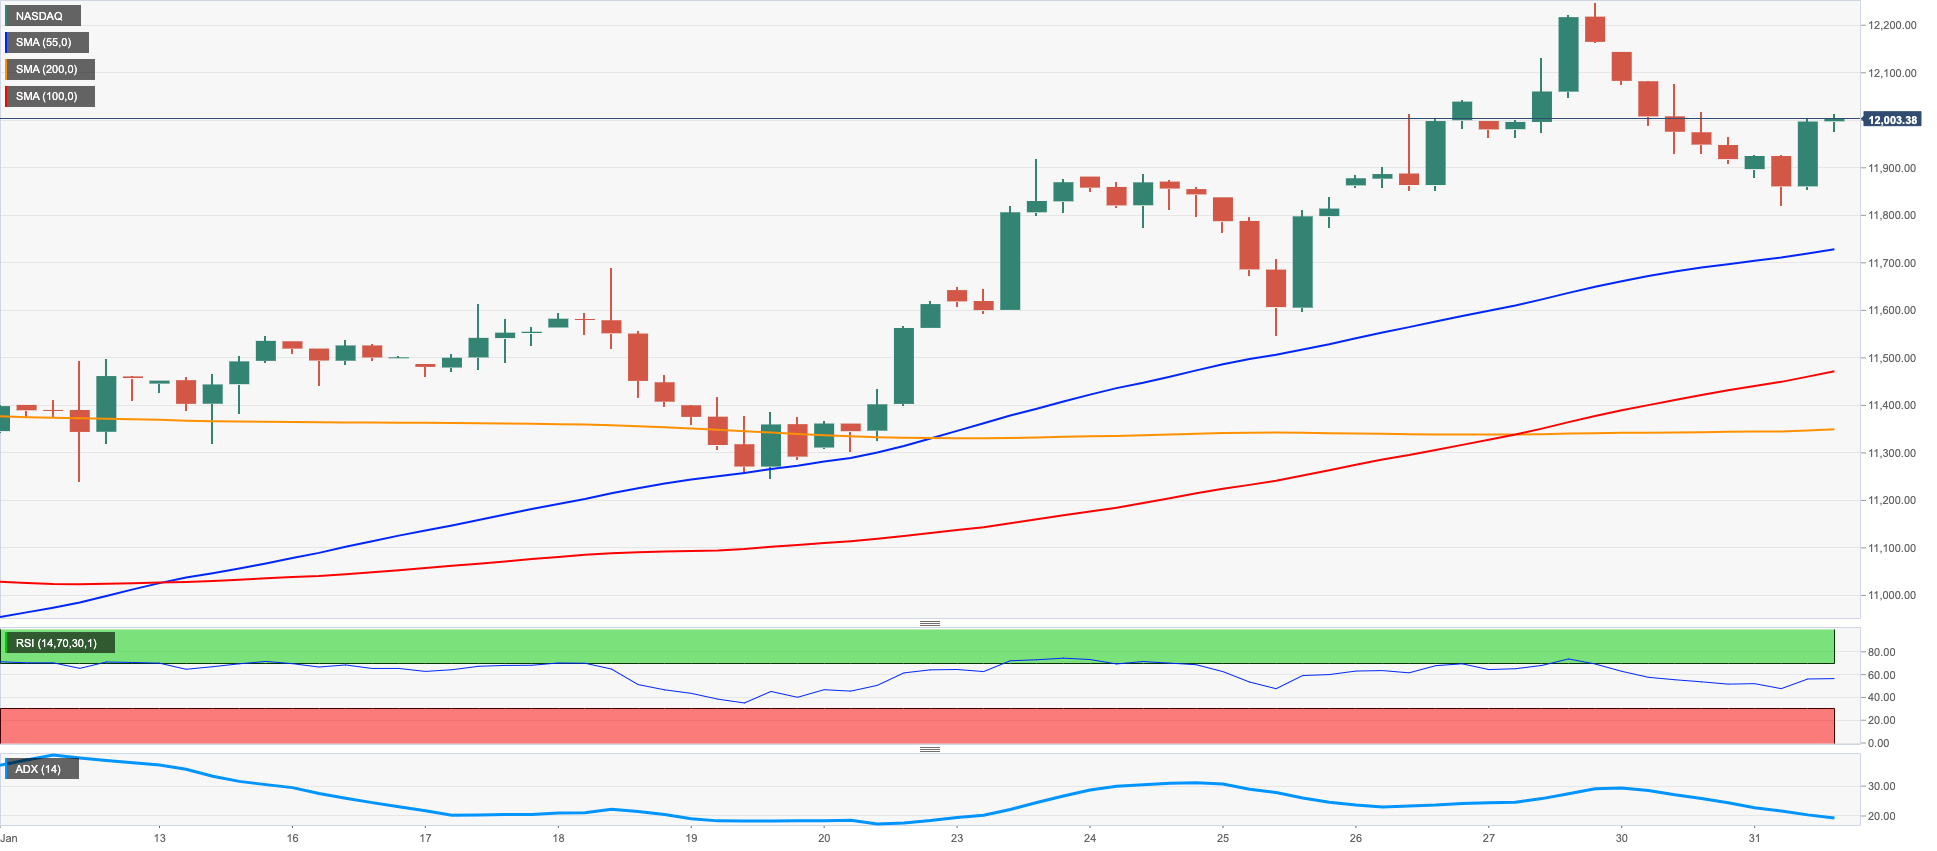
NASDAQ
The tech reference Nasdaq 100 followed the rest of its US peers and left behind the negative start of the week, resuming the uptrend amidst the soft tone in the dollar and lower yields.
Indeed, traders preferred to look at the “glass-half-full” ahead of the most likely 25 bps rate raise by the Fed at its meeting on Wednesday, while poor prints from the US Employment Cost Index in Q4 and the January Consumer Confidence lent further wings to the view of a potential pivot in the Fed’s monetary stance.
Optimism, in the meantime, remained high in light of upcoming corporate results from tech megacaps Amazon, Alphabet and Apple among others.
The Nasdaq 100 continues to face the next up barrier at the 2023 high at 12248 (January 27) before the September 2022 peak at 12752 (September 12) and the round level at 13000. On the other hand, the weekly low at 11550 (January 25) is expected to come first ahead of another weekly low at 11251 (January 19) and the January low at 10696 (January 6). The loss of the latter could prompt the December 2022 low at 10671 (December 22) to return to the investors’ radar before the November 2022 low at 10632 (November 4) and the 2022 low at 10440 (October 13). The daily RSI rebounded to the 62 zone.
Top Gainers: Rivian Automotive, Lam Research, Tesla
Top Losers: Moderna, Micron, Sirius XM
Resistance levels: 12248 12752 13175 (4H chart)
Support levels: 11928 11550 11446 (4H chart)
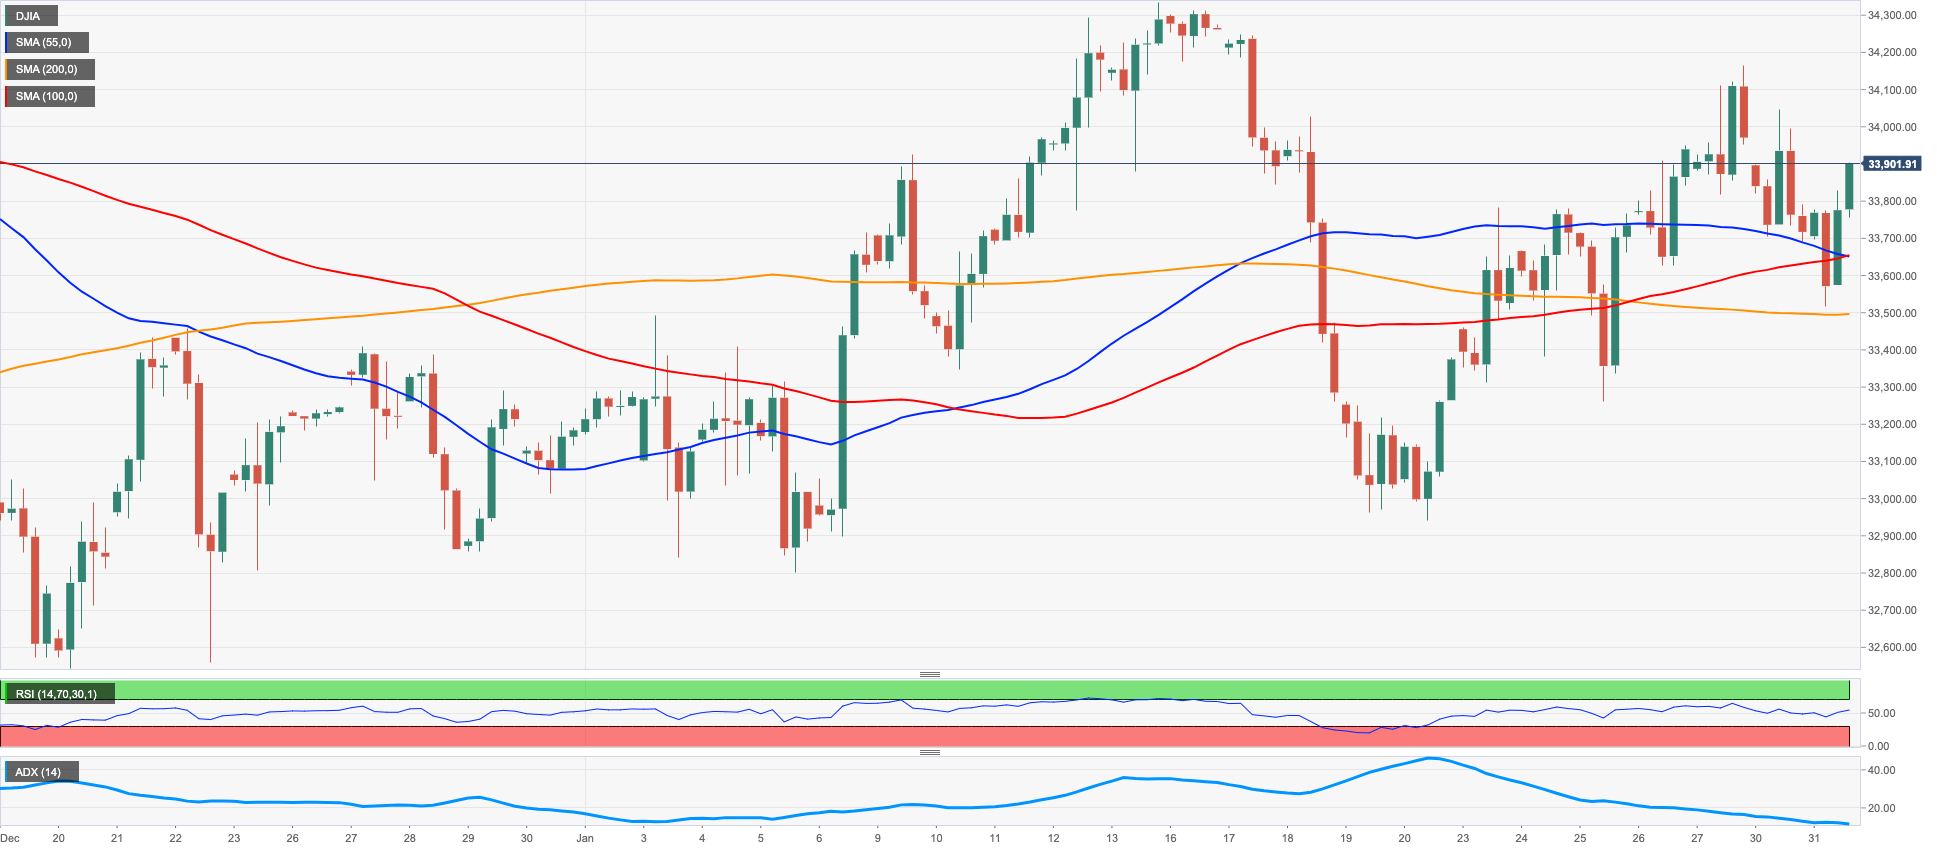
DOW JONES
The post-data drop in the greenback in collaboration with the knee-jerk in US yields helped improve the sentiment in the risk-associated universe and prompted equities tracked by the three major US stock indices to resume the upside and leave behind Monday’s daily decline.
Indeed, disappointing results from the US labour market during the October-December period (Employment Cost Index) lent support to the Fed’s pivot narrative and lifted spirits among investors, while a drop in US Consumer Confidence also added to this view, all ahead of the largely telegraphed 25 bps rate hike by the Fed at its meeting on Wednesday.
That said, the Dow Jones advanced 0.47% to 33875, the S&P500 gained 0.82% to 4050 and the tech-heavy Nasdaq Composite rose 1.10% to 11519.
The surpass of the weekly top at 34164 (January 27) should motivate the Dow Jones to set sails to the 2023 peak at 34342 (January 13) followed by the December 2022 top at 34712 (December 13). North from here emerges the April 2022 peak at 35492 before the February 2022 peak at 35824 (February 9). Conversely, there is an initial interim contention at the 55-day SMA at 33638 prior to the weekly low at 32948 (January 20) and the December 2022 low at 32573 (December 22). The breakdown of this level exposes the key 200-day SMA at 32343 seconded by the November 2022 low at 31727 (November 3).The daily RSI advanced modestly to the proximity of 55.
Top Performers: Home Depot, UnitedHealth, Dow
Worst Performers: Caterpillar, McDonald’s, IBM
Resistance levels: 34164 34342 34712 (4H chart)
Support levels: 33273 32948 32573 (4H chart)
MACROECONOMIC EVENTS

All Information & Updates provided by:

All information relating to the financial markets available on this page has been prepared and issued by FXStreet (Forexstreet SL, Spain, Reg: B62498233) on the basis of publicly available information and all information believed to be reliable and does not conflict with Kuwaiti local laws, and all necessary care has been taken to before the company to ensure that the facts mentioned are correct from the source.
NCM Investment nor any of its directors or employees shall in any way be held responsible for the contents of this news, and the information contained on this page is intended only to provide clients with publicly available information and should not be construed as investment advice, report or analysis and/or constitute an offer or invitation to buy or sell financial instruments of any kind.
RISK WARNING: Forex and CFDs are highly risky leveraged products, as losses can exceed deposits. Please ensure you understand all the risks and take independent advice if necessary. NCM will segregate the clients based on the criteria of the regulator and its bylaws. NCM does not provide any advisory service; the material published does not constitute advice or a recommendation for a transaction in any financial instrument. NCM accepts no responsibility for any use of the content presented and any consequences of that use. Anyone acting on the information provided does so at their own risk.