
- Contact Us:
-

-

-

-


Daily Market Updates
03 Feb 2023
USDJPY
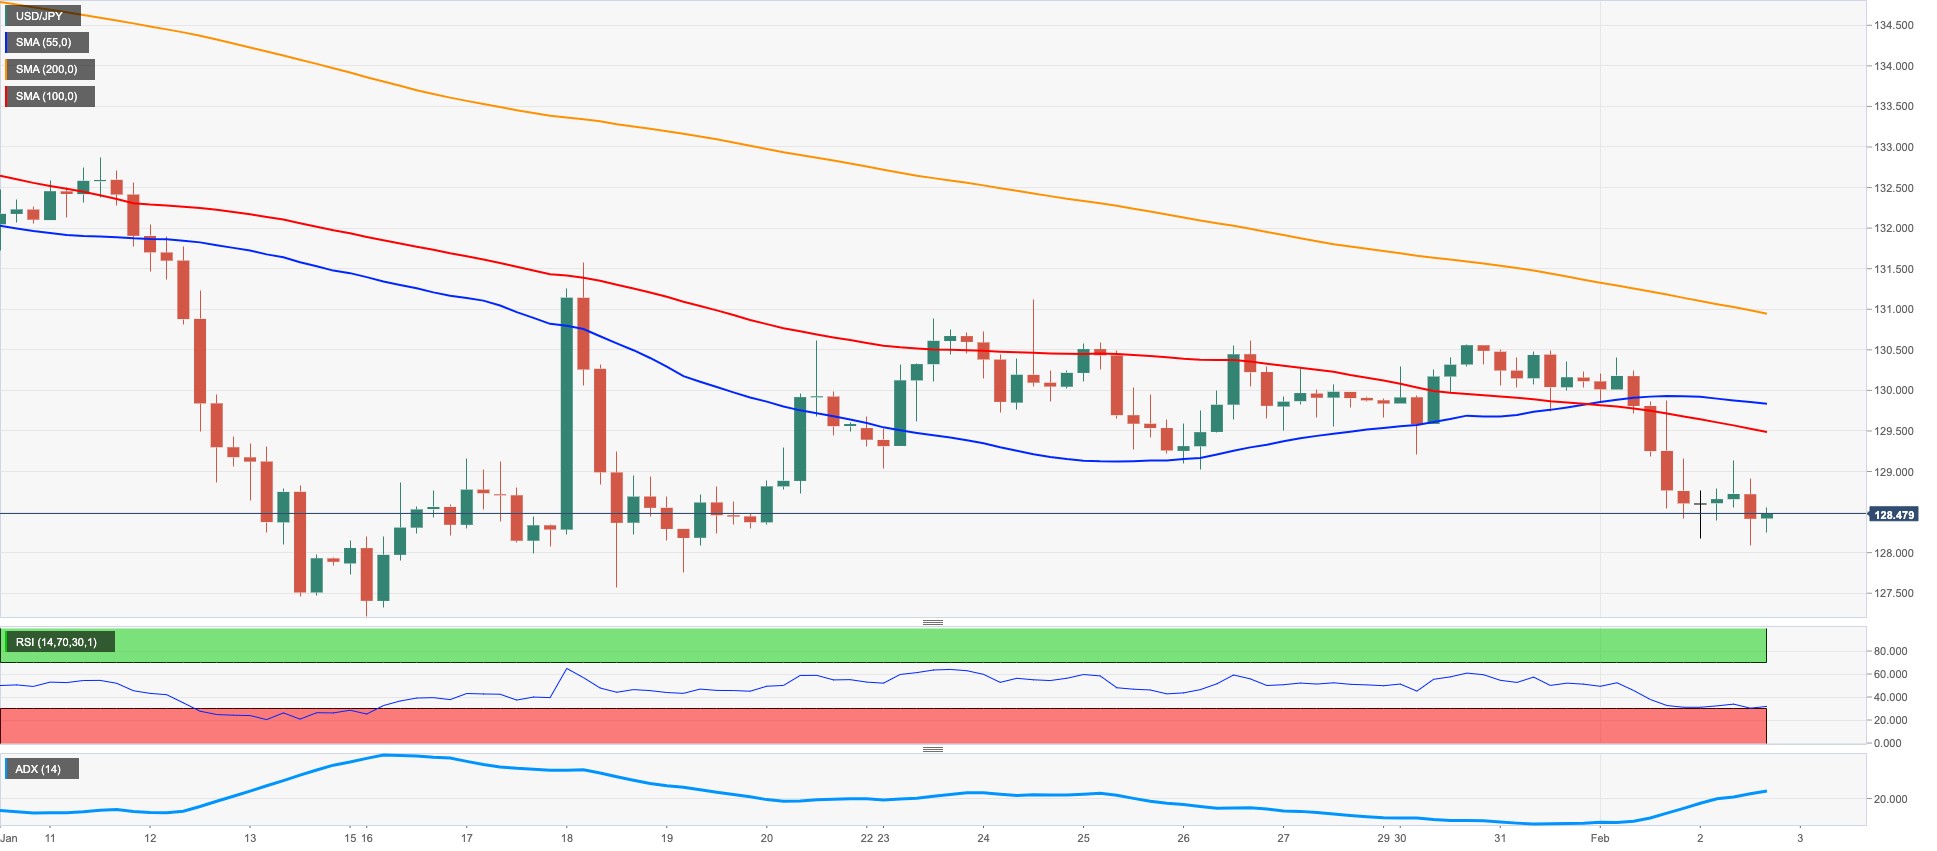
USD/JPY clinched the third consecutive daily pullback on Thursday, this time printing multi-session lows near the 128.00 neighbourhood.
The downtick in the pair came despite the recovery in the dollar and was accompanied by the continuation of the bearish tone in the US money markets, where yields extended further their weekly decline.
News from the BoJ saw member Wakatabe stressing that the central bank will continue to execute monetary policy to clinch the inflation target and wage growth. He suggested further improvement in the domestic economy and ruled out any changes to the bank’s determination to continue monetary easing.
In the calendar, Foreign Bond Investment shrank to ¥715.4B in the week to January 28 and a 10-year JGB Auction came at 0.485%.
Next on the downside for USD/JPY now appears the 2023 low at 127.21 (January 16). The breakdown of this level could put the May 2022 low at 126.36 (May 24) to the test prior to the weekly low at 121.27 (March 31 2022). In the opposite direction, bullish attempts should continue to target the weekly top at 131.11 (January 24) ahead of another weekly peak at 131.57 (January 20) and the 2023 high at 134.77 (January 6). If the pair breaks above the latter, it could then confront the key 200-day SMA at 136.75 seconded by weekly tops at 138.17 (December 15 2022) and 139.89 (November 30 2022) closely followed by the key round level at 140.00. The daily RSI debilitated further and approached the 38 region.
Resistance levels: 129.13 130.41 131.07 (4H chart)
Support levels: 128.08 127.56 127.21 (4H chart)
GBPUSD
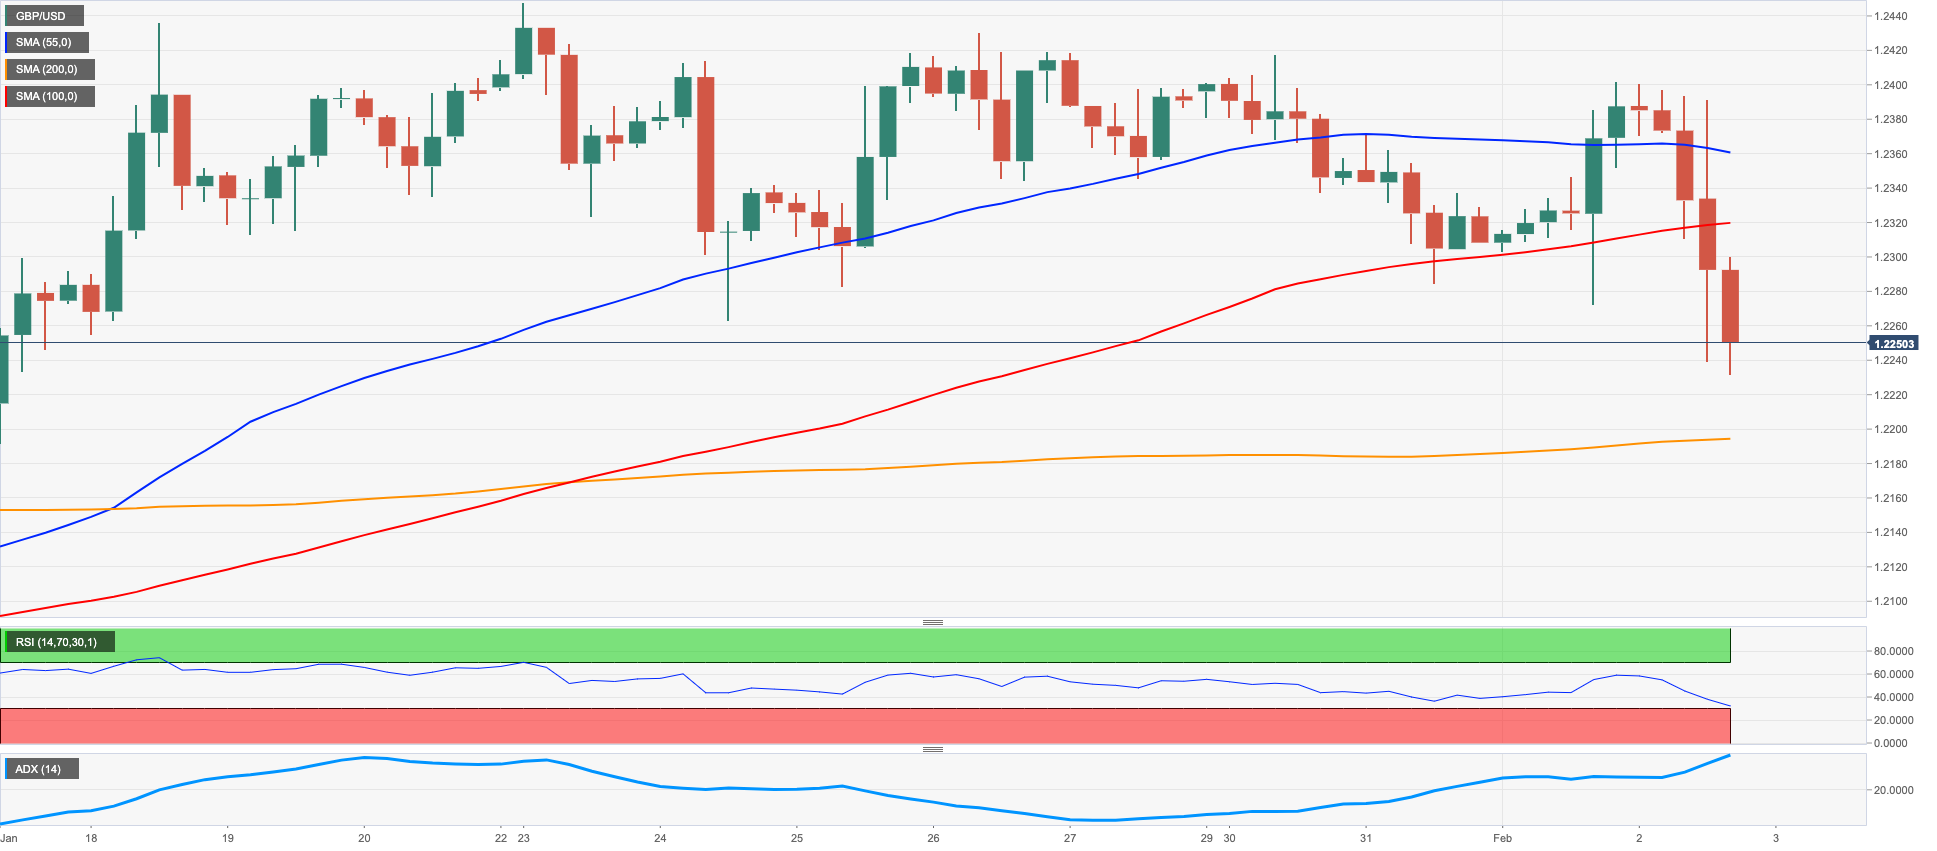
GBP/USD also saw its daily volatility increase amidst the BoE and the ECB gatherings and their impact on the greenback.
In fact, Cable briefly trespassed the key barrier at 1.2400 the figure just to come all the way down to the 1.2240 region afterwards on the back of the marked rebound in the greenback and the dovish hike from the Bank of England.
On the latter, the central bank hiked the policy rate by 50 bps to 4.00% as expected amidst a split vote, as two members (Tenreyro and Dhingra) favoured unchanged rates. The BoE noted that further tightening might be required in case that more persistent pressures become more evident.
In addition, the central bank sees inflation to have likely peaked and expects consumer prices to drop towards the end of the year. The BoE now sees a shallower recession than the one predicted back in November 2022 and sees the economy returning to pre-COVID levels not before 2026.
At his presser, Governor A.Bailey suggested inflation has turned the corner despite risk remaining tilted to the upside. MPC member Broadbent also noted uncertainty regarding a peak in rates, while his colleague D.Ramsden noted that the recession is milder than previously thought.
GBP/USD now faces the next support of note at the weekly low at 1.2238 (February 2). The breach of this level exposes a move to the temporary 55-day SMA at 1.2168 ahead of the weekly low at 1.2084 (January 12). South from here emerges the round level at 1.2000 before the key 200-day SMA at 1.1955 and the January low at 1.1841 (January 6). On the other hand, the 2023 high at 1.2447 (January 23) emerges as the next up barrier seconded by the May 2022 top at 1.2666 (May 27) and the key 200-week SMA at 1.2902. Once this region is cleared, then Cable could revisit the psychological 1.3000 yardstick. The daily RSI dropped to the 53 zone.
Resistance levels: 1.2401 1.2417 1.2447 (4H chart)
Support levels: 1.2238 1.2168 1.2084 (4H chart)
AUDUSD
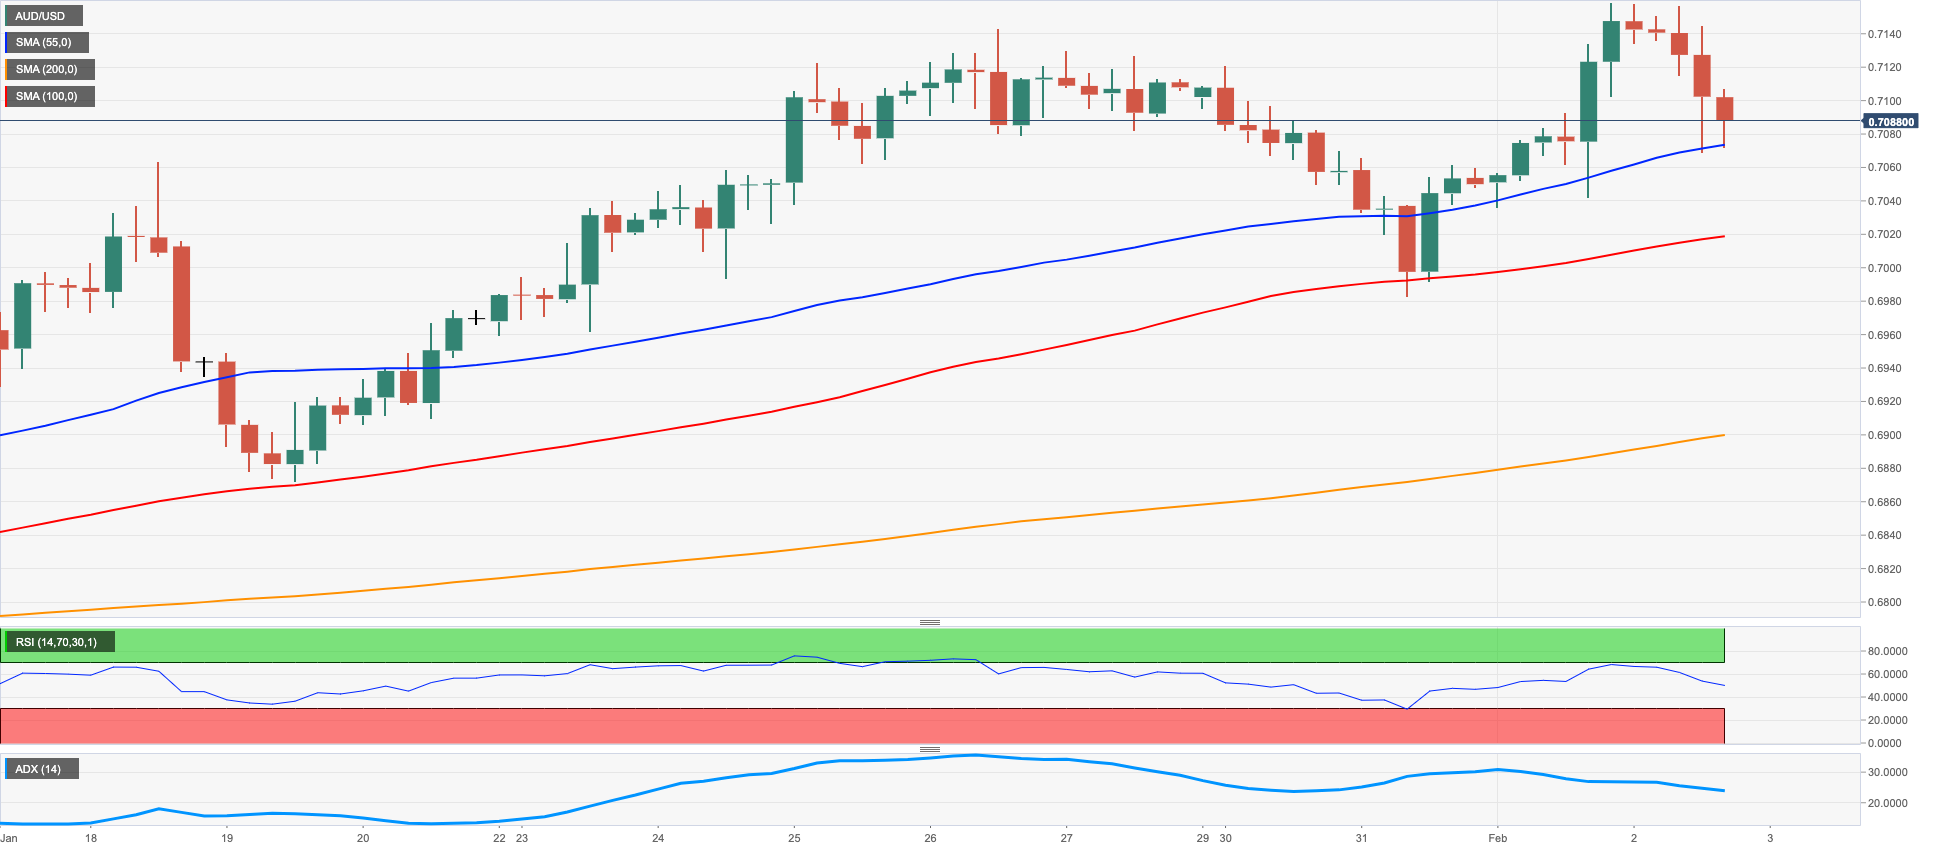
The resumption of the buying interest in the greenback forced AUD/USD to give away the earlier advance to new peaks in the 0.7155/60 band on Thursday.
Indeed, the dollar gathered renewed traction following the ECB and the BoE events earlier in the session, as market participants perceived both meetings to have fallen on the dovish side, or at least to have missed expectations.
The mixed performance of the commodity complex did not help the Aussie dollar either after copper prices managed to reverse Wednesday’s decline and the iron ore deflated from recent peaks.
Data wise Down Under, preliminary Building Permits are seen expanding 18.5% MoM in December, in what was the only release of note in the calendar.
Despite the daily retracement, the outlook for AUD/USD remains constructive. That said, the immediate hurdle emerges at the 2023 top at 0.7157 (February 2) ahead of the round level at 0.7200. The breakout of this level could pave the way for a move to the June 2022 peak at 0.7282 (June 3) prior to the round level at 0.7300. By contrast, initial contention comes at the weekly low at 0.6983 (January 31) ahead of another weekly low at 0.6871 (January 19) and the key 200-day SMA at 0.6809. Once the latter is cleared, a test of the January low at 0.6688 (January 3) could start shaping up before the December low at 0.6629 (December 20). The daily RSI lost the grip and flirted with 61.
Resistance levels: 0.7157 0.7247 0.7283 (4H chart)
Support levels: 0.7070 0.7041 0.6983 (4H chart)
GOLD
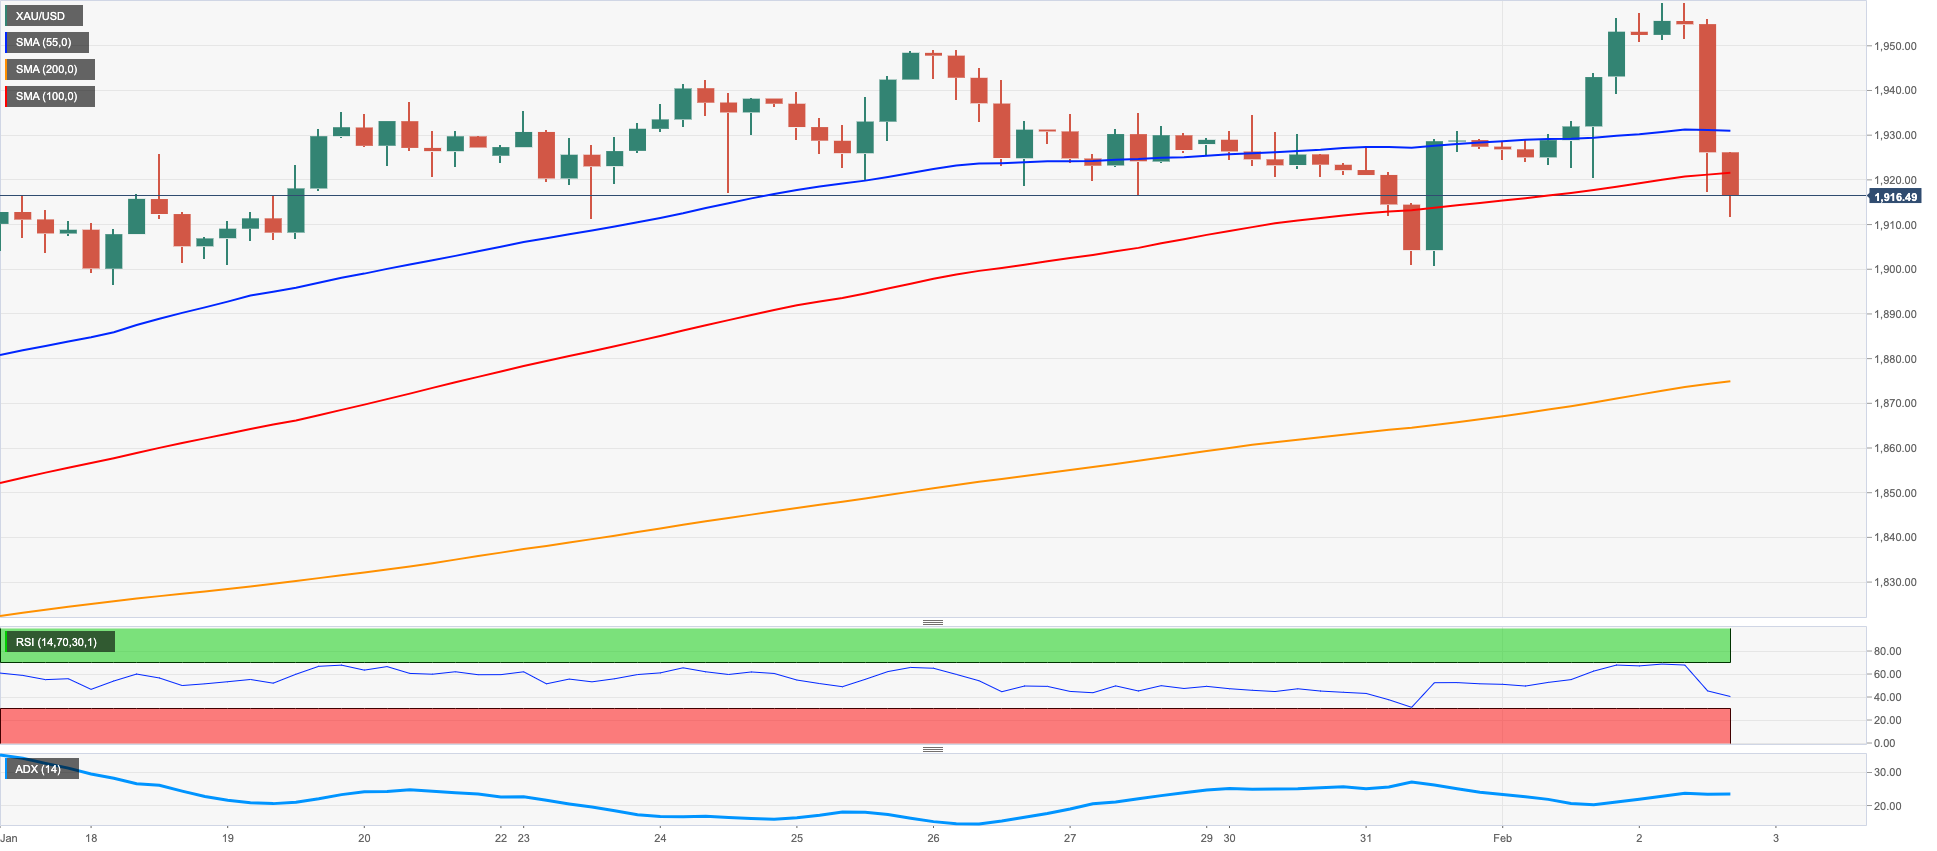
The acute rebound in the dollar encouraged bears to return to the market and drag prices of the yellow metal sharply lower and revisit the $1915 per ounce troy on Thursday.
In fact, the greenback derived extra strength after the ECB and the BoE hiked their policy rates as widely expected, failing at the same time to deliver a more hawkish message.
The continuation of the weekly retracement in US and European yields also failed to mitigate the daily decline in bullion, which seems to have exclusively followed dollar dynamics.
If the selling pressure around gold gathers extra steam, then it could revisit the weekly low at $1896 (January 18) ahead of another weekly low at $1867 (January 11). Further losses could then test the interim 55-day SMA at $1833 prior to the key 200-day SMA at $1777. A deeper drop could see the 100-day SMA at $1762 revisited before the weekly low at $1727 (November 23). On the flip side, the immediate hurdle comes at the 2023 peak at $1959 (February 2) ahead of the April 2022 high at $1998 (April 18). The trespass of the latter puts a test of the psychological $2000 mark back on the traders’ radar ahead of the 2022 high at $2070 (March 8).
Resistance levels: $1959 $1998 $2009 (4H chart)
Support levels: $1915 $1900 $1871 (4H chart)
CRUDE WTI
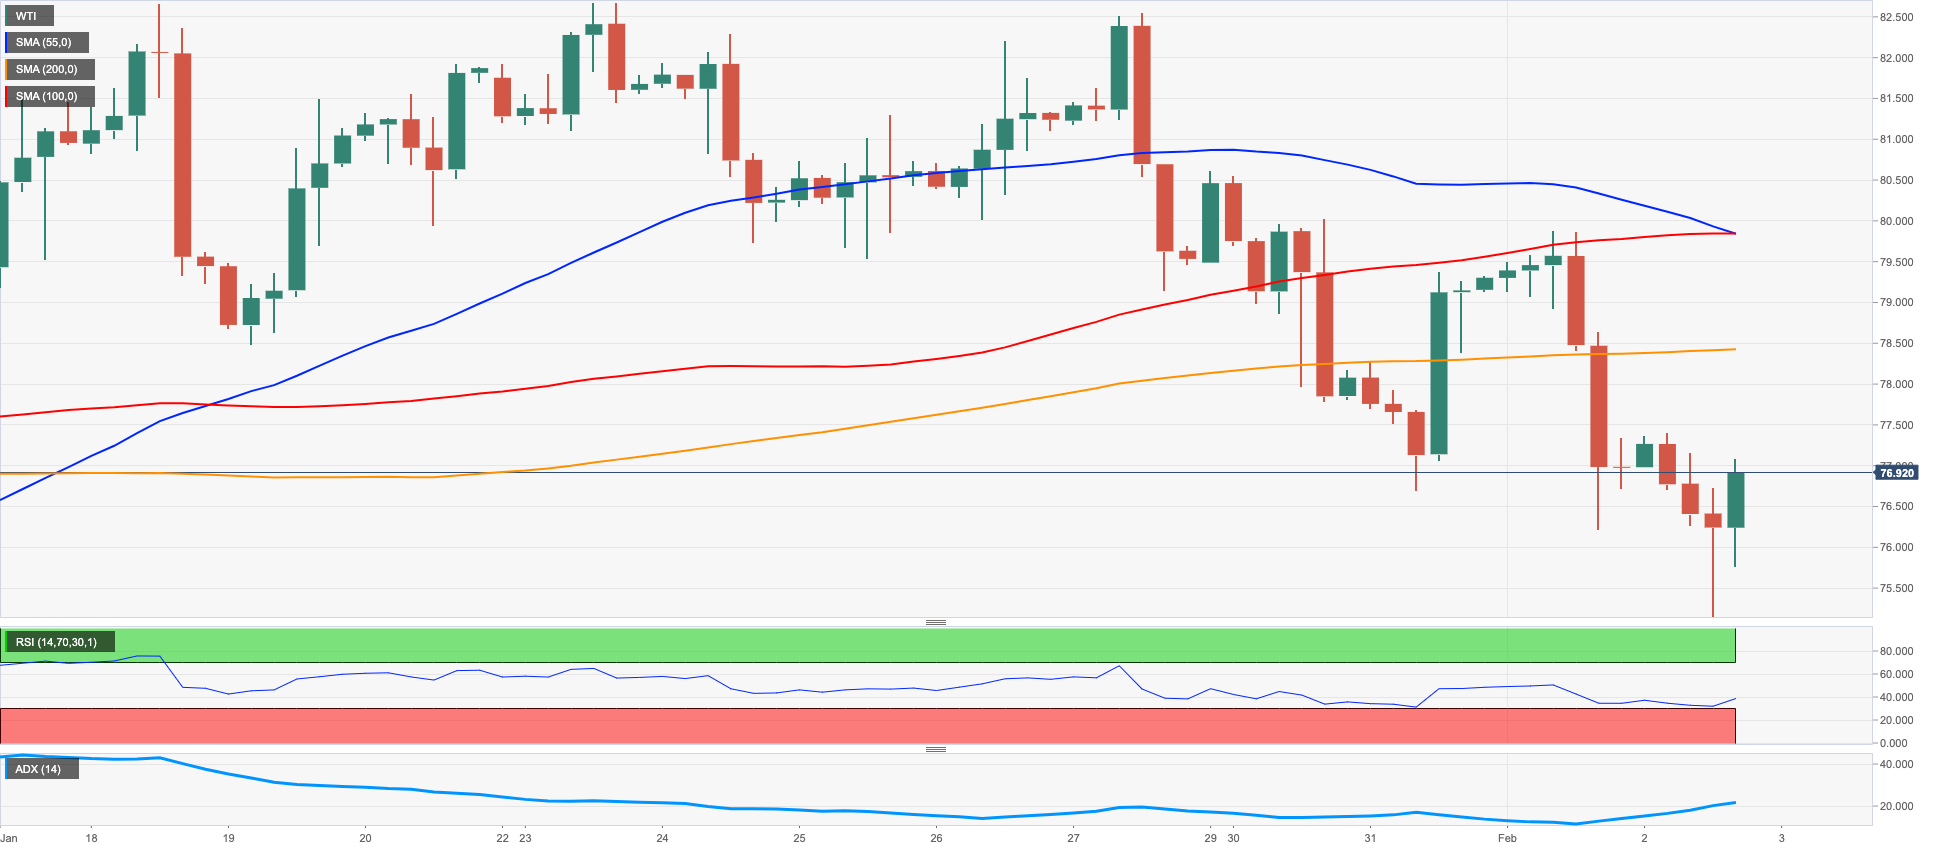
Prices of the barrel of the West Texas Intermediate (WTI) added to Wednesday’s decline and briefly hovered around the $75.00 mark on Thursday. The commodity, in the meantime, remained well on track to close the second consecutive week with losses.
The drop to new 3-week lows came in response to the pronounced rebound in the dollar after the ECB monetary policy gathering, which encouraged the USD Index (DXY) to make a U-turn after hitting fresh multi-month lows.
Collaborating with the decline appeared disheartening results from the US industrial sector, which reignited recession concerns among traders.
There are no support levels of note for WTI before the 2023 low at $72.50 (January 5). The breach of this level could open the door to a deeper decline to the 2022 low at $70.10 (December 9) ahead of the key round level at $70.00. Having said that, the commodity is expected to face the next resistance at the 2023 top at $82.60 (January 23) prior to the December 2022 peak at $83.32 (December 1) and followed by the $90.08 level (November 11 2022). Beyond the latter comes the 200-day SMA at $91.81 seconded by the November 2022 peak at $93.73 (November 7). If bulls push harder, then the weekly high at $97.65 (August 30 2022) could emerge on the horizon ahead of the key $100.00 mark per barrel.
Resistance levels: $78.15 $79.68 $80.26 (4H chart)
Support levels: $75.02 $73.81 $72.42 (4H chart)
GER40
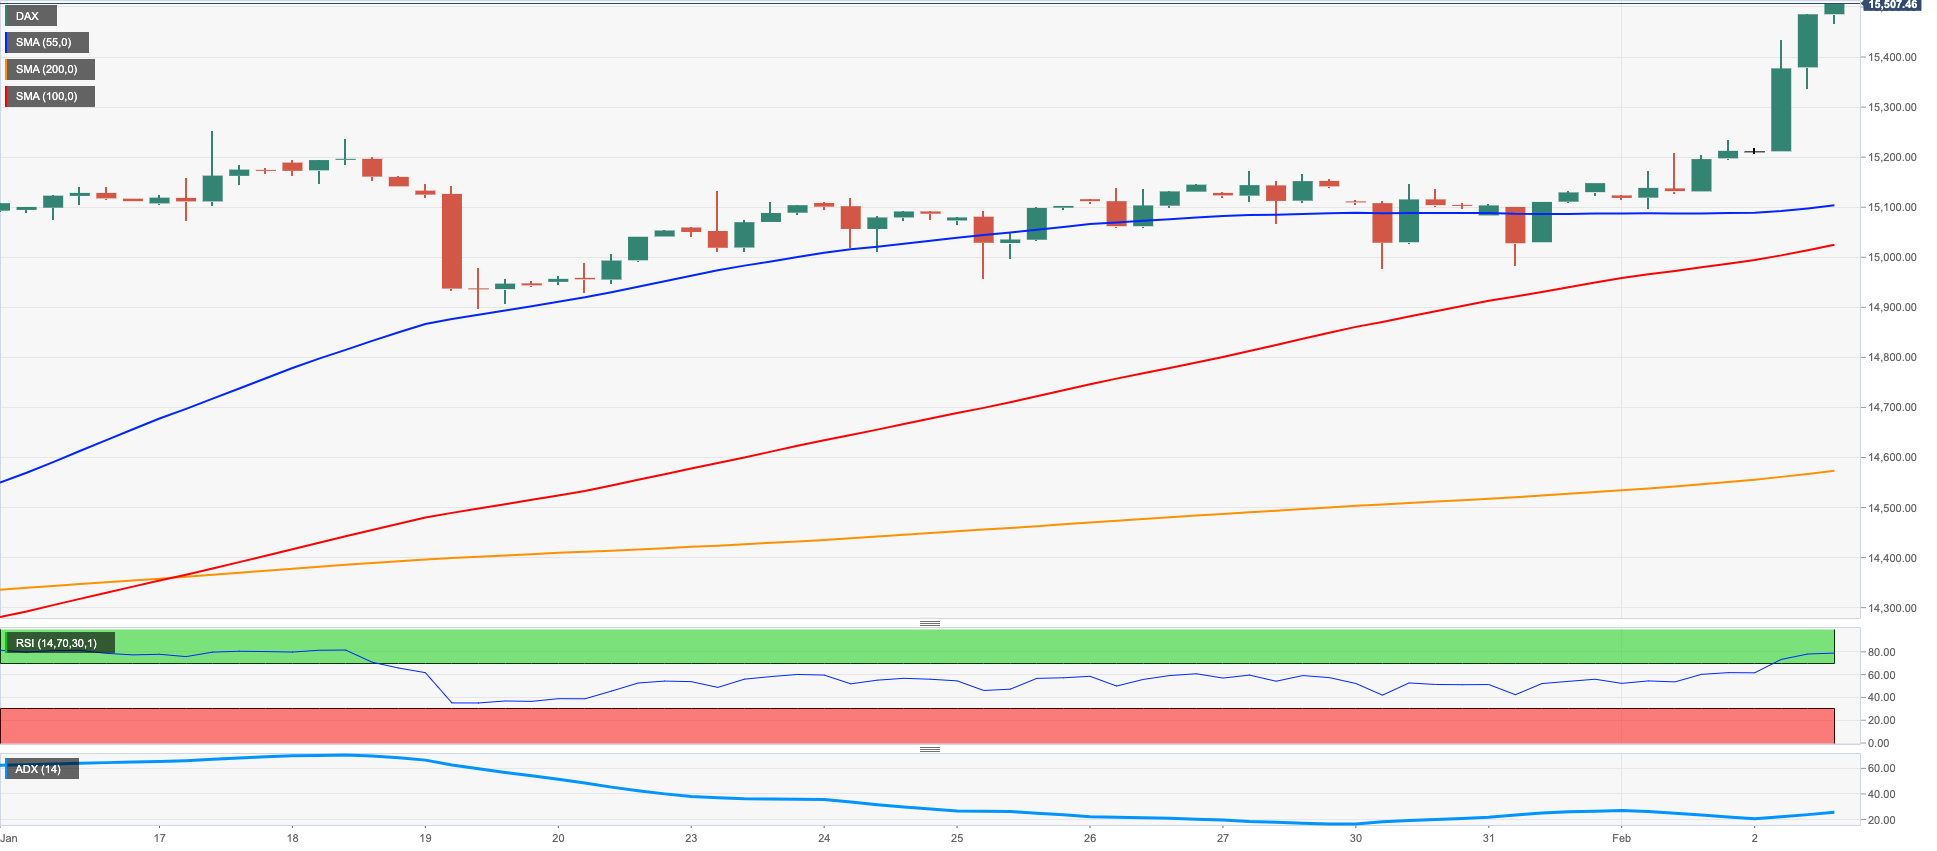
The rally in German equities remained unabated on Thursday.
Indeed, the DAX 40 closed the third consecutive session with gains and climbed to levels last seen a year ago around the 15500 region.
The optimism in the European markets gathered extra steam after the ECB hinted at a potential pause in its hiking cycle after the March meeting, when it has already anticipated another half percentage point increase in its interest rates.
Following the ECB event, the 10-year Bund yields extended the decline to fresh multi-session lows near 2.05%.
In the domestic calendar, the German trade surplus eased slightly to €10B in December (from €10.8B).
A move above the 2023 high at 15520 (February 2) could motivate the DAX40 to visit the February 2022 top at 15736 (February 2 2022) prior to the round level at 16000 and the 2022 peak at 16285 (January 5). Inversely, the weekly low at 14906 (January 19) is expected to offer initial support ahead of the provisional 55-day SMA at 14547 and the December 2022 low at 13791 (December 20). A deeper drop from here could put the key 200-day SMA at 13639 back on the investors’ radar prior to the November 2022 low at 13022 (November 3) and the minor support at 12548 (October 21 2022). The daily RSI moved further into the overbought territory past the 75 yardstick.
Best Performers: Siemens Healthineers AG, Vonovia, Dr Ing hc F Porsche AG Pfd
Worst Performers: Deutsche Bank AG, Munich Re Group, Henkel VZO
Resistance levels: 15520 15614 15736 (4H chart)
Support levels: 15081 14969 14906 (4H chart)
NASDAQ
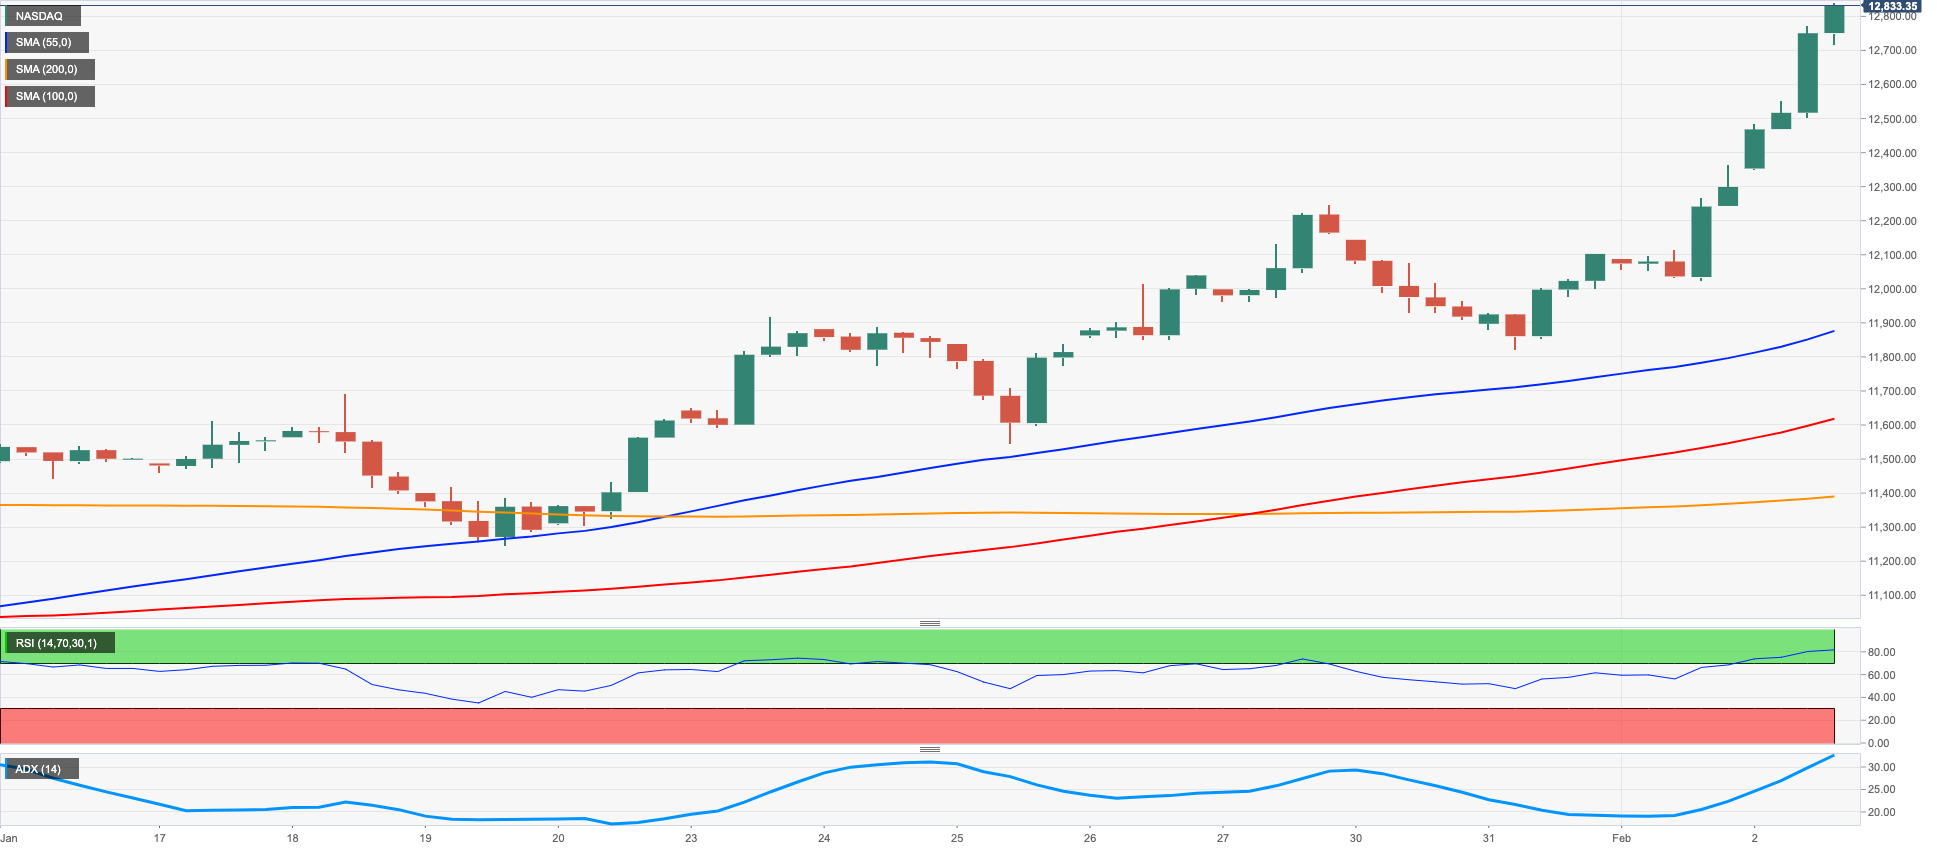
The tech benchmark Nasdaq 100 rose to fresh 6-month peaks near the 12800 level on Thursday, extending at the same time the rally for the third session in a row and en route to clinch the fifth consecutive week in the positive territory.
The increased optimism in the tech sector came after positive news from Meta Platforms and hopes of positive corporate results from megacaps Amazon, Apple and Alphabet due following the closing bell on Thursday.
Also boosting the performance of the index came another decline in US yields across the board, this time deflating to multi-day lows.
The Nasdaq 100 recorded a new 2023 peak at 12803 (February 2). The surpass of this level exposes a probable visit to the round level at 13000 before the weekly high at 13175 (August 26 2022). Conversely, the 200-day SMA at 11968 emerges as the immediate support prior to weekly lows at 11550 (January 25) and 11251 (January 19). Extra losses from here could confront the January low at 10696 (January 6) prior to the December 2022 low at 10671 (December 22) and the November 2022 low at 10632 (November 4). The daily RSI advanced to the overbought territory past the 73 level.
Top Gainers: Align, Meta Platforms, Zscaler
Top Losers: Sirius XM, Pinduoduo, Vertex
Resistance levels: 12803 13175 13720 (4H chart)
Support levels: 11906 11550 11447 (4H chart)
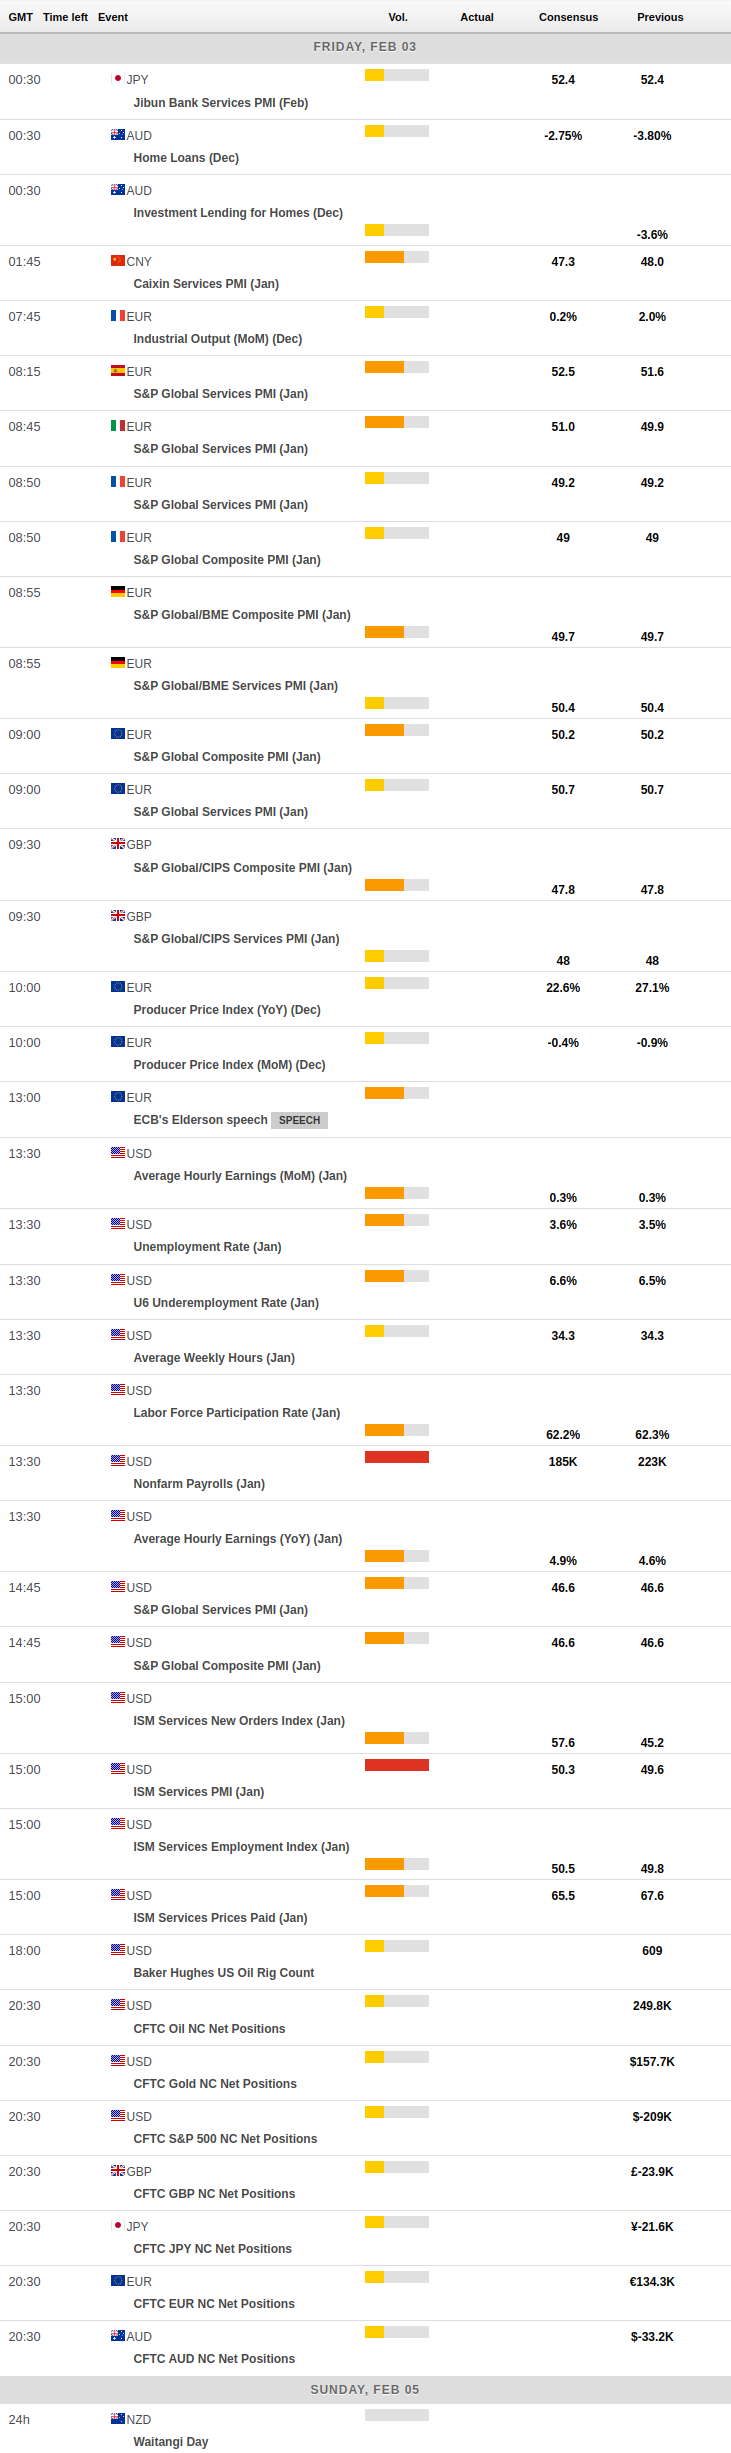
MACROECONOMIC EVENTS
All Information & Updates provided by:

All information relating to the financial markets available on this page has been prepared and issued by FXStreet (Forexstreet SL, Spain, Reg: B62498233) on the basis of publicly available information and all information believed to be reliable and does not conflict with Kuwaiti local laws, and all necessary care has been taken to before the company to ensure that the facts mentioned are correct from the source.
NCM Investment nor any of its directors or employees shall in any way be held responsible for the contents of this news, and the information contained on this page is intended only to provide clients with publicly available information and should not be construed as investment advice, report or analysis and/or constitute an offer or invitation to buy or sell financial instruments of any kind.
RISK WARNING: Forex and CFDs are highly risky leveraged products, as losses can exceed deposits. Please ensure you understand all the risks and take independent advice if necessary. NCM will segregate the clients based on the criteria of the regulator and its bylaws. NCM does not provide any advisory service; the material published does not constitute advice or a recommendation for a transaction in any financial instrument. NCM accepts no responsibility for any use of the content presented and any consequences of that use. Anyone acting on the information provided does so at their own risk.