
- Contact Us:
-

-

-

-


Daily Market Updates
06 Feb 2023
USDJPY
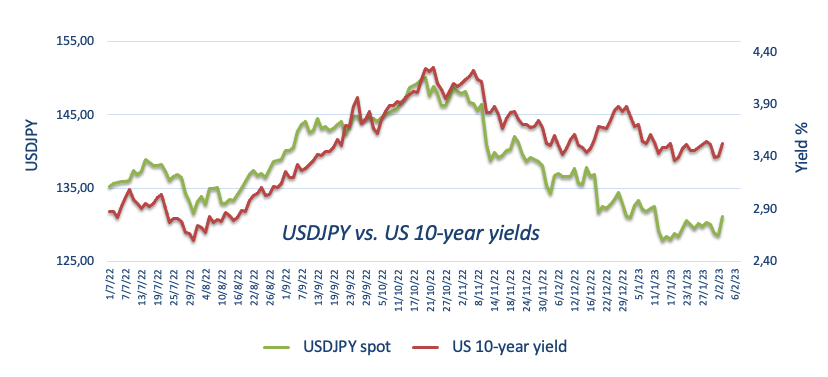
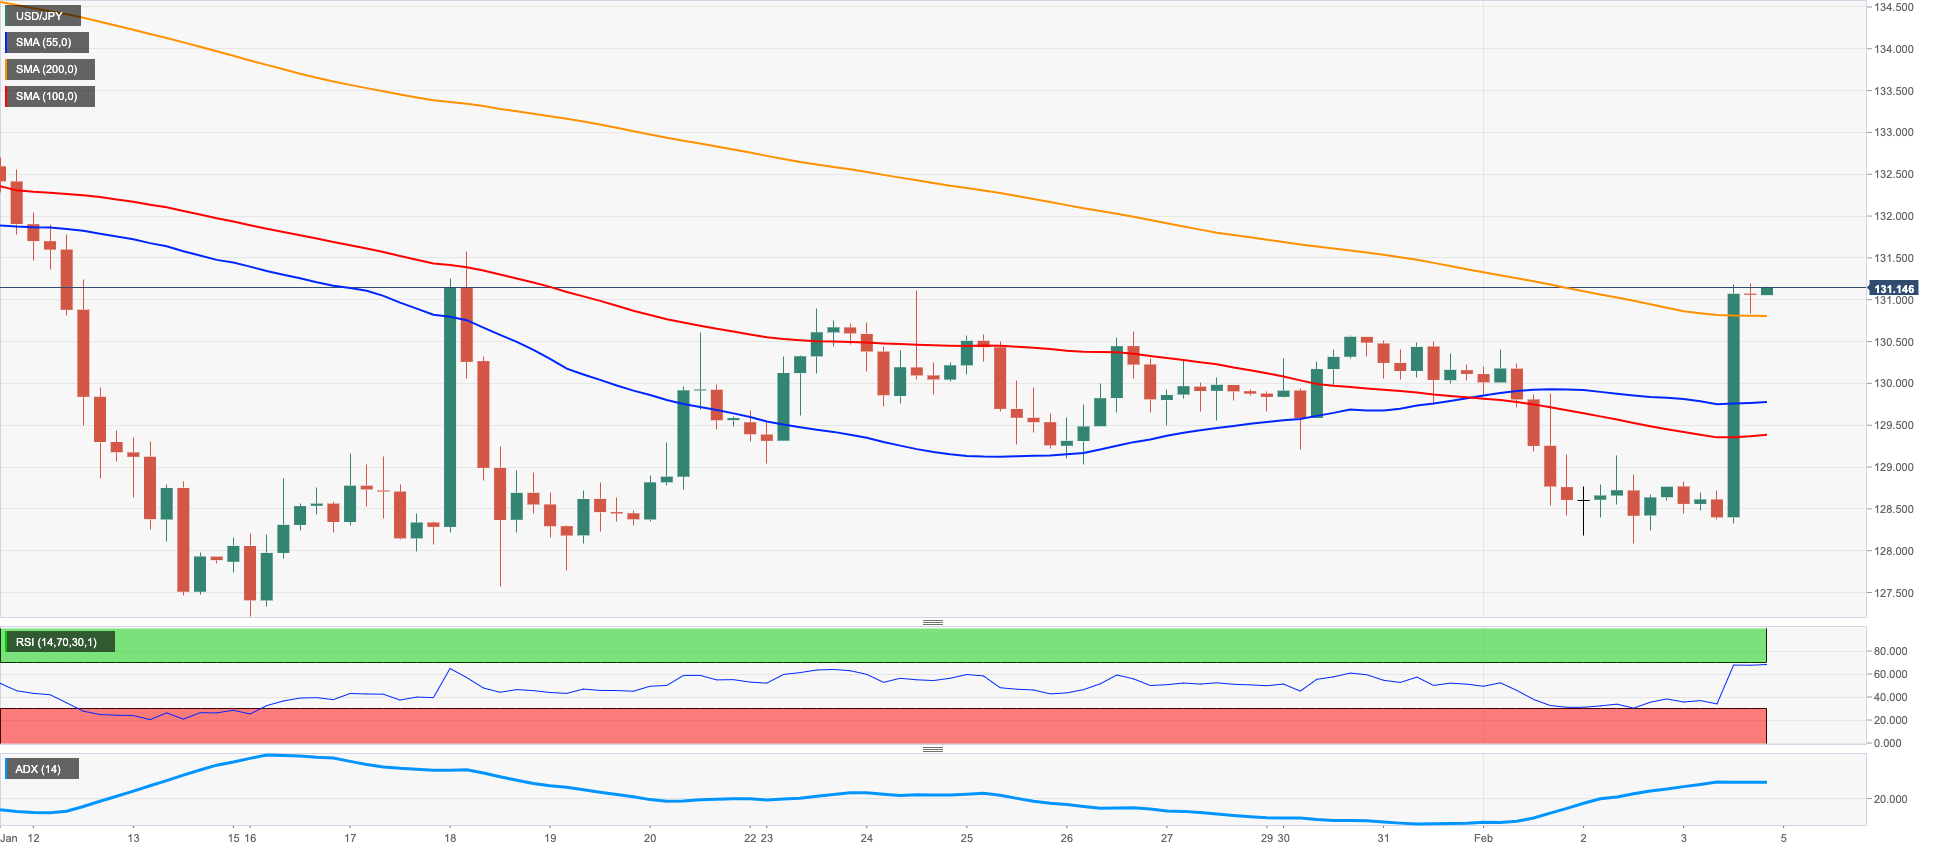
The pronounced rebound in the greenback coupled with an equally strong bounce in US yields across the curve motivated USD/JPY to advance nearly 2% and reclaim the area north of 131.00 the figure on Friday. The pair, at the same time, managed to extend the recovery for the third week in a row.
Indeed, US yields left behind the recent weakness and jumped to multi-day highs in response to the now firmer expectations of the continuation of the hiking cycle by the Federal Reserve, all following solid results from the US Nonfarm Payrolls for the month of January.
In contrast to their US peers, the JGB 10-year yields retreated modestly to the 0.48% region.
In the Japanese docket, the final Jibun Bank Services PMI improved to 52.9 during last month (from 48.0).
If the rebound in USD/JPY becomes more serious, then the next target of note aligns at the weekly high at 131.57 (January 20) ahead of the 2023 top at 134.77 (January 6). Once cleared, the key 200-day SMA at 136.76 could return to the investors’ radar prior to weekly tops at 138.17 (December 15 2022) and 139.89 (November 30 2022), all preceding the key round level at 140.00. On the other hand, the breach of the weekly low at 128.08 (February 2) could open the door to a deeper pullback to the 2023 low at 127.21 (January 16) ahead of the May 2022 low at 126.36 (May 24) and the weekly low at 121.27 (March 31 2022). The daily RSI bounced sharply above 51.
Resistance levels: 131.20 131.57 132.87 (4H chart)
Support levels: 128.08 127.56 127.21 (4H chart)
GBPUSD
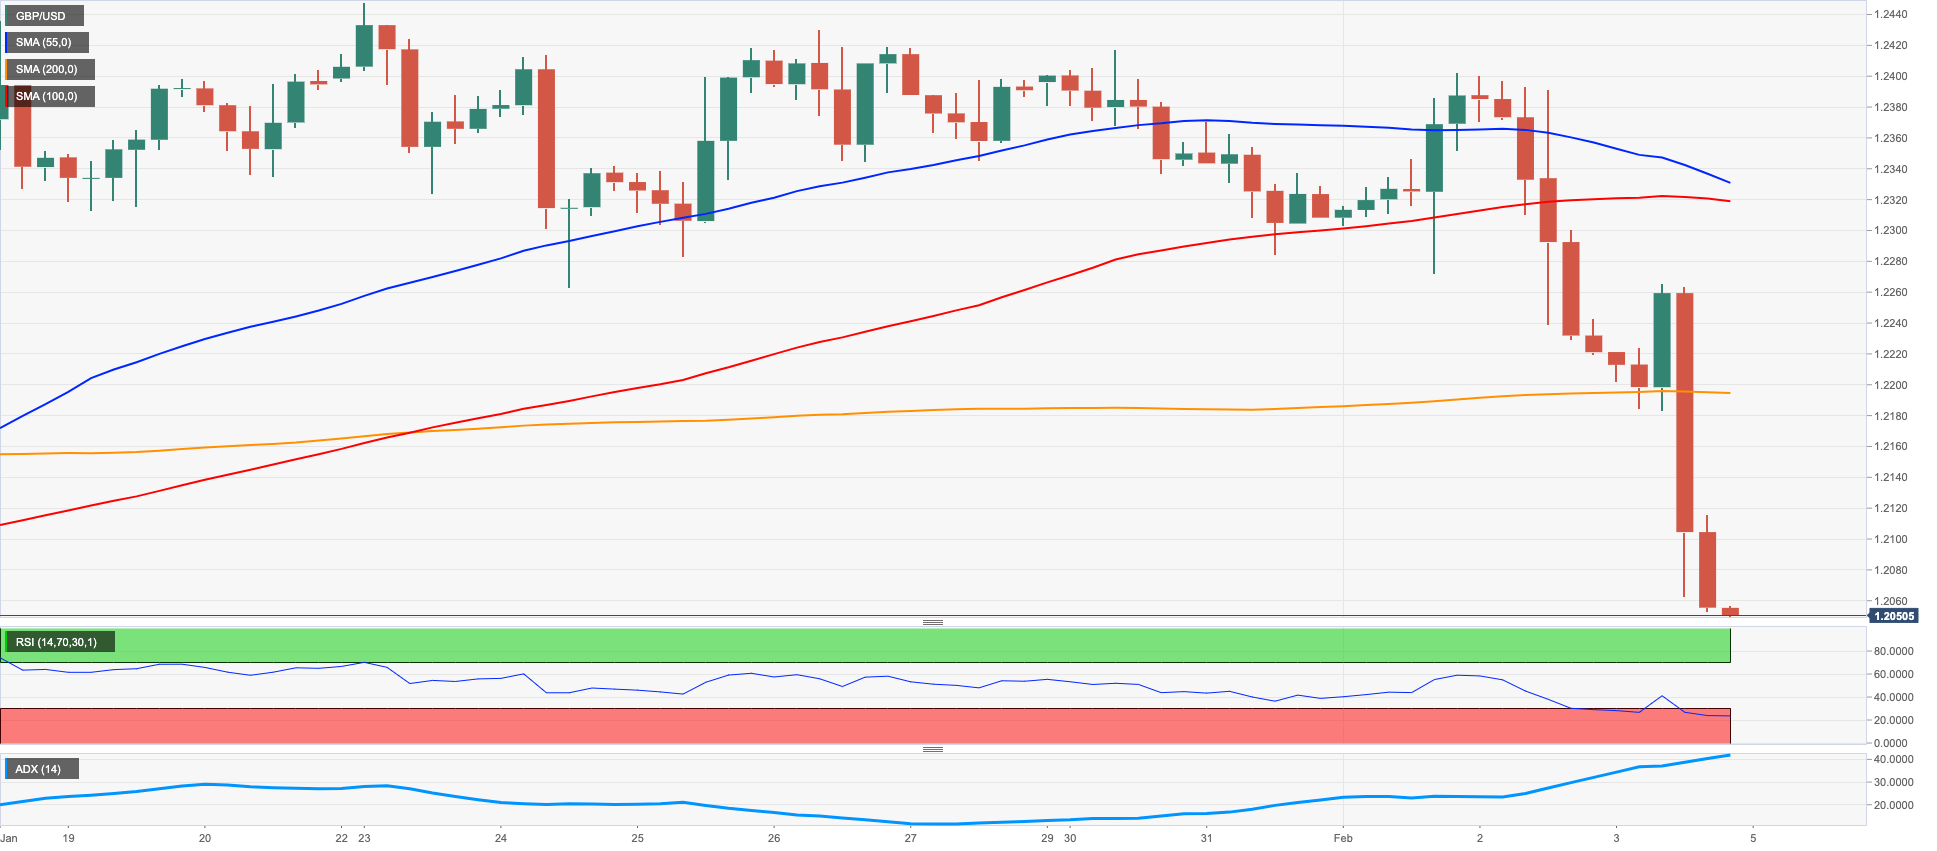
GBP/USD fell off a cliff in the last couple of sessions and dropped to new 4-week lows in the vicinity of 1.2040 on Friday, that is more than 4 cents lower than the YTD high recorded two weeks ago (1.2447 on January 23).
The intense buying pressure in the greenback did nothing but magnify in response to January’s Nonfarm Payrolls (+517K) at the end of the week, putting the quid and the rest of the risk-associated assets under heavy pressure.
There was no impact in the FX space from comments by BoE’s H.Pill, who suggested the bank needs to restrain demand to curb inflation, at the time when he added that higher interest rates impose costs on the UK. Pill also said that the BoE will proceed with QT over the coming years.
In the UK, final S&P Global/CIPS Services PMI eased slightly to 48.7 in January (from 49.9).
If GBP/USD accelerates its losses it could challenge the key round level at 1.2000 ahead of the key 200-day SMA at 1.1952 and the January low at 1.1841 (January 6). Just the opposite, there are no resistance levels of note until the 2023 top at 1.2447 (January 23) prior to the May 2022 peak at 1.2666 (May 27) and the key 200-week SMA at 1.2901, which is closely followed by the psychological 1.3000 mark. The daily RSI plummeted to the sub-39 region.
Resistance levels: 1.2190 1.2265 1.2312 (4H chart)
Support levels: 1.2042 1.1841 1.1778 (4H chart)
AUDUSD
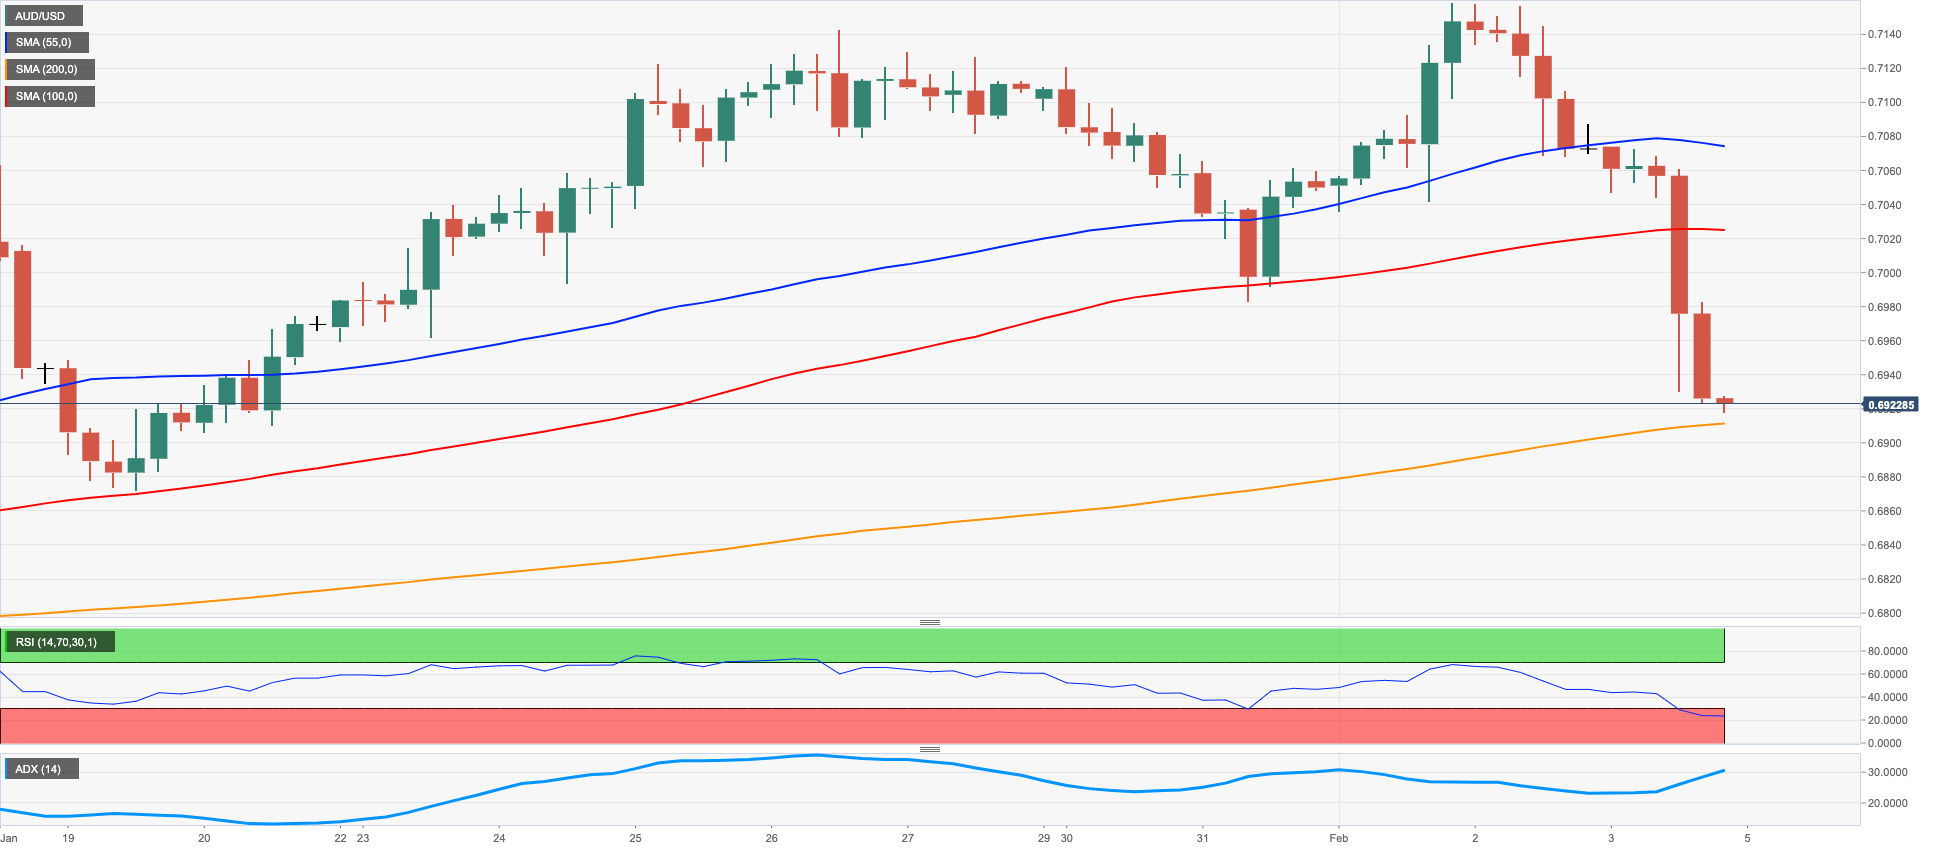
AUD/USD added to Thursday’s decline and ended the week in the area of 2-week lows in the 0.6920/15 band.
The Aussie dollar, as well as the rest of the risk complex, succumbed to the intense bounce in the greenback, which was particularly exacerbated following much-higher-than-expected results from January’s Payrolls.
Unsurprisingly, extra selling pressure around AUD came from the generalized corrective retracement in the commodity galaxy, where both copper prices and the iron ore retreated to multi-session lows.
In Oz, Home Loans contracted at a monthly 4.2% in December and Investment Lending for Homes dropped 4.4% vs. the previous month.
Following Friday’s sharp decline, the positive outlook for AUD/USD now looks dented. That said, further downside could see the weekly low at 0.6871 (January 19) revisited ahead of the interim 55-day SMA at 0.6836 and the key 200-day SMA at 0.6808. The loss of the latter could prompt the January low at 0.6688 (January 3) to emerge on the horizon prior to the December 2022 low at 0.6629 (December 20). In the opposite direction, bullish attempts should target the 2023 peak at 0.7157 (February 2) seconded by the round level at 0.7200. The breakout of this level exposes a probable visit to the June 2022 high at 0.7282 (June 3) ahead of the round level at 0.7300. The daily RSI shed further ground and approached the 47 zone.
Resistance levels: 0.7021 0.7072 0.7157 (4H chart)
Support levels: 0.6918 0.6901 0.6871 (4H chart)
GOLD
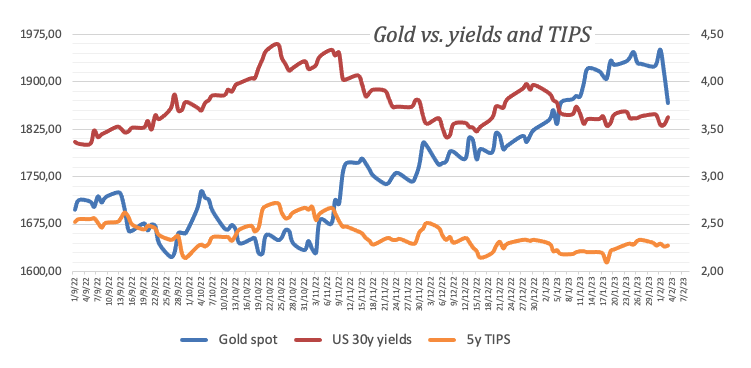
Another strong session in the greenback dragged gold prices to new 4-week lows near $1860 per ounce troy on Friday. In light of this price action, the precious metal closed with losses for the first time after six consecutive weeks.
Totally above-expected prints from US January Nonfarm Payrolls pushed the USD Index (DXY) to the vicinity of the 103.00 yardstick for the first time since early 2023, adding to Thursday’s advance and temporarily reversing the downtrend in place since the beginning of the year.
Furthermore, the results from the US labour market reignited the Fed’s tighter-for-longer narrative and sponsored the marked rebound in US yields across the curve, which in turn morphed into extra selling pressure for the yellow metal.
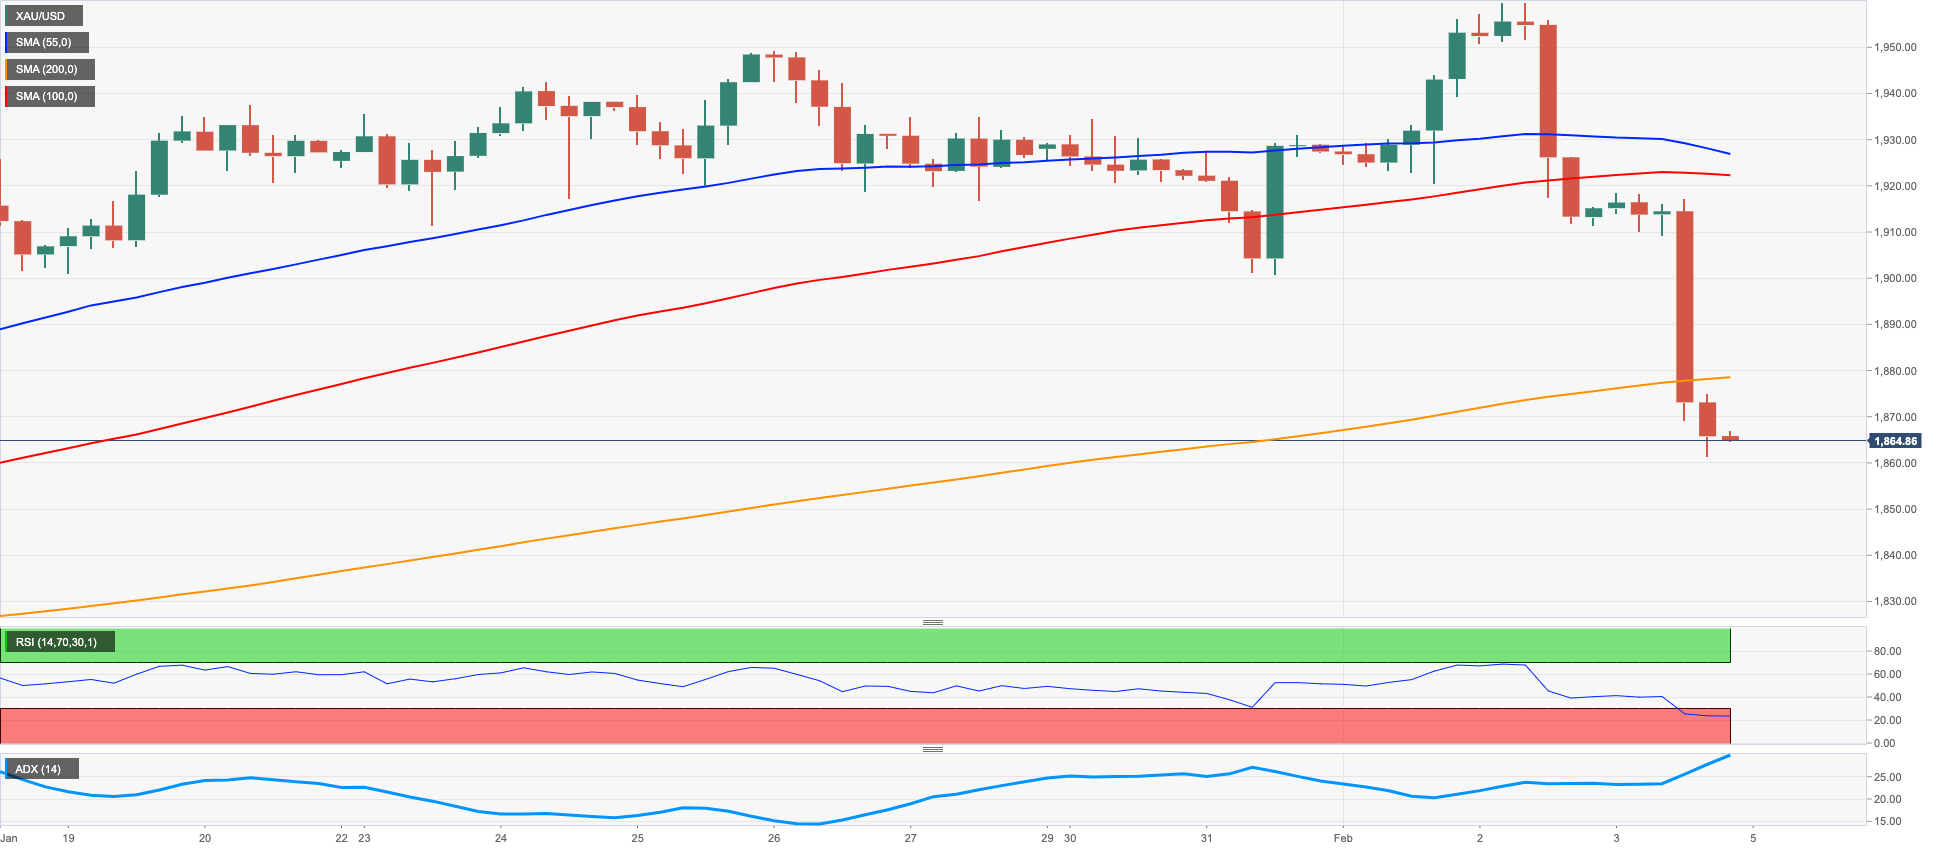
The continuation of the downtrend in gold now faces the next provisional contention at the 55-day SMA at $1835 ahead of the key $1800 zone and the 200-day SMA at $1776. Below here turns up the 100-day SMA at $1763 prior to the weekly low at $1727 (November 23). By contrast, the resumption of the upside bias is expected to meet the next hurdle at the 2023 high at $1959 (February 2) seconded by the April 2022 top at $1998 (April 18). Further up emerges the psychological $2000 yardstick before the 2022 high at $2070 (March 8).
Resistance levels: $1875 $1918 $1959 (4H chart)
Support levels: $1861 $1825 $1797 (4H chart)
CRUDE WTI
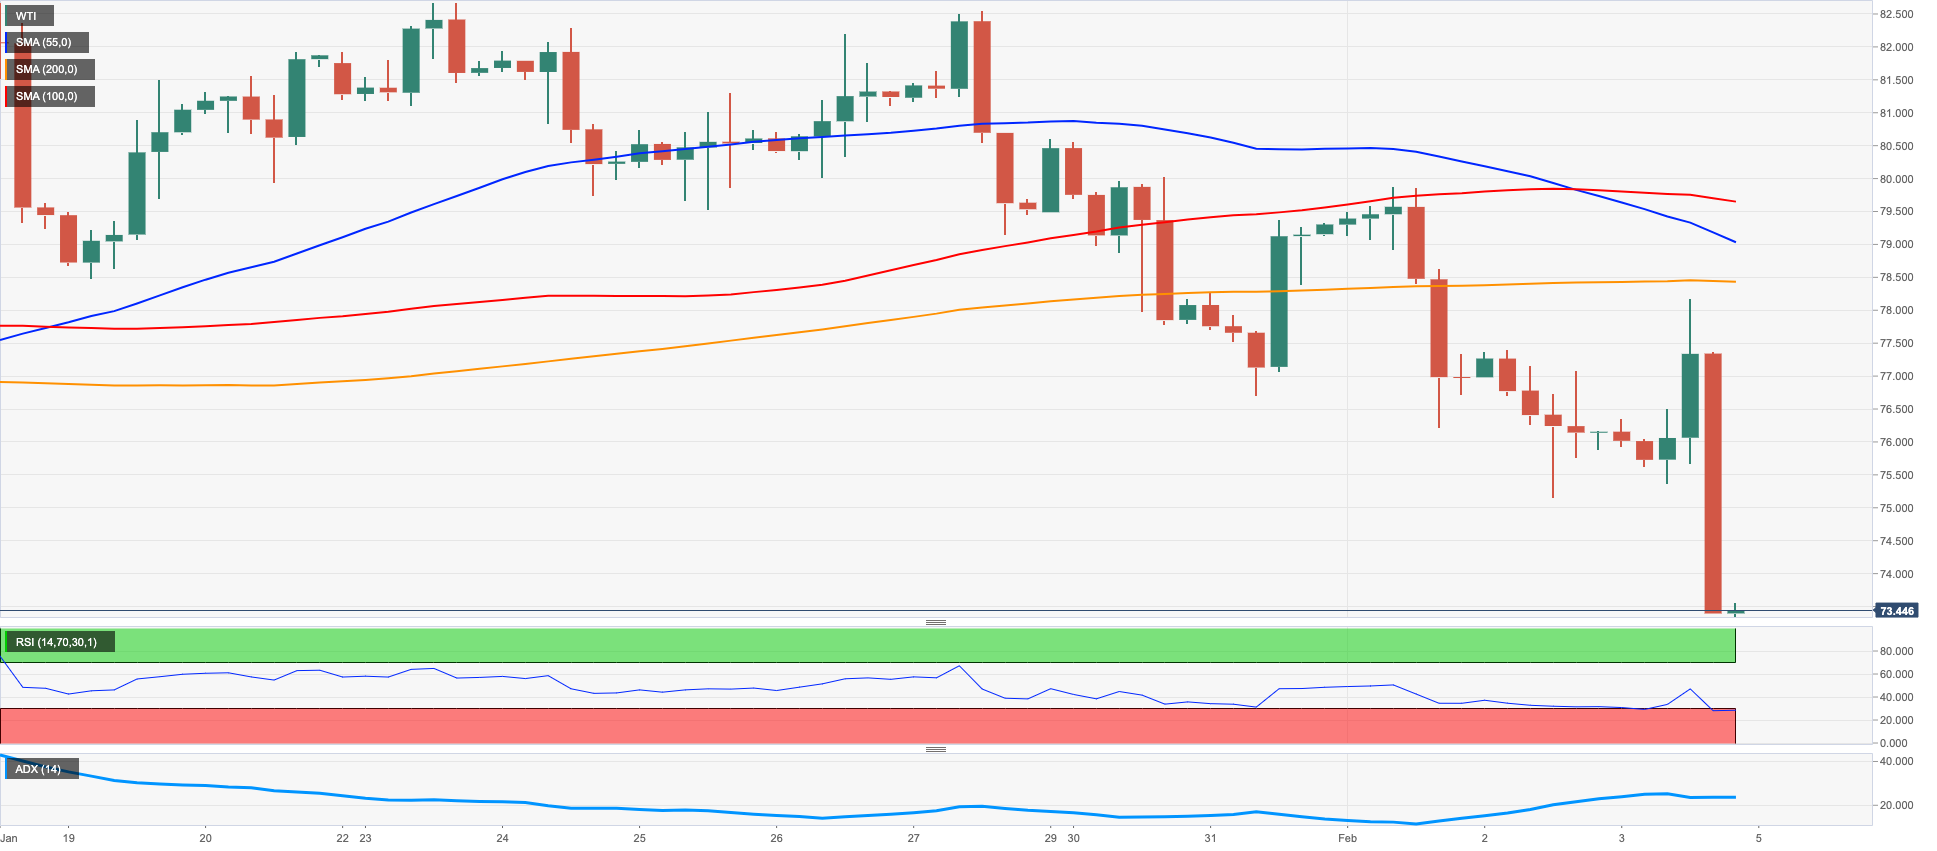
Prices of the West Texas Intermediate (WTI), dropped for the third consecutive session and charted new 4-week lows near the $73.00 mark per barrel at the end of the week. That said, the commodity almost fully faded the auspicious start of the new year in the past week after shedding nearly 10% from Monday to Friday.
The WTI accelerated its losses on the back of renewed concerns around an economic slowdown, which were underpinned by prospects for further tightening by the Fed in response to the stronger-than-expected results from the US Payrolls for the month of January.
In the docket, the oil rig count tracked by driller Baker Hughes reported a drop of 10 US oil rigs in the week to February 3, taking the total US active oil rigs to 599.
Collaborating with the sour note around the commodity emerged the rising uncertainty around the EU cap on exports of Russian refined oil products.
Immediately to the downside for the WTI now aligns the 2023 low at $72.50 (January 5). A deeper pullback could put the 2022 low at $70.10 (December 9) back on the traders’ radar, closely followed by the key round level at $70.00 and ahead of the weekly low at $66.15 (December 20 2021). In the opposite direction, there are temporary hurdles at the 55- and 100-day SMAs at $77.68 and $81.40, respectively, all ahead of the 2023 peak at $82.60 (January 23). Further north emerges the December 2022 high at $83.32 (December 1) seconded by the $90.08 level (November 11 2022) and the 200-day SMA at $91.66.
Resistance levels: $78.13 $79.68 $80.26 (4H chart)
Support levels: $73.16 $72.42 $70.07 (4H chart)
GER40
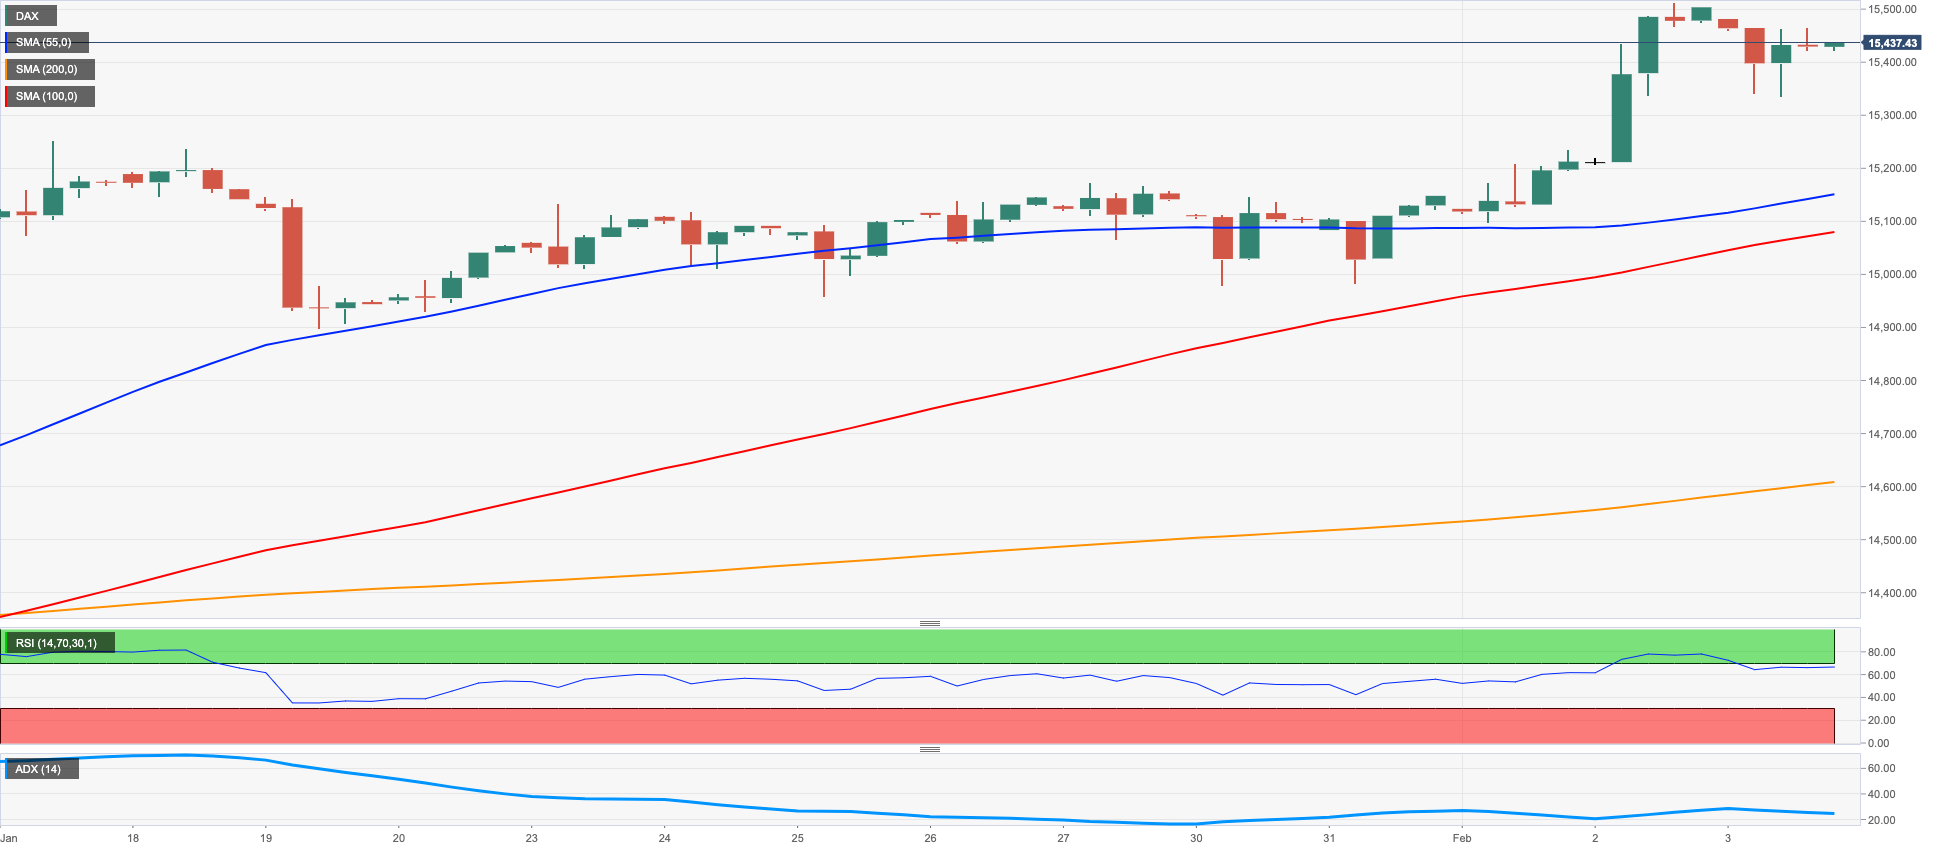
German equities measured by the DAX40 left behind part of the weekly optimism and retreated modestly on Friday. Despite this retracement, the index managed to clinch the second consecutive week with gains, including a move to levels last traded back in February 2022 around 15500.
The risk complex suffered the resurgence of fears surrounding a probable economic slowdown, particularly following the recent FOMC and ECB gatherings and especially the latest results from the US jobs report.
The downtick in stocks came in contrast to the recovery in the German 10-year Bund yields, which echoed the performance of their US peers and regained the area above the 2.20% level.
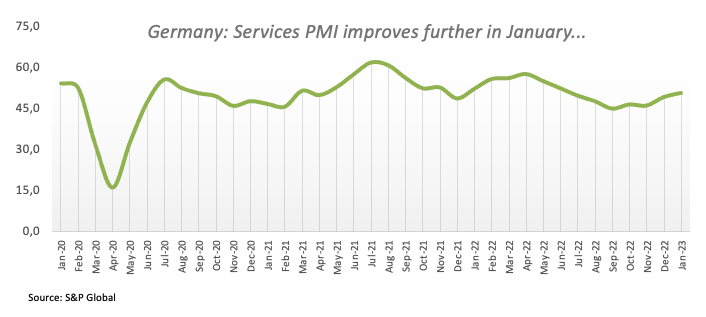
In the domestic calendar, the final S&P Global Services PMI improved to 50.7 in January (from 49.2), in what was the sole release on Friday.
The constructive outlook in the DAX40 remains unchanged for the time being. Against that, extra gains need to clear the 2023 top at 15520 (February 2) to allow for a probable move to the February 2022 peak at 15736 (February 2 2022). Above the latter comes the round level at 16000 prior to the 2022 high at 16285 (January 5). The other way around, there is initial support at the weekly low at 14906 (January 19) before the interim 55-day SMA at 14569 and the December 2022 low at 13791 (December 20). The loss of this level could put the key 200-day SMA at 13647 to the test ahead of the November 2022 low at 13022 (November 3). The daily RSI remained in the overbought territory above 73.
Best Performers: Sartorius AG VZO, Adidas, Infineon
Worst Performers: Dr Ing hc F Porsche AG Pfd, Vonovia, Siemens Energy AG
Resistance levels: 15520 15614 15736 (4H chart)
Support levels: 15118 14969 14906 (4H chart)
NASDAQ
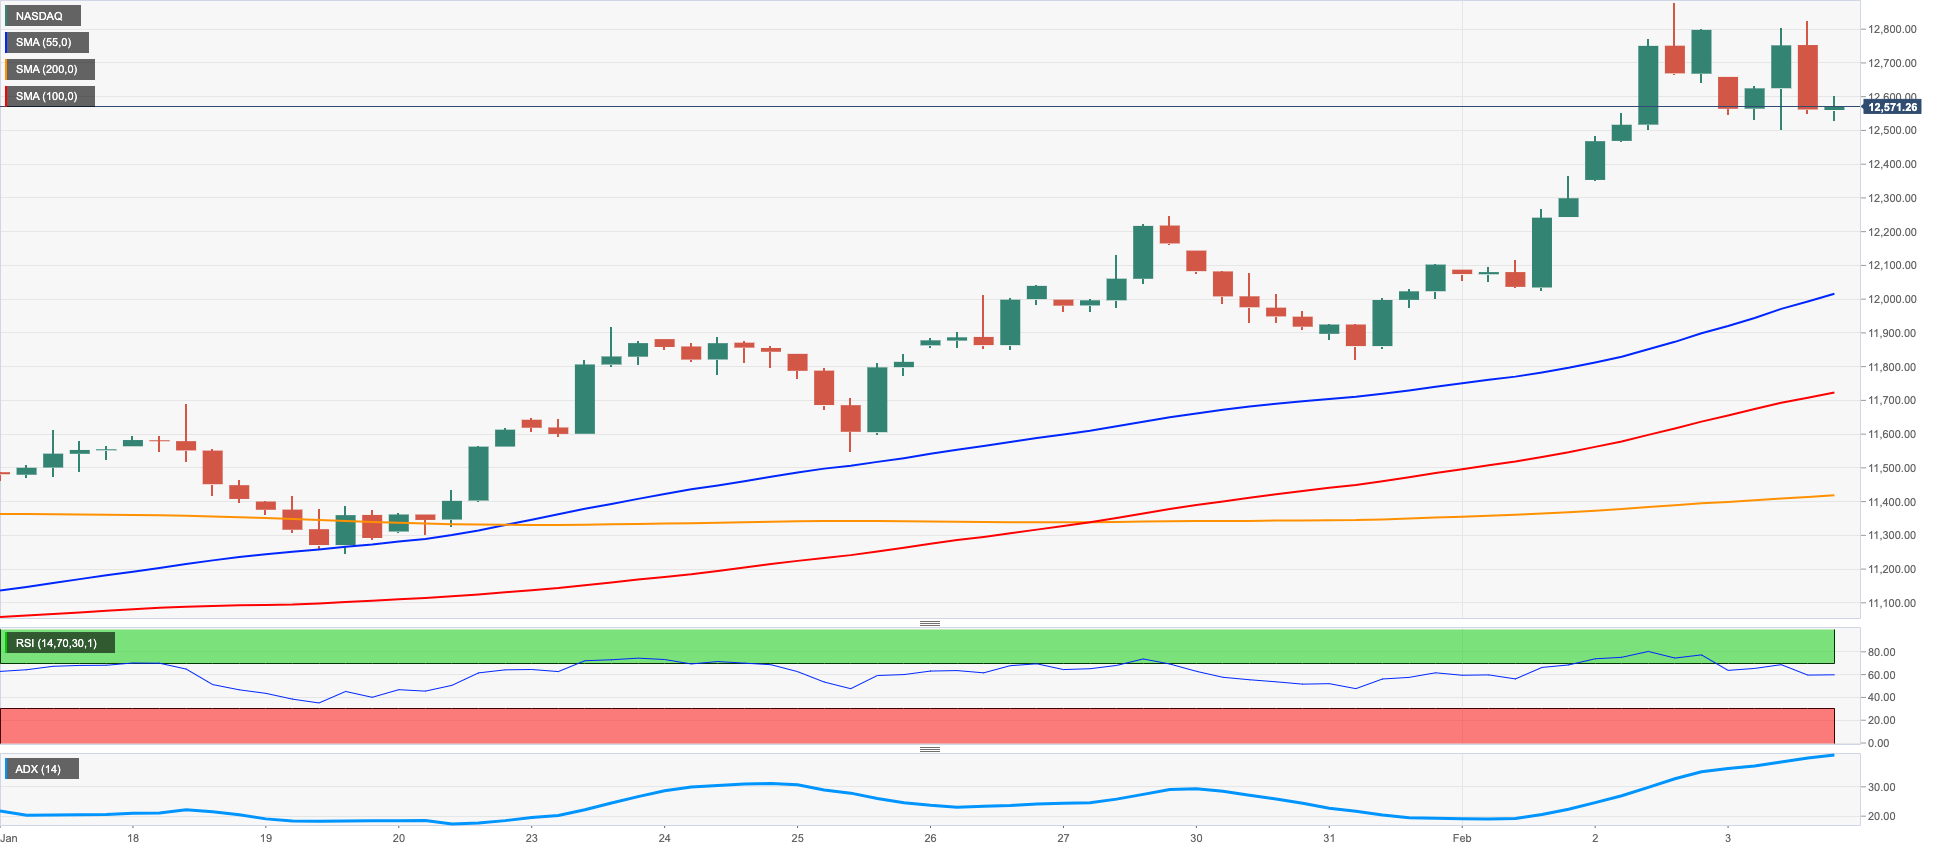
Despite Friday’s pullback, the Nasdaq 100 index maintained the rally well and sound for the fifth consecutive week and kept the trade in levels last visited back in August 2022 around the 12800 region.
Indeed, the daily retracement at the end of the week came against the backdrop of renewed concerns around a potential economic slowdown, as US Payrolls results triggered fresh speculation of further tightening by the Fed.
Also weighing on the index appeared the marked bounce in US yields across the curve, while disappointing corporate results from Alphabet and negative news hitting Amazon helped with the downbeat mood.
Further gains in the Nasdaq 100 remain focused on the 2023 high at 12880 (February 2) just ahead of the round level at 13000 and prior to the weekly top at 13175 (August 26 2022). Inversely, there is a decent support at the key 200-day SMA at 11960 before weekly lows at 11550 (January 25) and 11251 (January 19). South from here should emerge the January low at 10696 (January 6), while the drop below this level could pave the way for a visit to the December 2022 low at 10671 (December 22) ahead of the November 2022 low at 10632 (November 4). The daily RSI retreated from the overbought territory and broke below the 67 level.
Top Gainers: Regeneron Pharma, Gilead, Apple
Top Losers: Datadog, Amazon.com, Atlassian Corp Plc
Resistance levels: 12880 13175 13720 (4H chart)
Support levels: 11928 11550 11448 (4H chart)
DOW JONES
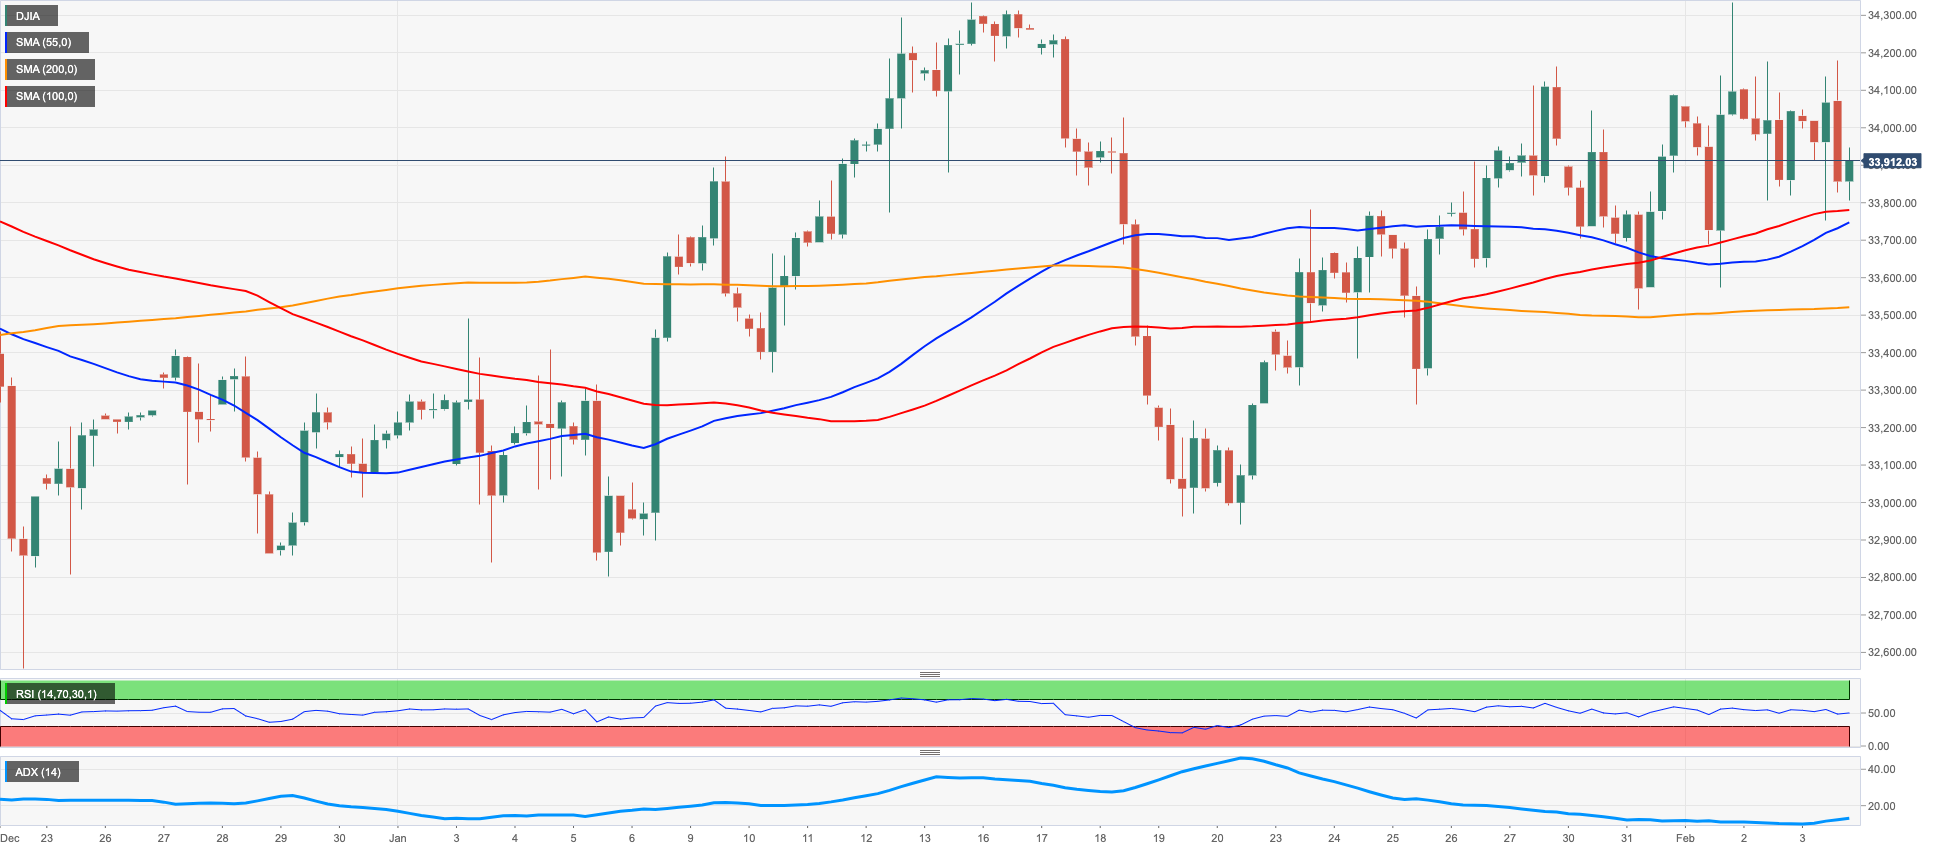
Stocks tracked by the three major US indices navigated a “sea of red” on Friday, adding at the same time to the negative price action seen on Thursday. Against that, the Dow Jones extended the erratic performance seen so far this year, closing the week slightly on the defensive and reversing the previous strong uptick.
The second consecutive daily drop in the Dow Jones came in response to rising jitters surrounding the potential next steps by the Federal Reserve, which were particularly reignited following the stellar prints from the US jobs report.
On the whole, the Dow Jones dropped 0.38% to 33926, the S&P500 deflated 1.03% to 4136 and the tech-heavy Nasdaq Composite lost 1.59% to 12006.
The Dow Jones appears to be facing some consolidation for the time being. There is a minor resistance level at the weekly high at 34334 (February 1) just before the 2023 peak at 34342 (January 13). Further up appears the December 2022 top at 34712 (December 13) prior to the April 2022 peak at 35492 and the February 2022 high at 35824 (February 9). Having said that, the breach of the interim 55-day SMA at 33661 could spark a deeper retracement to the weekly low at 32948 (January 20) prior to the December 2022 low at 32573 (December 22) and the key 200-day SMA at 32336. The daily RSI retreated to the proximity of 54.
Top Performers: American Express, Apple, JPMorgan
Worst Performers: Home Depot, Microsoft, 3M
Resistance levels: 34334 34712 35492 (4H chart)
Support levels: 33581 33273 32948 (4H chart)
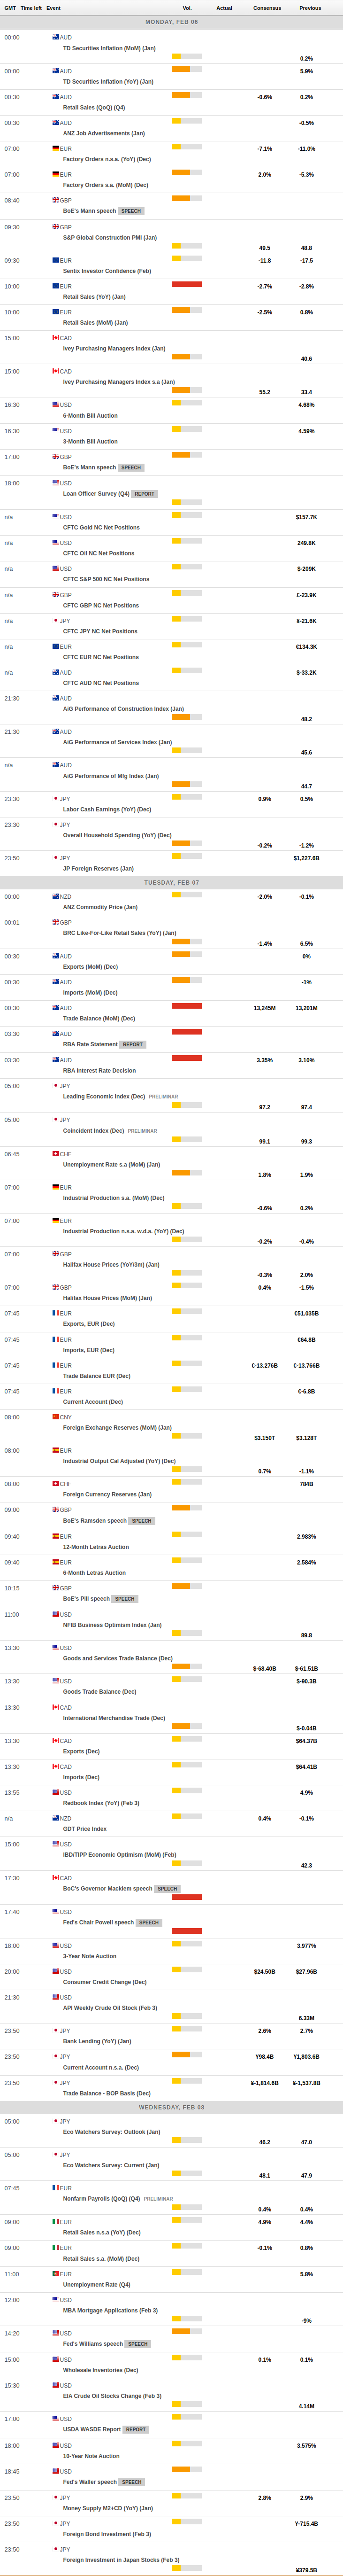
MACROECONOMIC EVENTS
All Information & Updates provided by:

All information relating to the financial markets available on this page has been prepared and issued by FXStreet (Forexstreet SL, Spain, Reg: B62498233) on the basis of publicly available information and all information believed to be reliable and does not conflict with Kuwaiti local laws, and all necessary care has been taken to before the company to ensure that the facts mentioned are correct from the source.
NCM Investment nor any of its directors or employees shall in any way be held responsible for the contents of this news, and the information contained on this page is intended only to provide clients with publicly available information and should not be construed as investment advice, report or analysis and/or constitute an offer or invitation to buy or sell financial instruments of any kind.
RISK WARNING: Forex and CFDs are highly risky leveraged products, as losses can exceed deposits. Please ensure you understand all the risks and take independent advice if necessary. NCM will segregate the clients based on the criteria of the regulator and its bylaws. NCM does not provide any advisory service; the material published does not constitute advice or a recommendation for a transaction in any financial instrument. NCM accepts no responsibility for any use of the content presented and any consequences of that use. Anyone acting on the information provided does so at their own risk.