
- Contact Us:
-

-

-

-


Daily Market Updates
07 Feb 2023
USDJPY
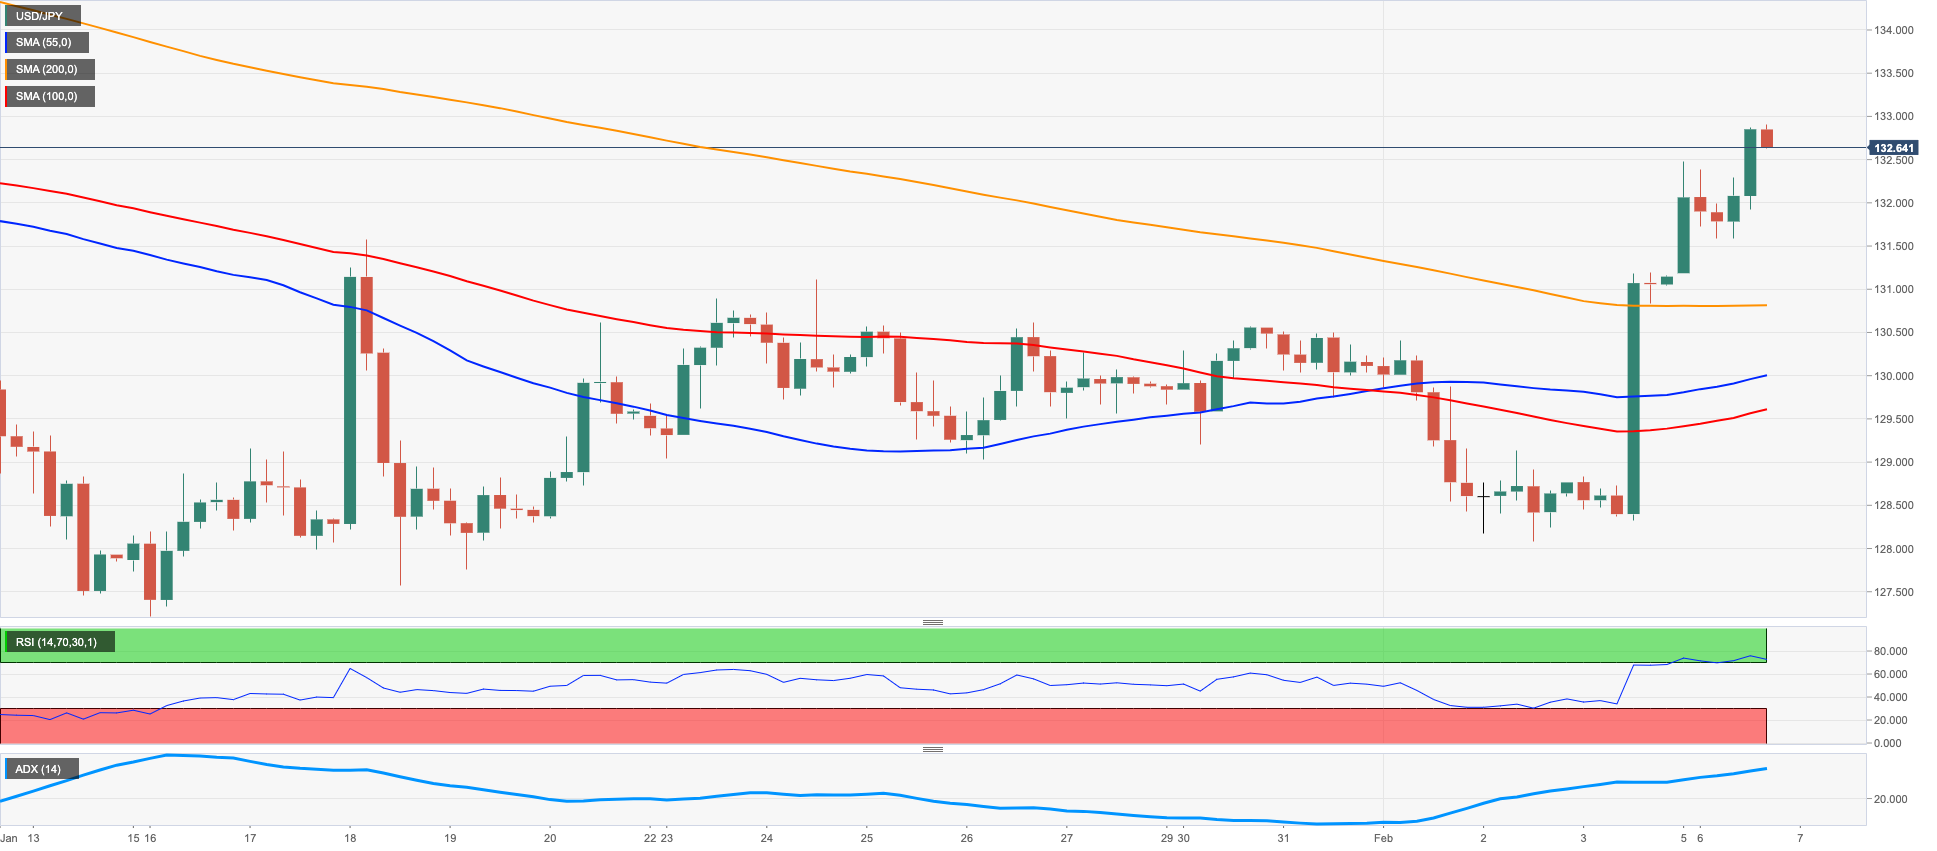
USD/JPY rapidly (and acutely) extended the NFP-induced rebound and advanced to the boundaries of the 133.00 hurdle on Monday, or fresh 5-week highs.
The sharp advance in the greenback propelled the USD Index (DXY) to multi-week peaks well north of the 103.00 yardstick, while US yields extended further the recovery and also clinched tops last seen many weeks ago.
In the domestic money market, the JGB 10-year yields came just short of the 0.50% level, up modestly for the day.
There were no scheduled data releases in Japan at the beginning of the week.
Immediately to the upside in USD/JPY now comes the temporary 55-day SMA at 133.28 before the 2023 top at 134.77 (January 6). Further up appears the key 200-day SMA at 136.78 followed by weekly peaks at 138.17 (December 15 2022) and 139.89 (November 30 2022), all ahead of the key round level at 140.00. Just the opposite, the February low at 128.08 (February 2) comes first seconded by the 2023 low at 127.21 (January 16) and the May 2022 low at 126.36 (May 24). The breach of this level puts a test of the weekly low at 121.27 (March 31 2022) back on the investors’ radar. The daily RSI rebounded markedly to the 57 zone.
Resistance levels: 132.90 134.77 137.47 (4H chart)
Support levels: 130.87 128.08 127.56 (4H chart)
GBPUSD
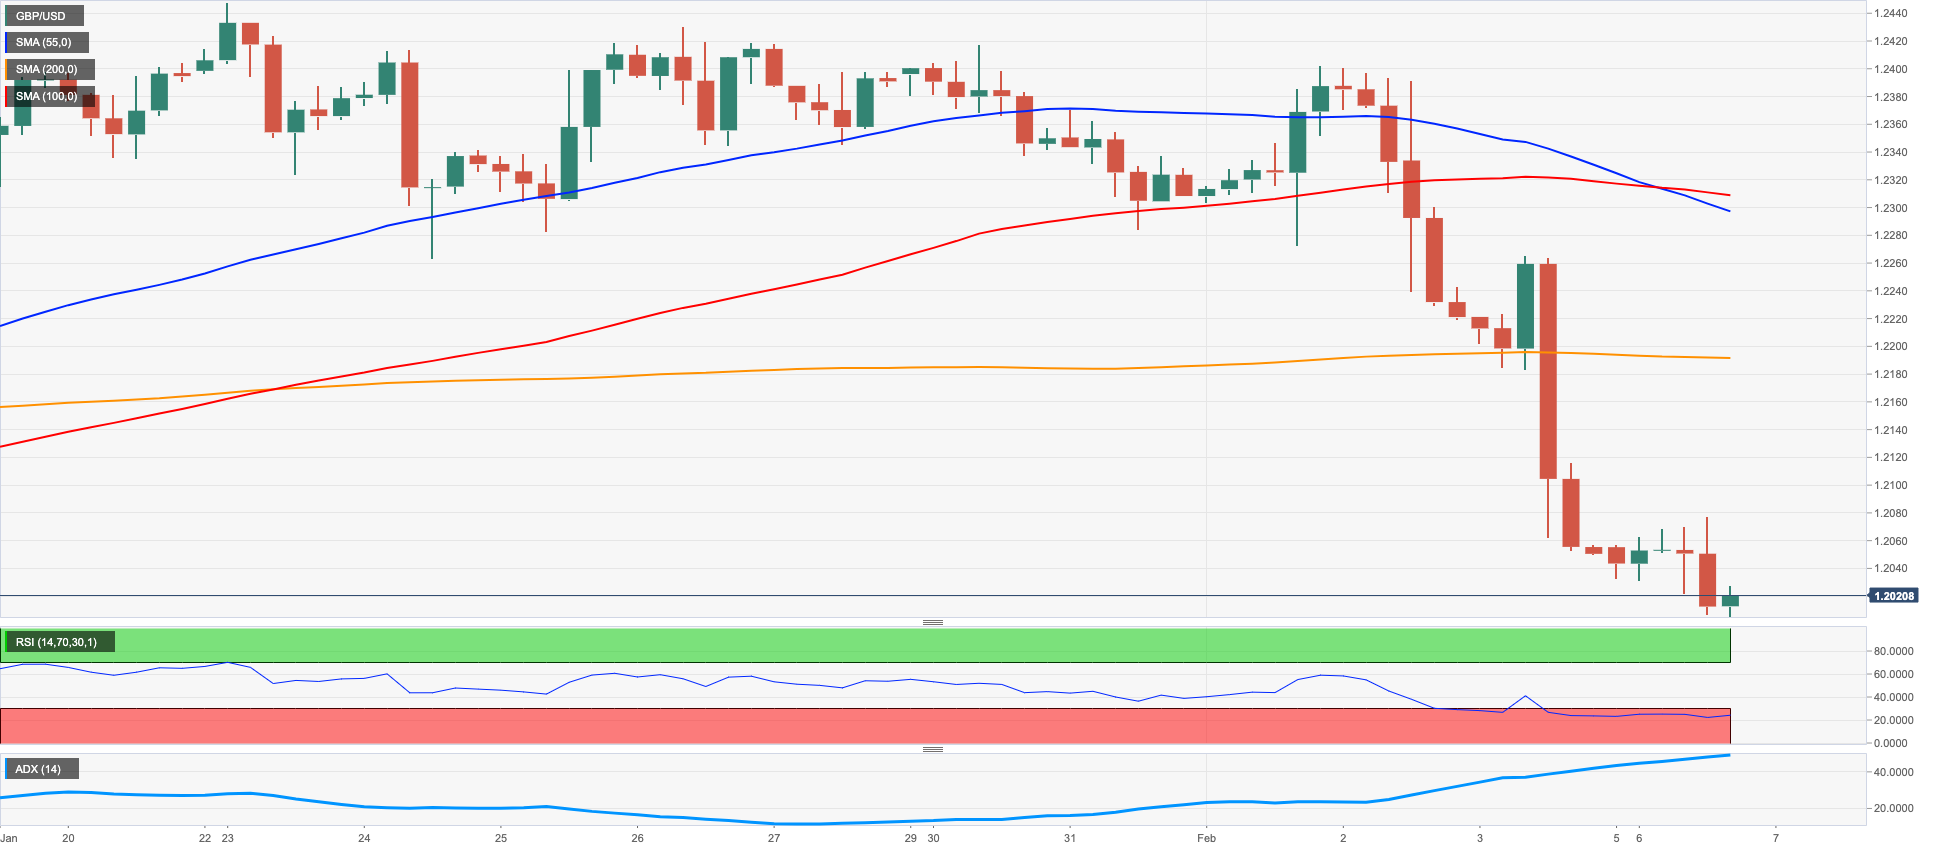
GBP/USD followed the rest of the risk complex and lost ground for the third consecutive session at the beginning of the week.
In fact, after an earlier bullish attempt to the 1.2080 region, Cable eventually succumbed to the intense demand for the greenback and dropped to the 1.2000 zone, where it has met some contention for the time being.
Further losses in the Sterling, in the meantime, appeared to have been trimmed in response to the hawkish comments from BoE’s MPC member C.Mann, who advocated for another rate hike at the next meeting. In addition, Mann suggested that the consequences of under tightening far outweigh the alternative.
In the UK data space, New Car Sales expanded at an annualized 14.7% in January and the S&P Global/CIPS Construction PMI eased a tad to 48.4 during last month (from 48.8).
Next on the downside for GBP/USD comes the key 1.2000 round level closely followed by the 200-day SMA at 1.1950. The loss of this region exposes a deeper drop to the January low at 1.1841 (January 6). Conversely, there is an interim up barrier at the 55-day SMA at 1.2173 ahead of the 2023 peak at 1.2447 (January 23). North from here turns up the May 2022 high at 1.2666 (May 27) ahead of the key 200-week SMA at 1.2896 and the psychological 1.3000 mark. The daily RSI collapsed to the 37 zone.
Resistance levels: 1.2187 1.2265 1.2302 (4H chart)
Support levels: 1.2005 1.1841 1.1778 (4H chart)
AUDUSD
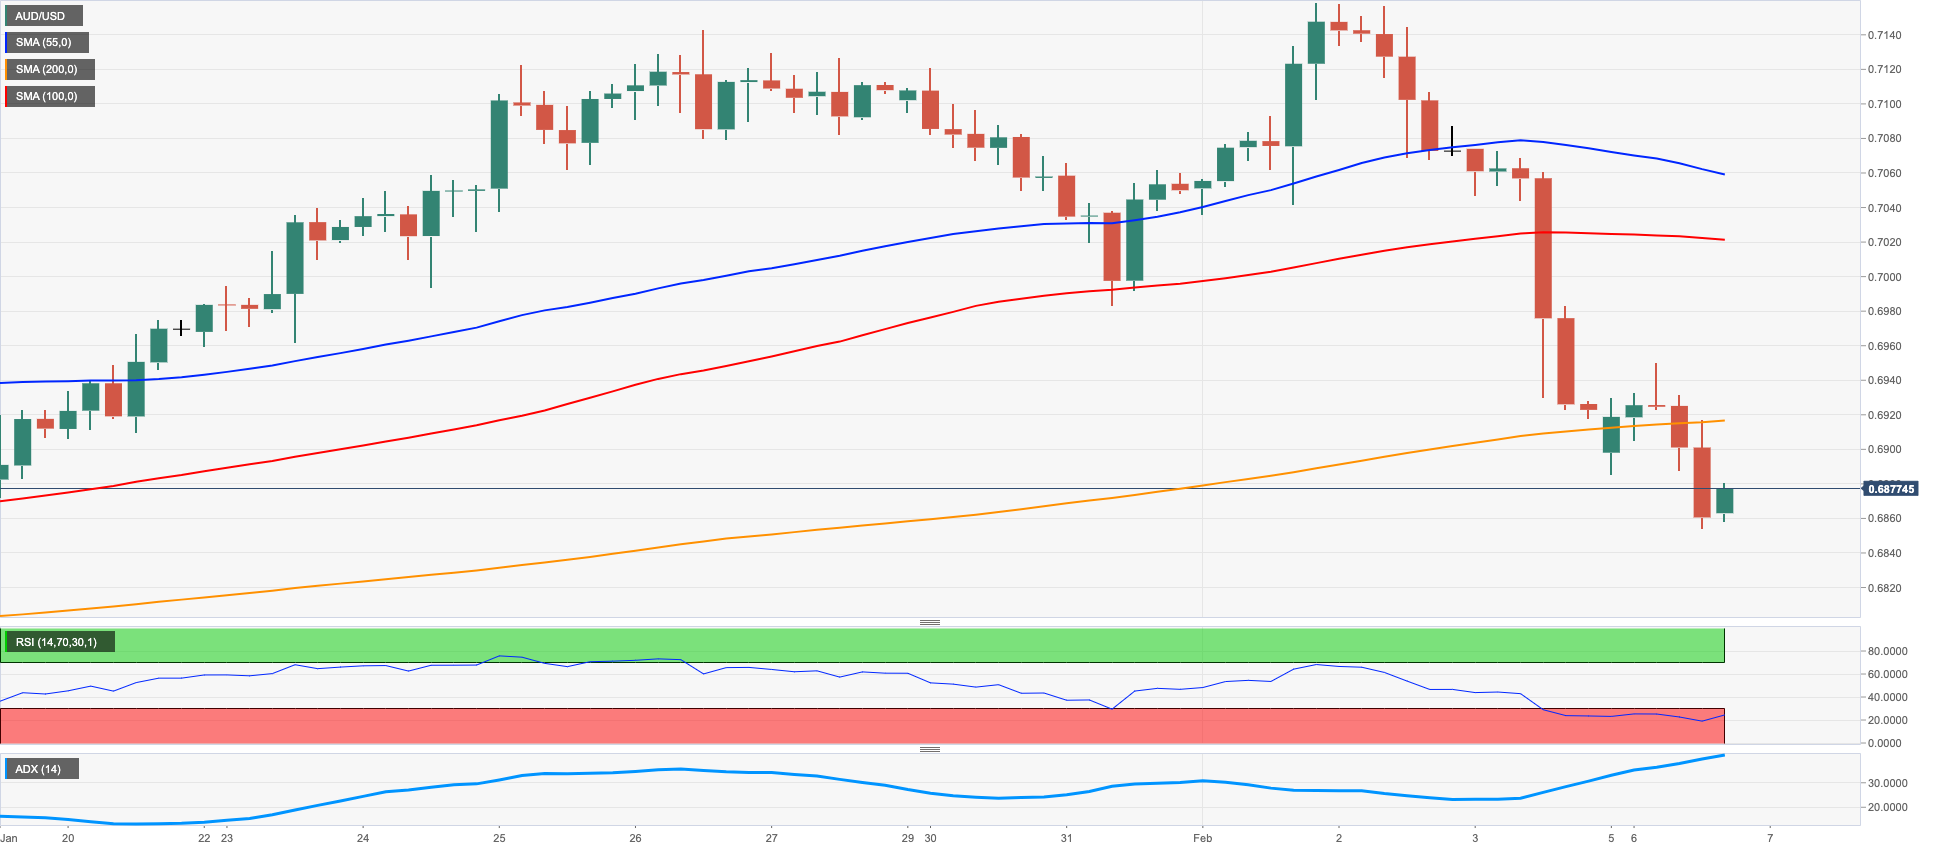
AUD/USD extended the leg lower for the third straight session and printed new 5-week lows in the mid-0.6800s on Monday.
The pronounced pullback in the pair came in response to further gains in the greenback, as investors seem to favour a more restrictive monetary stance from the Federal Reserve for longer than previously estimated. This latter view picked up extra pace in the wake of the stellar prints from January Payrolls.
Extra weakness for the Aussie dollar came from another poor session in the commodity complex, which saw copper prices extend the retracement vs. humble gains in prices of the tonne of iron ore.
No data releases Down Under on Monday left all the attention to the RBA monetary policy meeting due on Tuesday. The central bank is widely anticipated to hike the OCR by 25 bps to 3.35%. Additional results will see the Balance of Trade figures as well as the Ai Group Industry Index and the Ai Group Services Index.
The continuation of the downtrend could see AUD/USD revisit the temporary 55-day SMA at 0.6841 just before the key 200-day SMA at 0.6807. Once the latter is cleared, a probable test of the January low at 0.6688 (January 3) could start shaping up ahead of the December 2022 low at 0.6629 (December 20). On the other hand, there are no up barriers of significance until the 2023 high at 0.7157 (February 2) prior to the round level at 0.7200 and the June 2022 high at 0.7282 (June 3). The daily RSI dropped further and flirted with 44.
Resistance levels: 0.6907 0.6948 0.7019 (4H chart)
Support levels: 0.6855 0.6722 0.6688 (4H chart)
GOLD
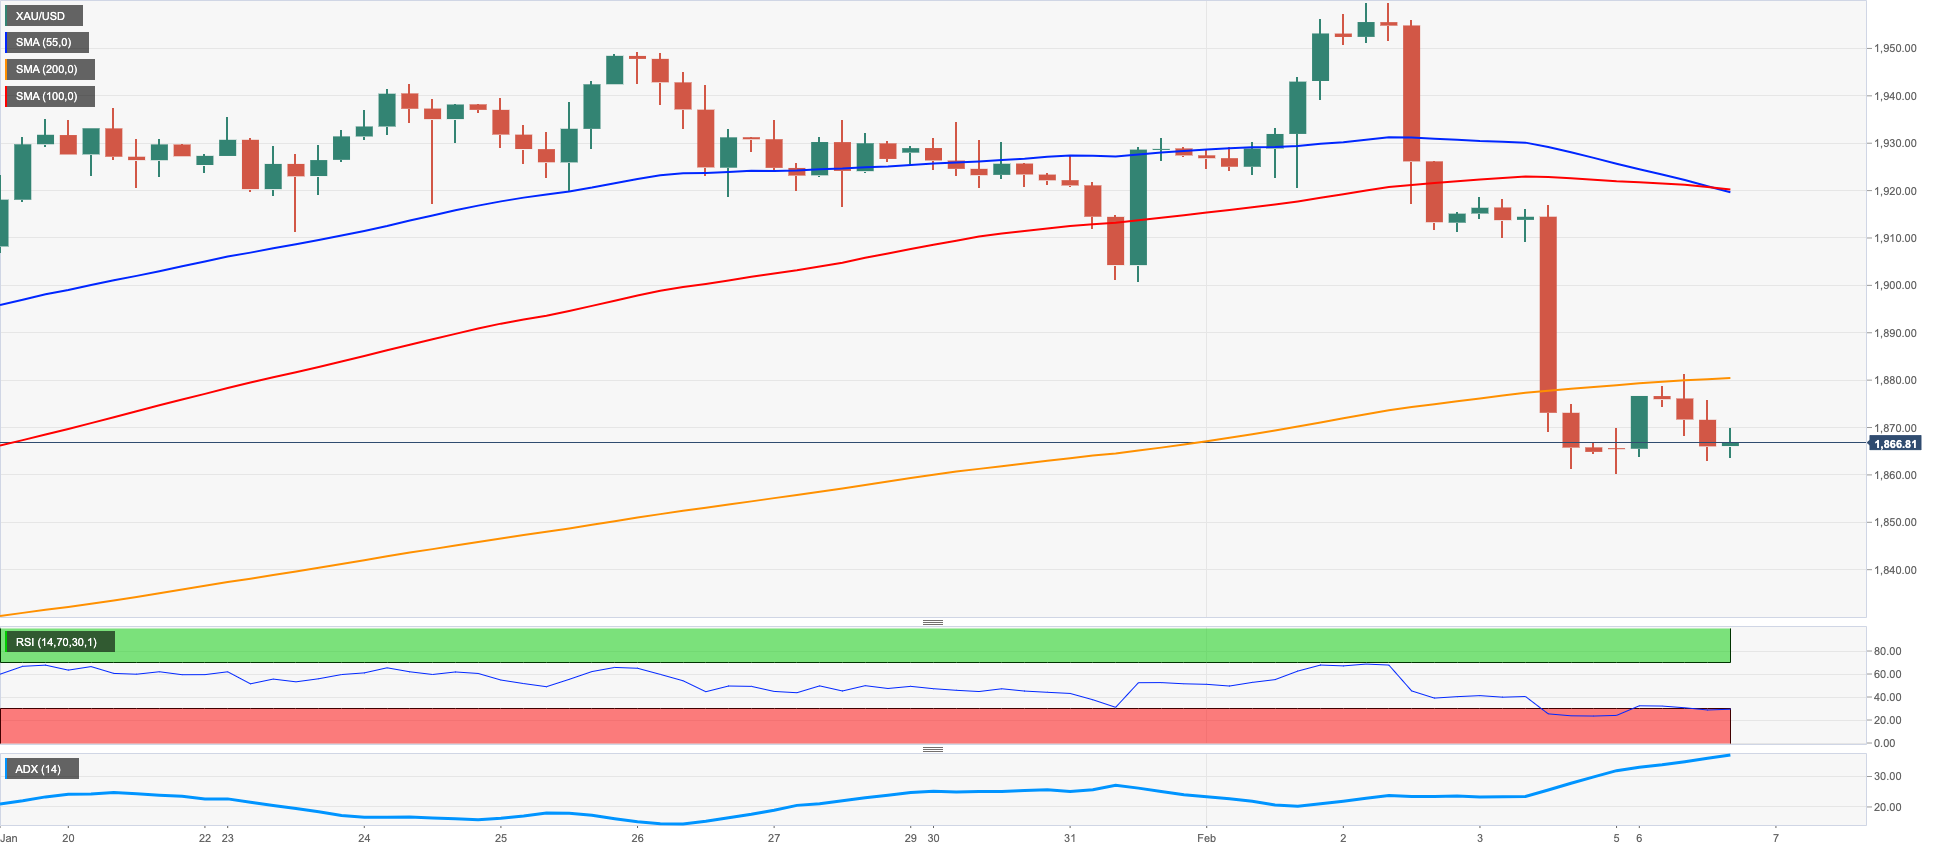
Gold alternated gains with losses near the $1865 level at the beginning of the week, meeting some contention near $1860 per ounce troy following two consecutive strong pullbacks.
It is worth recalling that gold lost more than 3% during last week, and nearly 5% from Thursday’s top close to $1960 to Friday’s close around $1865.
The persevering rebound in the greenback – led by solid NFP figures – kept the price action around the yellow metal subdued on Monday, while another session with gains in US yields across the curve also put bullion under extra pressure.
Moving forward, gold faces the next risk event on Tuesday, when Chief Powell will participate in a discussion panel at the Economic Club of Washington.
If the corrective decline in gold picks up extra impulse, then the 55-day SMA at $1837 is expected to offer provisional contention prior to the key $1800 region and the 200-day SMA at $1776. A drop below this zone could open the door to a quick test of the 100-day SMA at $1765 before the weekly low at $1727 (November 23). In the opposite direction, the next up barrier emerges at the 2023 top at $1959 (February 2) ahead of the April 2022 peak at $1998 (April 18) and the psychological $2000 mark. Up from here comes the 2022 top at $2070 (March 8).
Resistance levels: $1881 $1921 $1959 (4H chart)
Support levels: $1861 $1825 $1797 (4H chart)
CRUDE WTI
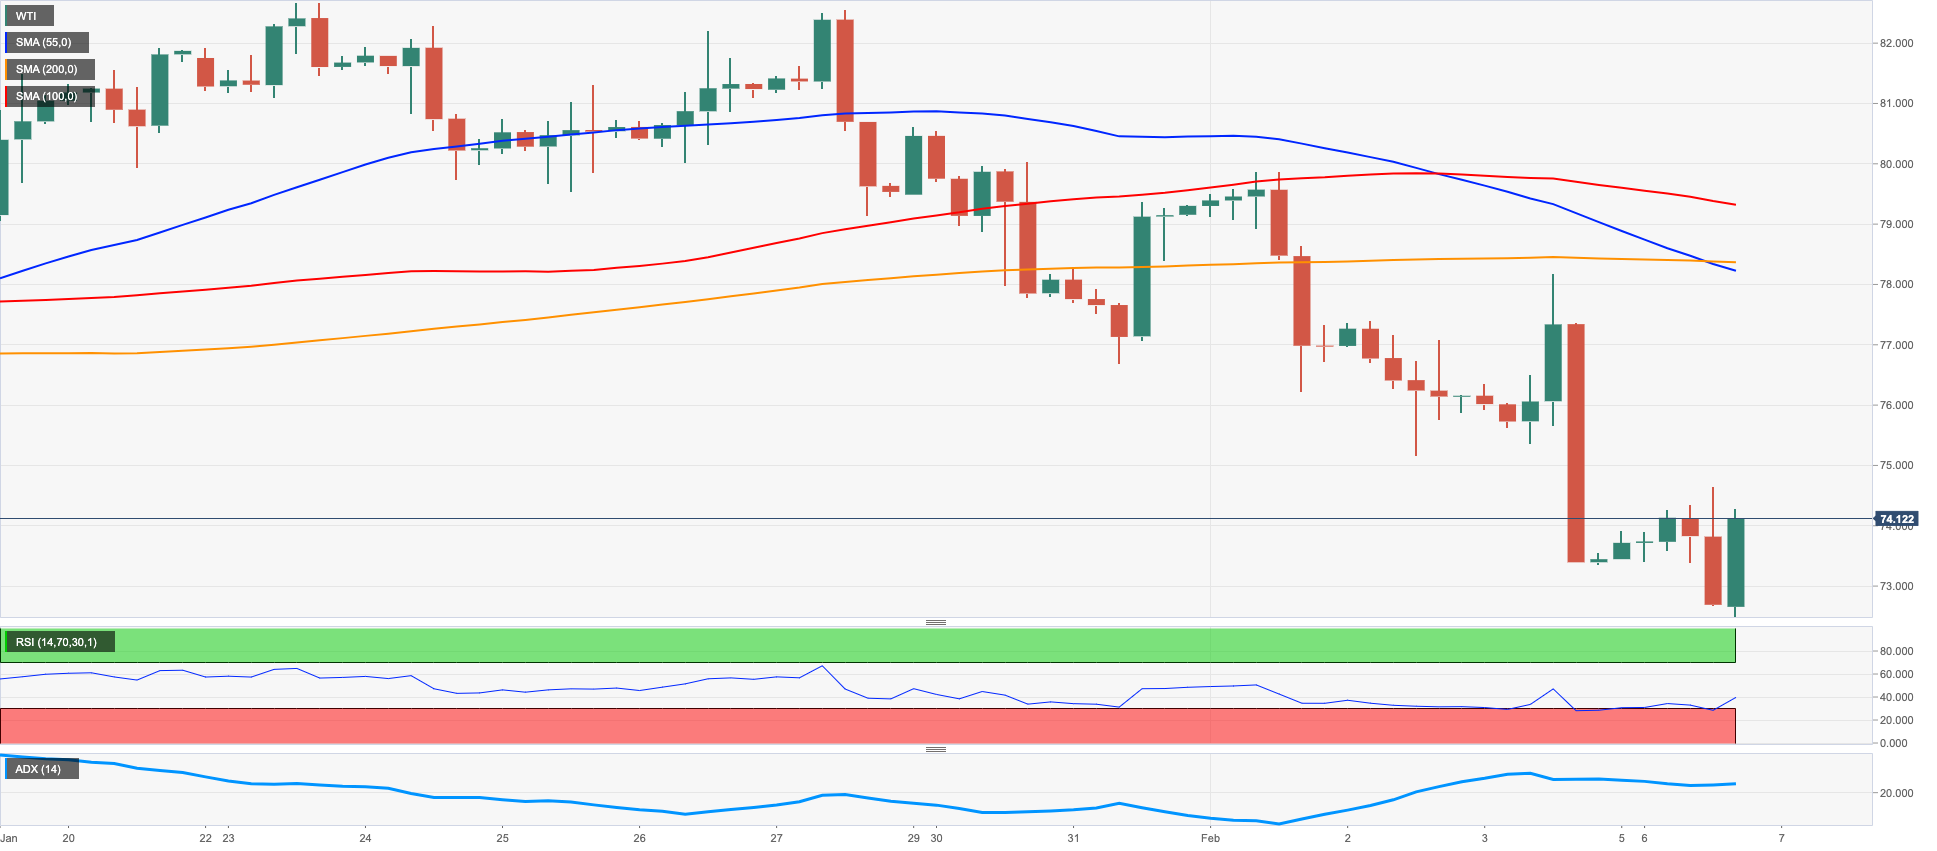
After hitting a new 2023 low at $72.30 per barrel on a stronger dollar and concerns surrounding a potential economic slowdown, prices of the West Texas Intermediate (WTI) eventually managed to regain some balance and attempted a decent bounce to the area above the $74.00 mark at the beginning of the week.
In fact, crude oil prices reversed three consecutive daily retracements and ignored the strong bid bias in the greenback, as traders refocused on supply concerns, this time stemming from the aftermath of the earthquake in Türkiye and following the kickstart on Sunday of the EU/G7price cap on Russian exports of crude oil products.
Prices of the WTI remained under pressure and the breach of the 2023 low at $72.30 (February 6) could prompt a test of the 2022 low at $70.10 (December 9) to emerge on the horizon just ahead of the key round level at $70.00 and the weekly low at $66.15 (December 20 2021). On the flip side, interim up barriers emerge at the 55- and 100-day SMAs at $77.53 and $81.28, respectively, prior to the 2023 high at $82.60 (January 23). If the WTI clears the latter, it could then challenge the December 2022 top at $83.32 (December 1) prior to the $90.08 level (November 11 2022) and the 200-day SMA at $91.51.
Resistance levels: $77.96 $79.68 $80.26 (4H chart)
Support levels: $72.22 $70.07 $66.11 (4H chart)
GER40
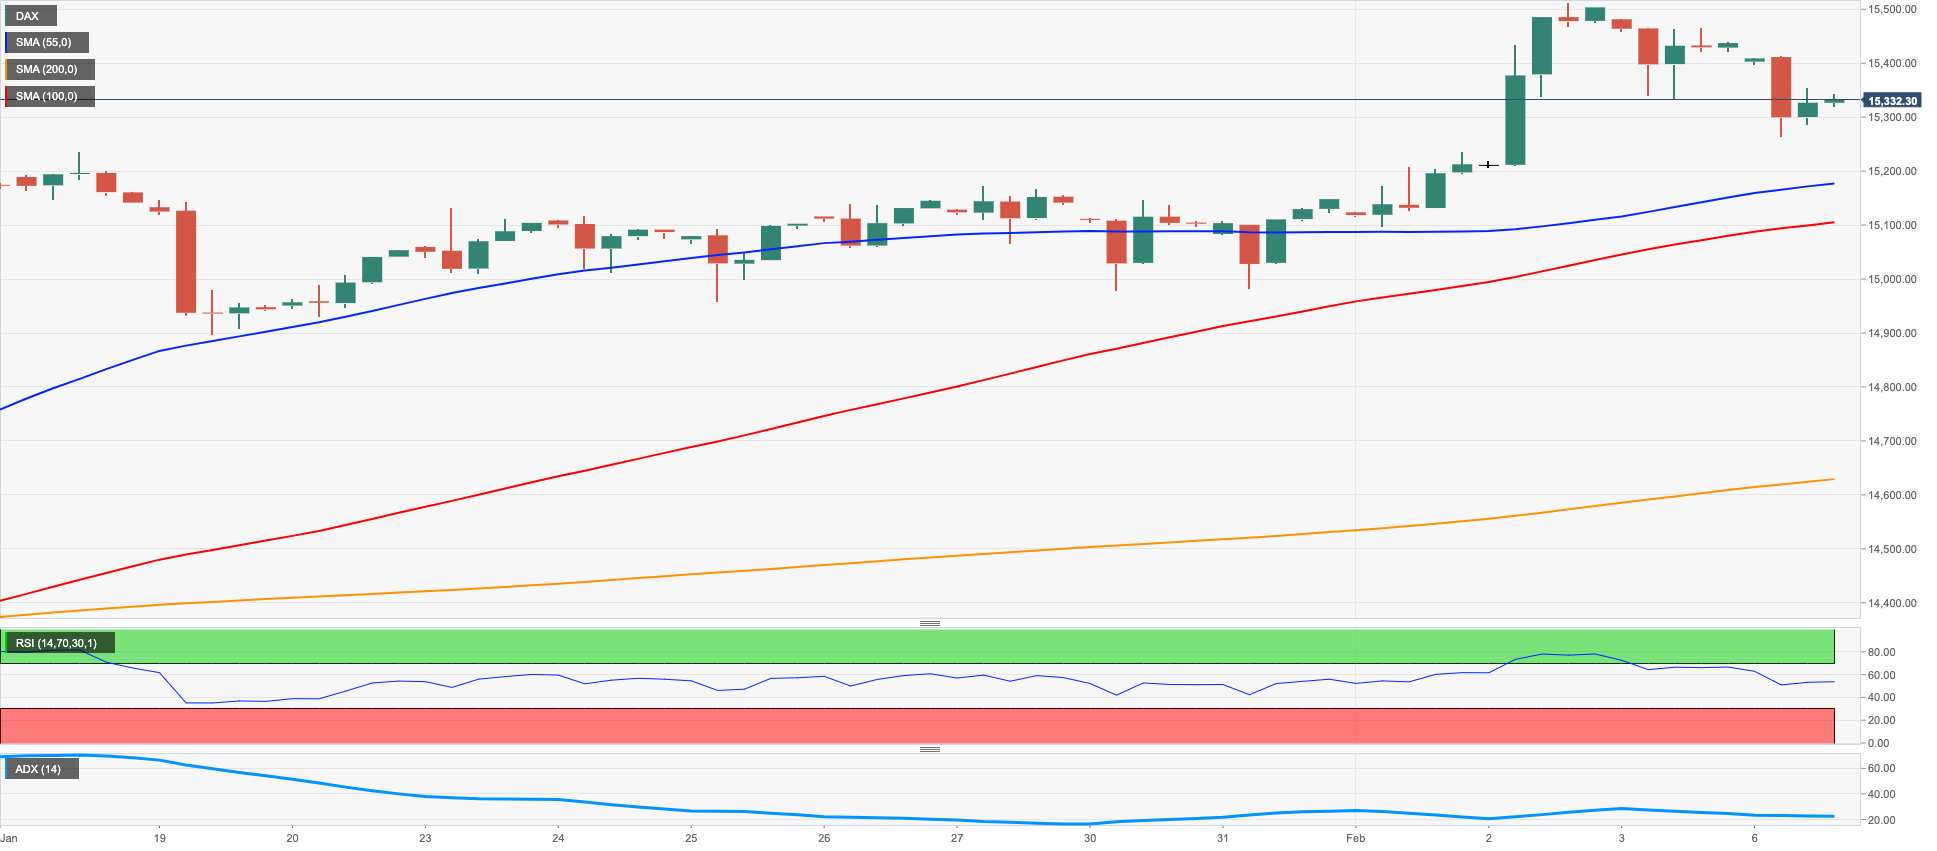
The German stock benchmark index DAX40 lost ground for the second session in a row on Monday, this time retreating to 2-day lows and closing the session around the 15300 region.
The solid report from US Nonfarm Payrolls in January (+517K) spooked investors and reignited concerns of longer-than-expected tightening stance from major central banks, despite the ECB left the door open to some re-assessment of its hiking cycle after the March event.
From the domestic money market, the 10-year Bund yields extended the rebound and retested the 2.30% region.
In Germany, Factory Orders expanded at a monthly 3.2% in December and the Construction PMI ticked higher to 43.3 in January.
Further upside in the DAX40 appears likely despite Monday’s retracement. That said, there is an initial hurdle at the 2023 peak at 15520 (February 2) ahead of the February 2022 high at 15736 (February 2 2022). The surpass of this level could pave the way for a move to the round level at 16000 before the 2022 top at 16285 (January 5). Having said that, bears should focus on the weekly low at 14906 (January 19) ahead of the provisional 55-day SMA at 14585 and the December 2022 low at 13791 (December 20). Down from here emerges the key 200-day SMA at 13653 before the November 2022 low at 13022 (November 3). The daily RSI retreated to the 66 zone.
Best Performers: Bayer, Sartorius AG VZO, Fresenius Medical Care KGAA ST
Worst Performers: Zalando SE, Adidas, Dr Ing hc F Porsche AG Pfd
Resistance levels: 15520 15614 15736 (4H chart)
Support levels: 15275 15143 14906 (4H chart)
NASDAQ
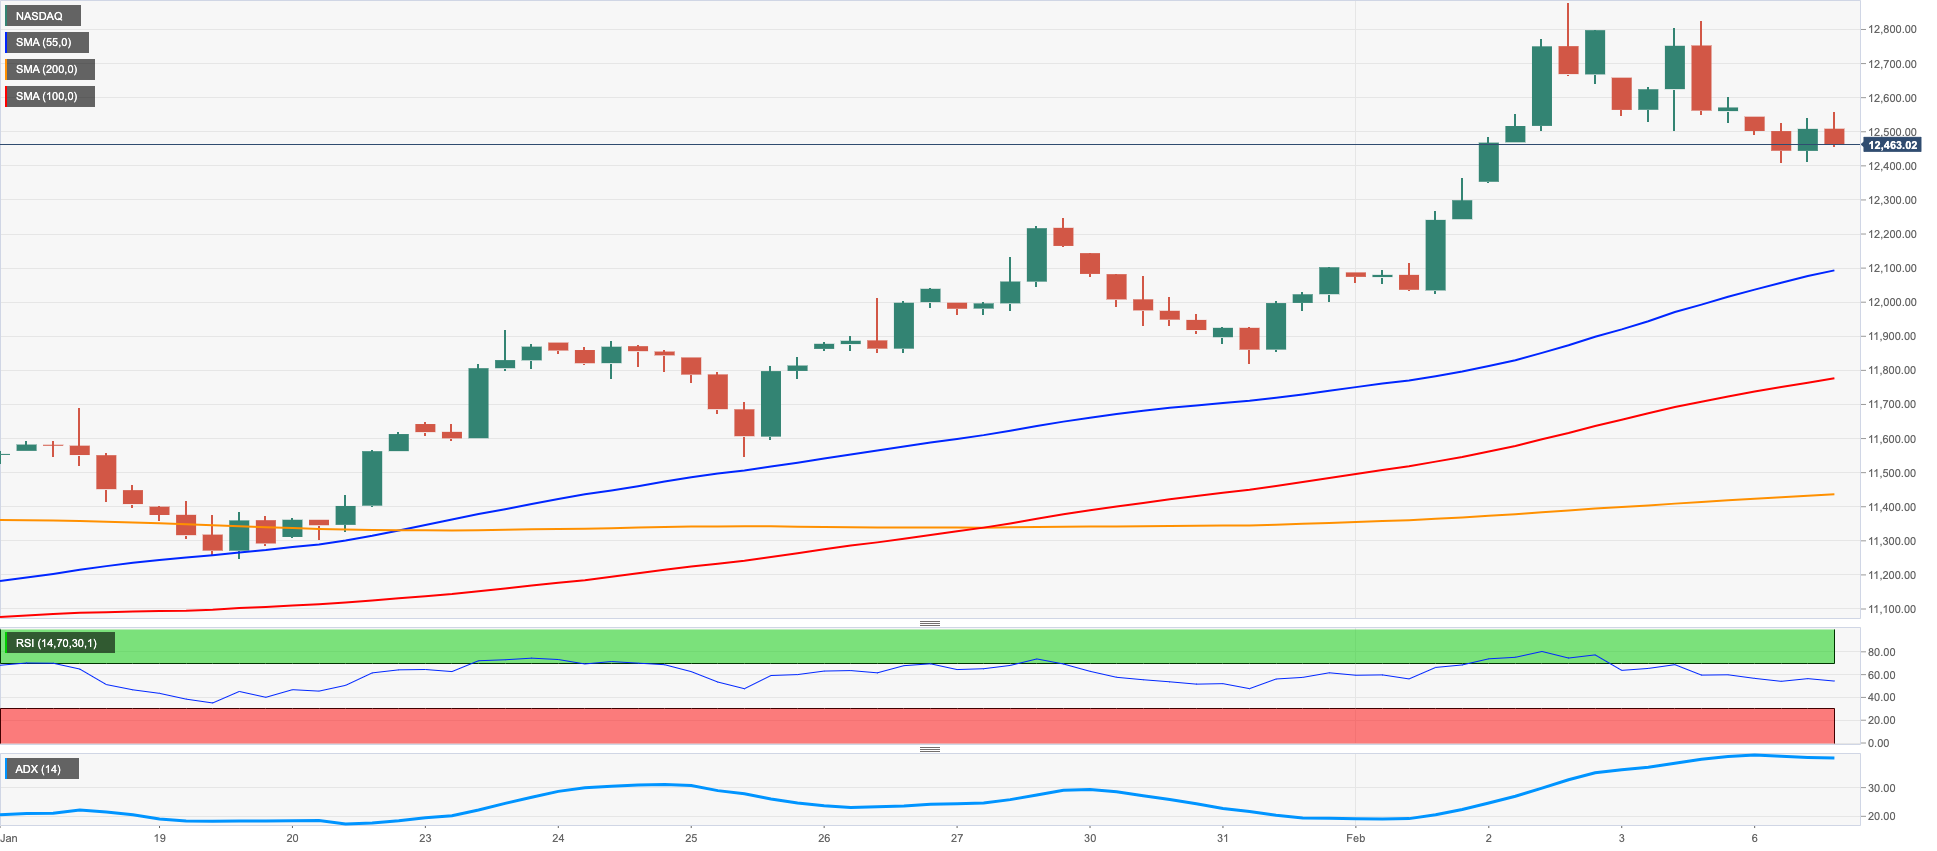
Tech equities gauged by the Nasdaq 100 added to Friday’s losses and deflated to 3-day lows near 12400 on Monday.
The persevering selling pressure in the risk-associated space in combination with the acute bounce in the dollar and the equally strong advance in US yields across the curve all kept the price action around the tech sector depressed at the beginning of the week.
Collaborating with the decline re-emerged concerns over a probable slowdown in the economic activity, as recent solid results from the US labour market underpins further tightening by the Fed.
Despite the knee-jerk, the Nasdaq 100 continues to initially target the 2023 top at 12880 (February 2) just before the round level at 13000 and ahead of the weekly peak at 13175 (August 26 2022). The other way around, the key 200-day SMA at 11952 is expected to offer decent contention prior to weekly lows at 11550 (January 25) and 11251 (January 19). The loss of these levels could put the January low at 10696 (January 6) back on the investors’ radar ahead of the December 2022 low at 10671 (December 22) and the November 2022 low at 10632 (November 4). The daily RSI extended the drop to the sub-65 area.
Top Gainers: Biogen, Tesla, Gilead
Top Losers: Activision Blizzard, Micron, Marvell
Resistance levels: 12880 13175 13720 (4H chart)
Support levels: 11928 11550 11447 (4H chart)
DOW JONES
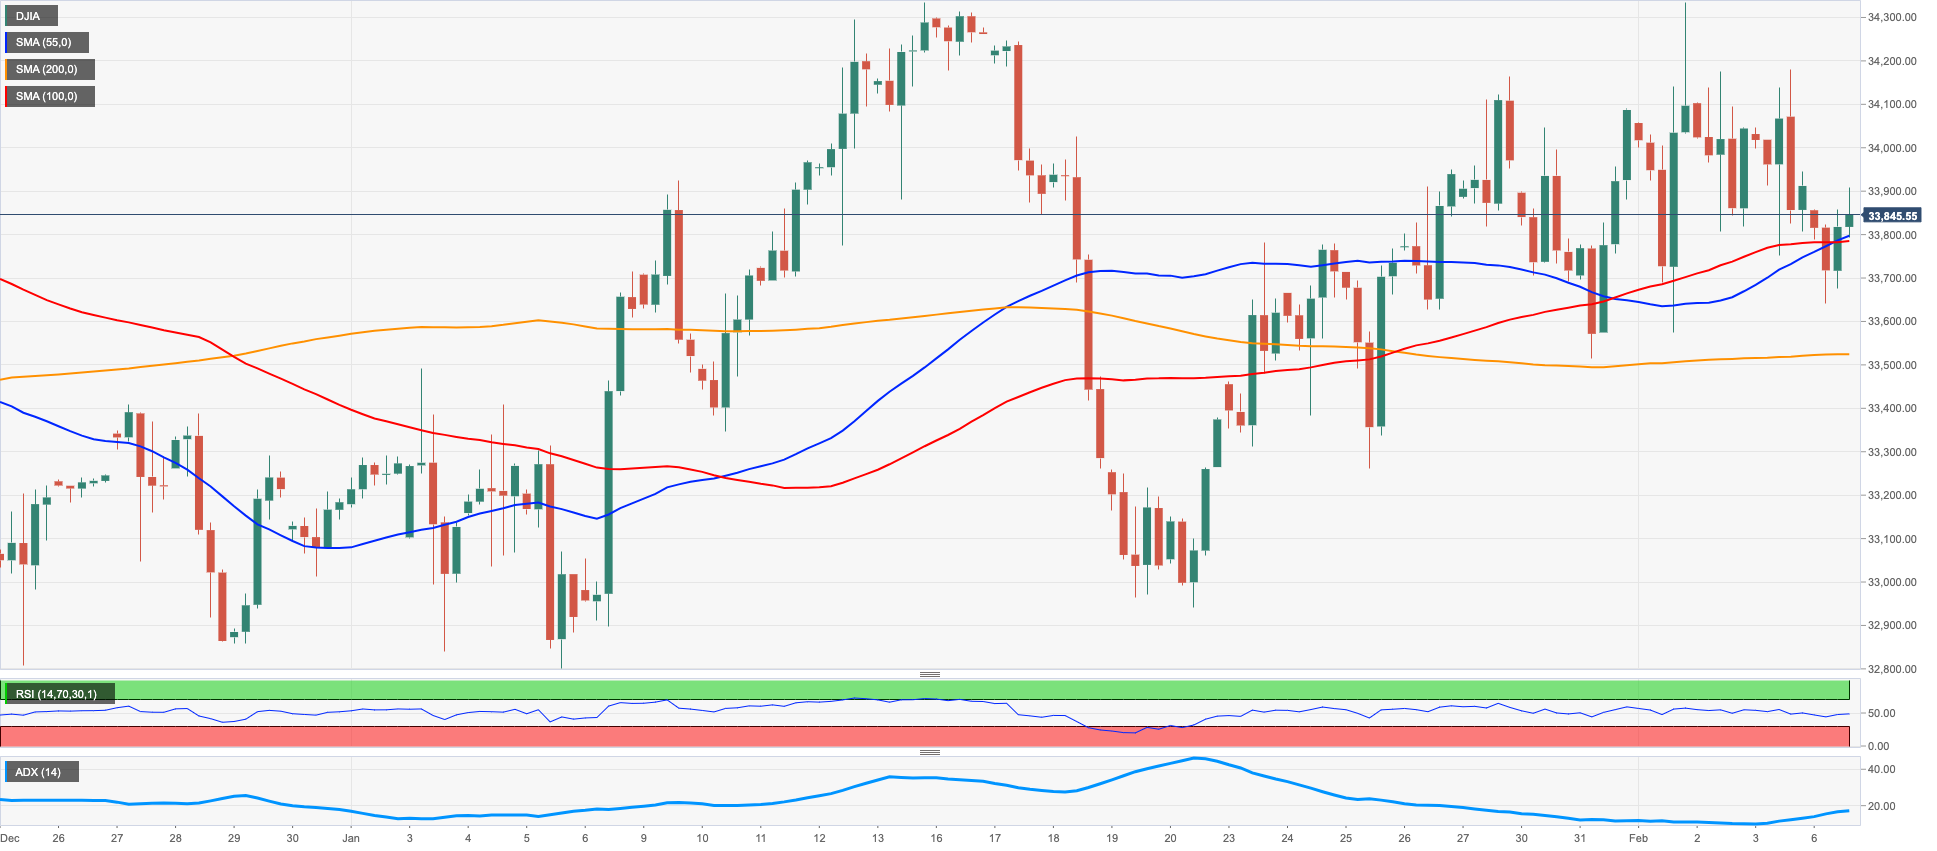
US equities started the week in a downbeat mood and charted modest losses when tracked by the Dow Jones on Monday, always against the backdrop of the strong greenback and a persistent risk-off bias.
Traders’ sentiment remained cautious following the stellar US jobs report published on Friday, which all in all reinforces a more restrictive stance from the Federal Reserve and opens the door to further tightening in the next months.
In the meantime, Chief Powell and other FOMC members are due to speak throughout this week and will surely shed further light into the potential next steps by the Fed.
All in all, the Dow Jones lost 0.17% to 33867, the S&P500 retreated 0.60% to 4111 and the tech-reference Nasdaq Composite gave away 0.86% to 11904.
If the Dow Jones surpasses the weekly top at 34334 (February 1) it should rapidly confront the 2023 high at 34342 (January 13). North from here emerges the December 2022 peak at 34712 (December 13) seconded by the April 2022 high at 35492 and the February 2022 top at 35824 (February 9). In the opposite direction, further losses could retest the weekly low at 32948 (January 20) ahead of the December 2022 low at 32573 (December 22) and the key 200-day SMA at 32329. The daily RSI deflated slightly to the 53 yardstick.
Top Performers: Caterpillar, Travelers, Merck&Co
Worst Performers: Intel, Nike, Walgreen Boots
Resistance levels: 34334 34712 35492 (4H chart)
Support levels: 33581 33273 32948 (4H chart)
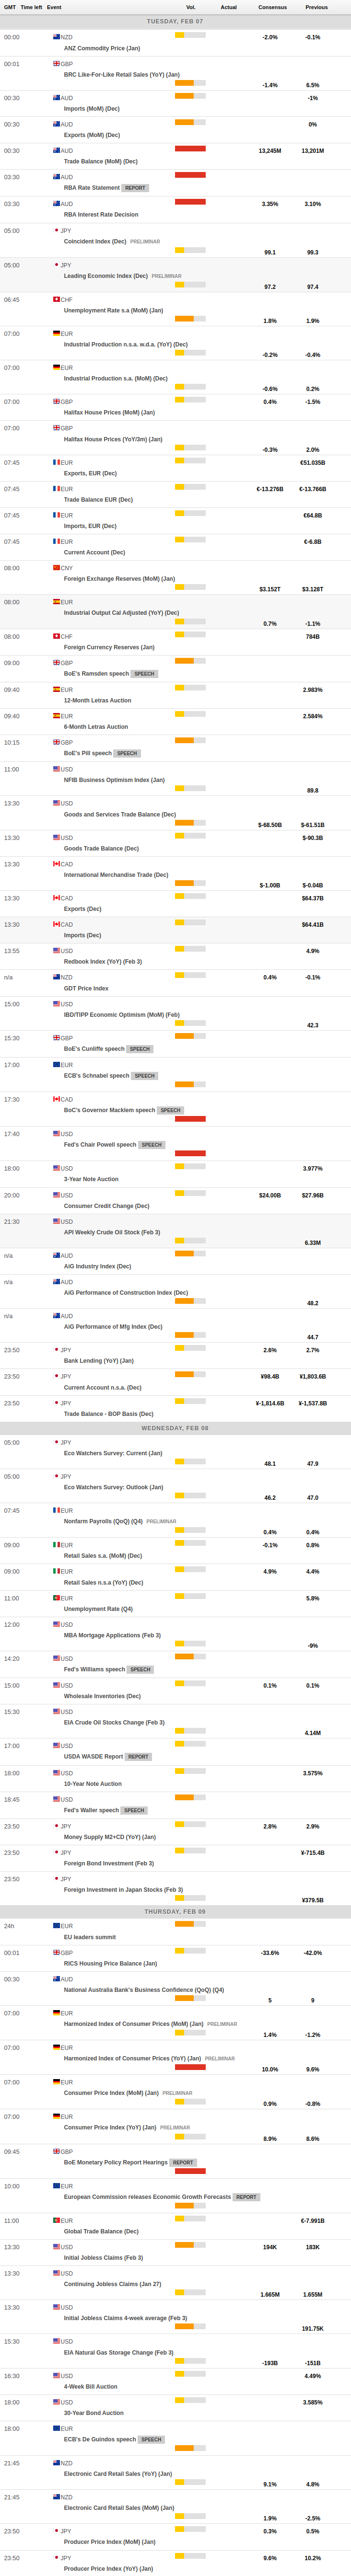
MACROECONOMIC EVENTS
All Information & Updates provided by:

All information relating to the financial markets available on this page has been prepared and issued by FXStreet (Forexstreet SL, Spain, Reg: B62498233) on the basis of publicly available information and all information believed to be reliable and does not conflict with Kuwaiti local laws, and all necessary care has been taken to before the company to ensure that the facts mentioned are correct from the source.
NCM Investment nor any of its directors or employees shall in any way be held responsible for the contents of this news, and the information contained on this page is intended only to provide clients with publicly available information and should not be construed as investment advice, report or analysis and/or constitute an offer or invitation to buy or sell financial instruments of any kind.
RISK WARNING: Forex and CFDs are highly risky leveraged products, as losses can exceed deposits. Please ensure you understand all the risks and take independent advice if necessary. NCM will segregate the clients based on the criteria of the regulator and its bylaws. NCM does not provide any advisory service; the material published does not constitute advice or a recommendation for a transaction in any financial instrument. NCM accepts no responsibility for any use of the content presented and any consequences of that use. Anyone acting on the information provided does so at their own risk.