
- Contact Us:
-

-

-

-


Daily Market Updates
08 Feb 2023
USDJPY
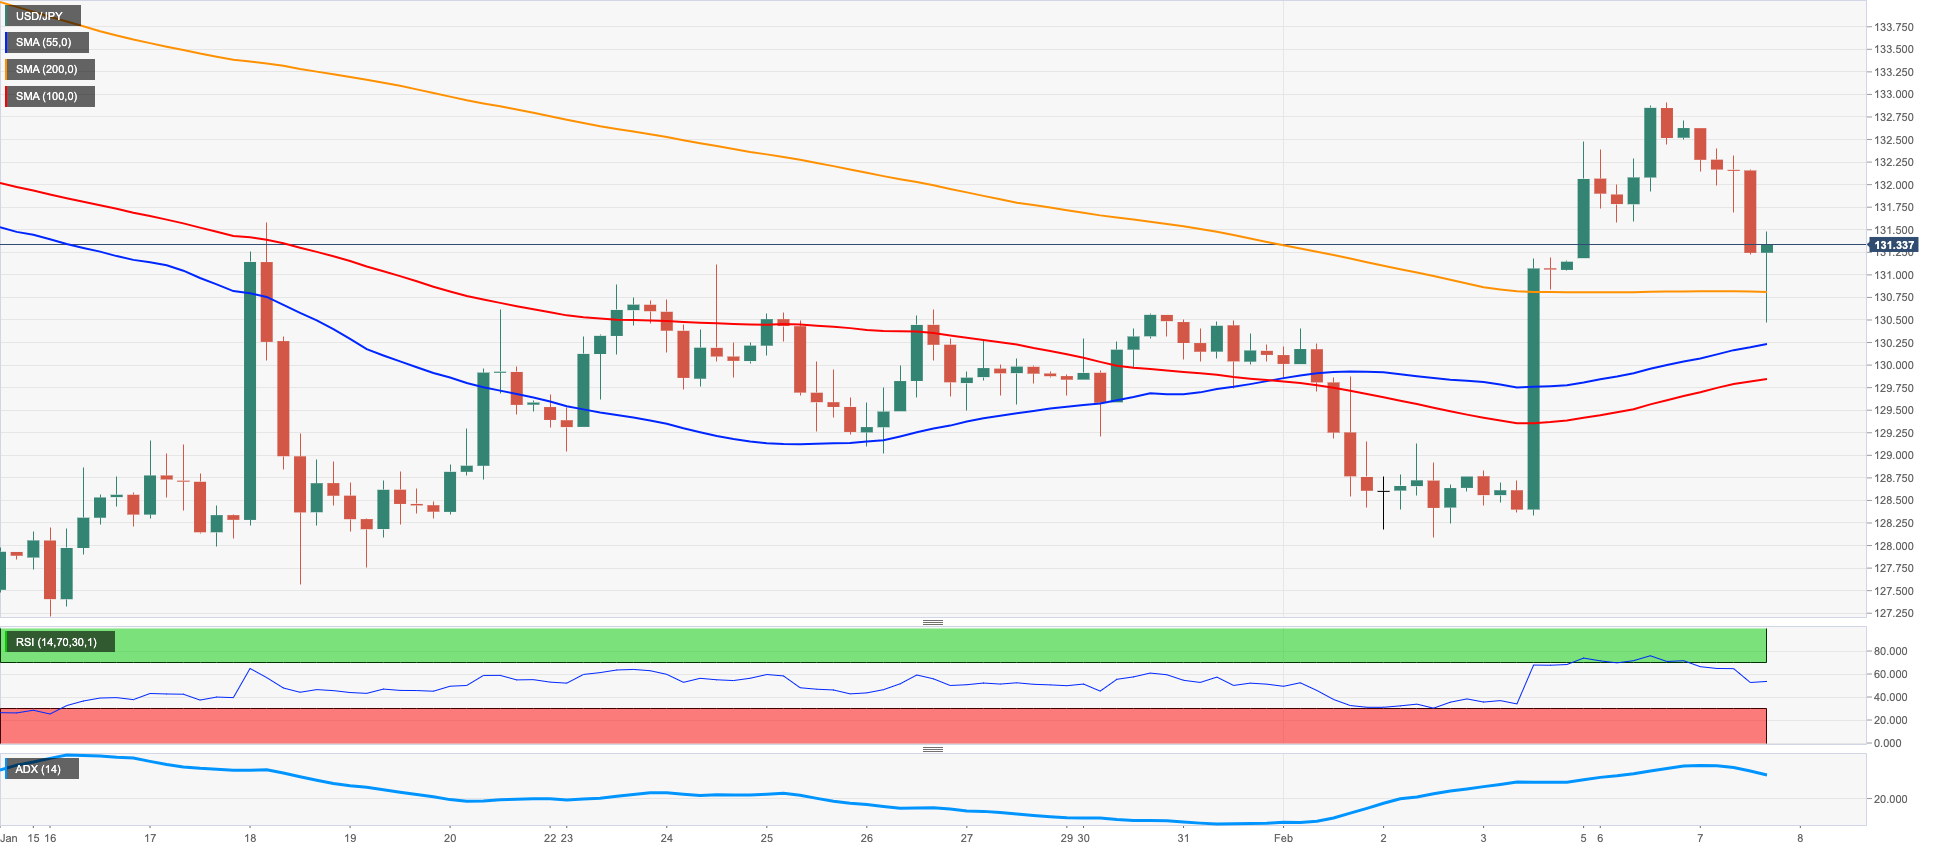
After climbing to as high as the 133.00 region at the beginning of the week, USD/JPY saw the recent acute rebound sharply trimmed on Tuesday.
Indeed, the corrective decline in the greenback motivated the USD Index to trade on the defensive, while the knee-jerk in US yields across the curve also collaborated with the downward bias in spot.
Favouring the daily pullback, the demand for the Japanese yen was underpinned by the resumption of the risk aversion in the global markets.
In Japan, the JGB yields treaded water around the 0.50% region and charted humble gains for the day.
In the domestic calendar, data releases for the month of December saw Household Spending contract at an annualized 1.3%, while flash readings expect the Coincident Index at 98.9 and the Leading Economic Index at 97.2.
If USD/JPY surpasses the provisional 55-day SMA at 133.10, it could challenge the 2023 peak at 134.77 (January 6) ahead of the key 200-day SMA at 136.78. Beyond the latter emerges weekly high at 138.17 (December 15 2022) and 139.89 (November 30 2022), all prior to the key round level at 140.00. For all that, there is an initial support at the February low at 128.08 (February 2) closely followed by the 2023 low at 127.21 (January 16). The breakdown of this level could prompt a visit to the May 2022 low at 126.36 (May 24) to emerge on the horizon ahead of the weekly low at 121.27 (March 31 2022). The daily RSI gave away some ground and receded to the vicinity of 51.
Resistance levels: 132.90 134.77 137.47 (4H chart)
Support levels: 130.47 128.08 127.56 (4H chart)
GBPUSD
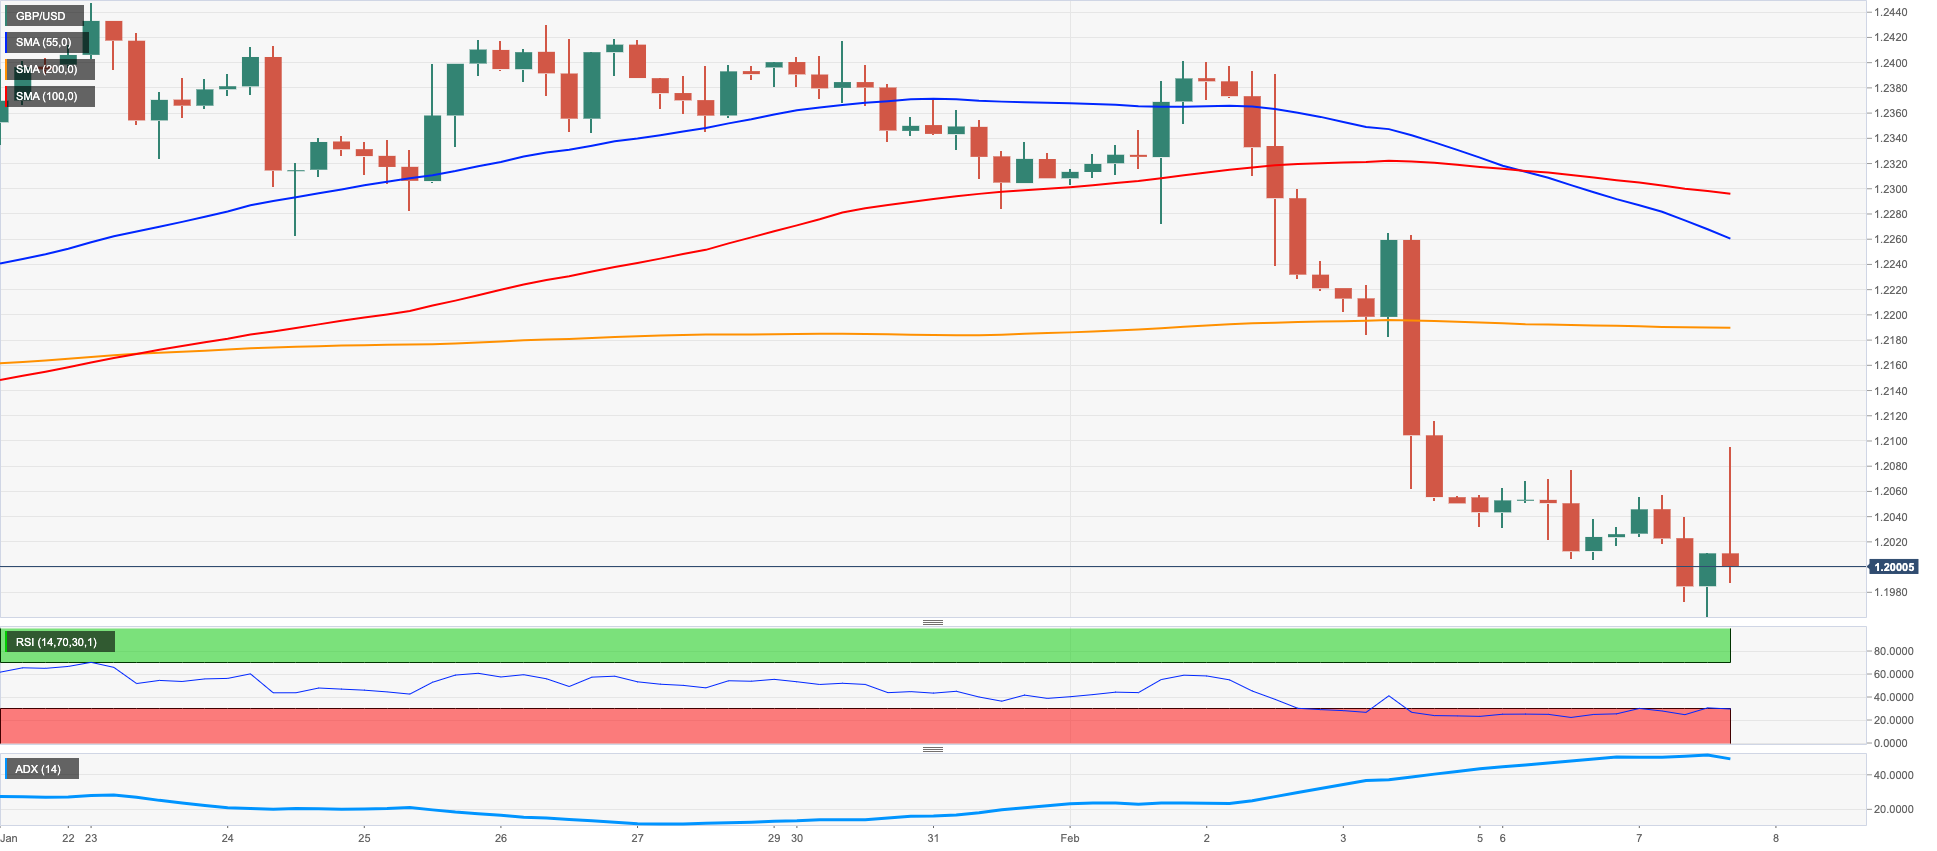
GBP/USD retreated for the fourth session in a row and broke below the critical 1.2000 support on Tuesday. lower on Tuesday, this time breaking below the critical 1.2000 support just to rebound afterwards in response to the sudden move lower in the dollar.
Further upside in the dollar weighed on the risk complex and forced the British pound to debilitate further and trade at shouting distance from the key 200-day SMA near 1.1950.
In the UK, BRC Retail Sales Monitor rose 3.9% in the year to December. In addition, house prices tracked by the Halifax Index came in flat on a monthly basis in January and rose 1.9% over the last twelve months.
Further weakness could motivate GBP/USD to dispute the key 200-day SMA at 1.1948. If this region is cleared, then Cable could put the 2023 low at 1.1841 (January 6) to the test ahead of the interim 100-day SMA at 1.1813. On the contrary, the 55-day SMA at 1.2175 should offer temporary resistance prior to the 2023 high at 1.2447 (January 23). The surpass of the latter could open the door to a probable test of the May 2022 top at 1.2666 (May 27) before the key 200-week SMA at 1.2896 and the psychological 1.3000 yardstick. The daily RSI regained downward pace and revisited the 36 area.
Resistance levels: 1.2185 1.2265 1.2302 (4H chart)
Support levels: 1.1960 1.1841 1.1778 (4H chart)
AUDUSD
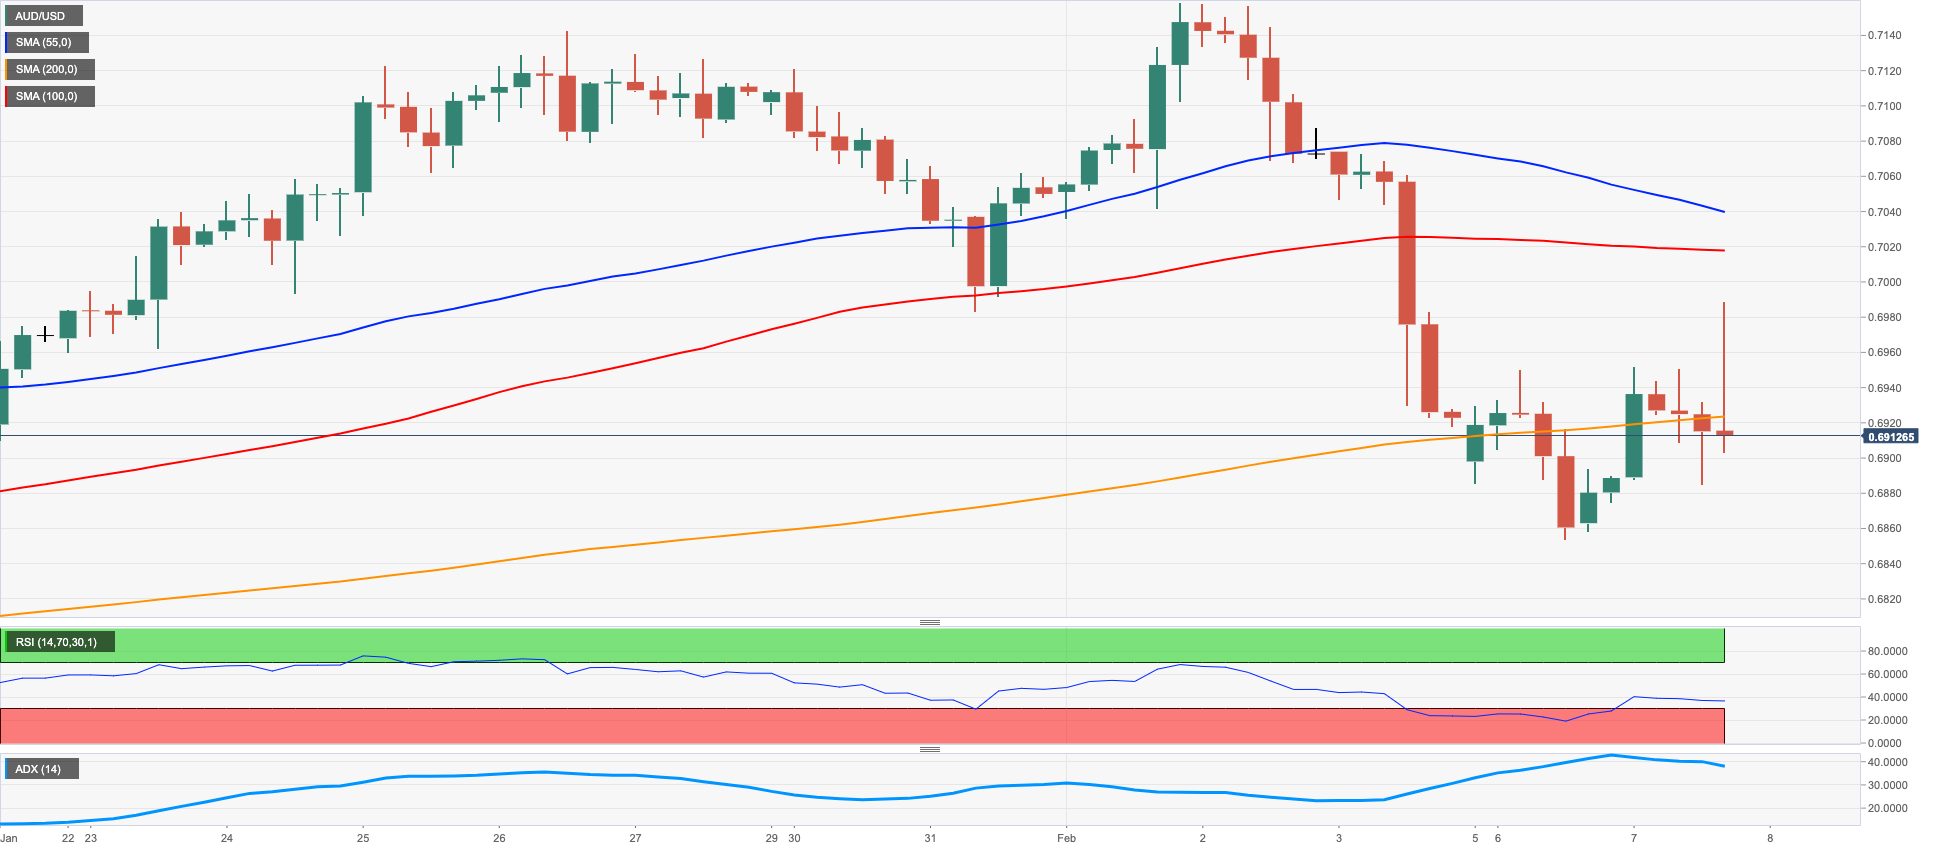
AUD/USD rose to 2-day highs near the key 0.7000 barrier despite another positive session in the dollar, while the hawkish tone at the RBA meeting has been propping up the bid bias in the Aussie dollar since early on Tuesday.
Indeed, the RBA matched expectations and raised the OCR to 3.35%. From the statement, the board saw inflation losing traction on the back of global causes and slower increase in domestic demand. In addition, the RBA stressed that the labour market remains extremely constrained.
Adding to the upbeat mood around the Aussie dollar, RBA Governor P.Lowe sounded hawkish after he suggested that further increases in interest rates will be need over the months ahead to ensure that inflation returns to target, bolstering the view that a pause in the hiking cycle is nowhere to be seen for the time being.
Data wise Down Under, the trade deficit narrowed to A$12.237B in December, with Exports shrinking 1.4% MoM and Imports increasing 1% MoM.
In case sellers regain the upper hand, AUD/USD faces the next support at the 2023 low at 0.6855 (February 6). Once cleared, the pair could then confront the key 200-day SMA at 0.6807 prior to the January low at 0.6688 (January 3) and December 2022 low at 0.6629 (December 20). Just the opposite, the round level at 0.7000 appears as the immediate up barrier ahead of the 2023 top at 0.7157 (February 2). North from here comes the round level at 0.7200 before the June 2022 top at 0.7282 (June 3). The daily RSI bounced to the vicinity of 47.
Resistance levels: 0.6987 0.7047 0.7157 (4H chart)
Support levels: 0.6855 0.6722 0.6688 (4H chart)
GOLD
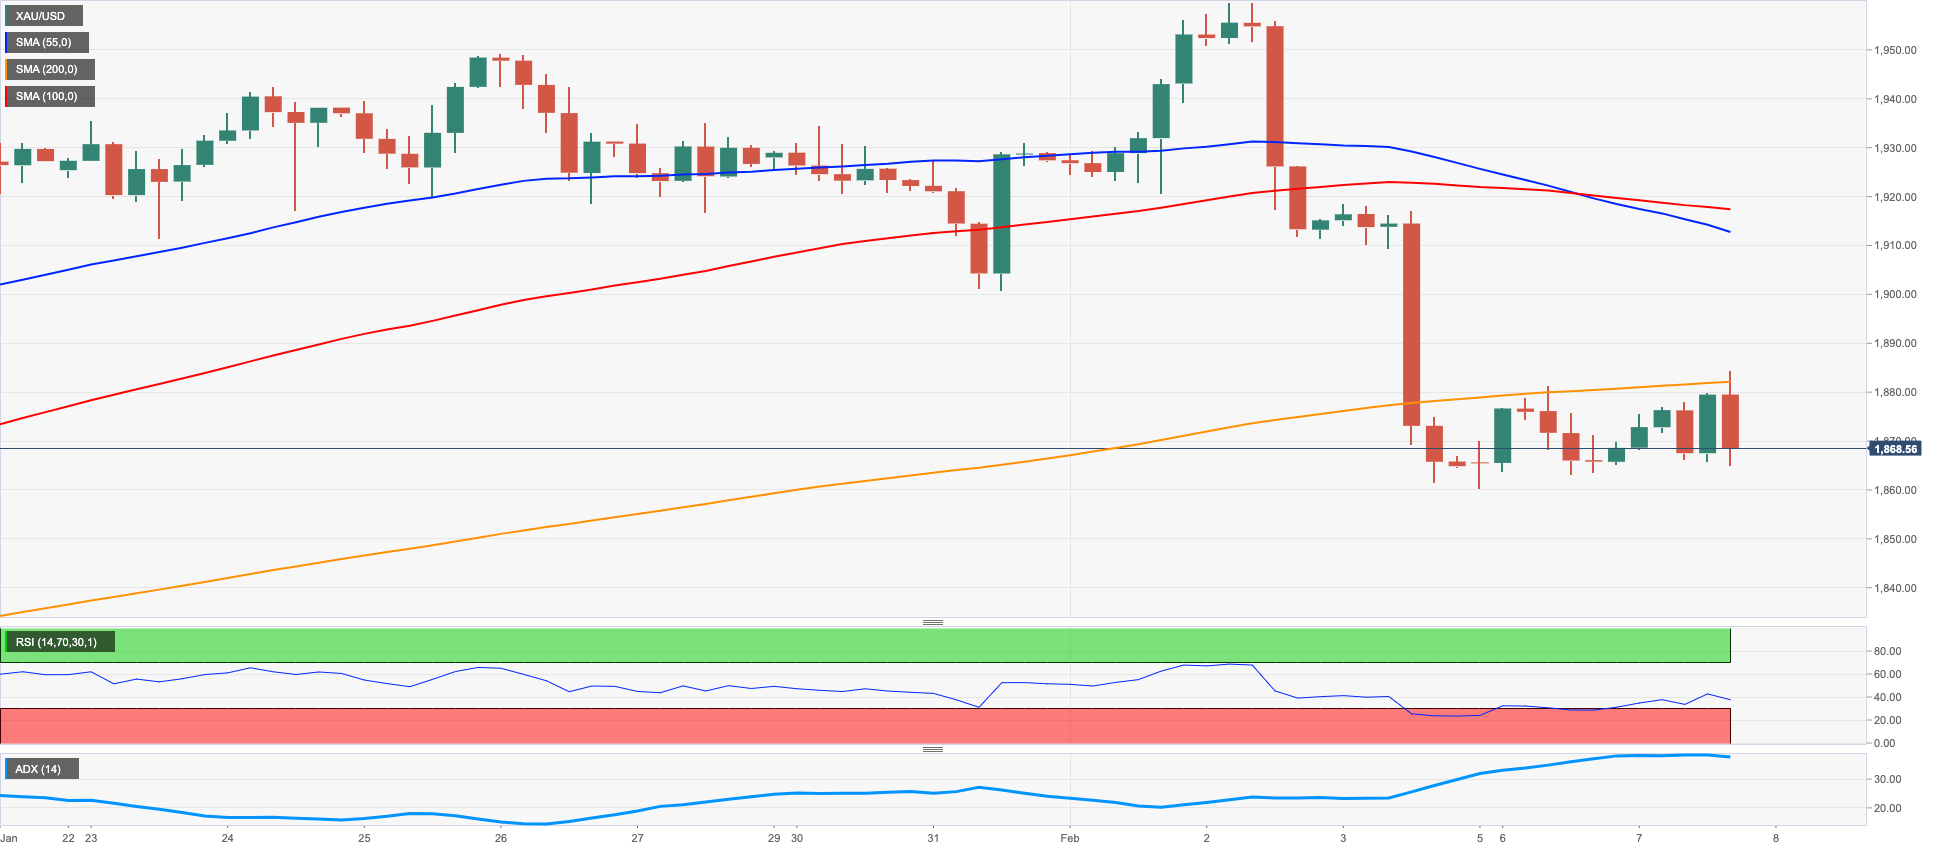
Prices of the ounce troy of the yellow metal added to the positive start of the week and climbed past the $1880 level on Tuesday. So far, gold appears to have met quite a decent contention area around the $1860 region.
The daily uptick in the precious metal came amidst some loss of momentum in the recent recovery in the greenback and the mixed activity in US yields across the curve.
Further upside in bullion appears to have come after Chief Powell left no room for surprises at his interview at the Economic Club of Washington earlier in the session.
In case the rebound in gold picks up a more serious pace, the commodity should not face any relevant hurdle until the 2023 peak at $1959 (February 2). The breakout of this level could put a test of the April 2022 high at $1998 (April 18) back on the traders’ radar ahead of the psychological $2000 mark and the 2022 top at $2070 (March 8). On the other hand, there is an initial contention zone at the February low at $1861 (February 3). South from here aligns the 55-day SMA at $1839 ahead of the key $1800 region and the 200-day SMA at $1776. The loss of the latter could prompt the commodity to visit the 100-day SMA at $1767 ahead of the weekly low at $1727 (November 23).
Resistance levels: $1884 $1916 $1959 (4H chart)
Support levels: $1861 $1825 $1797 (4H chart)
CRUDE WTI
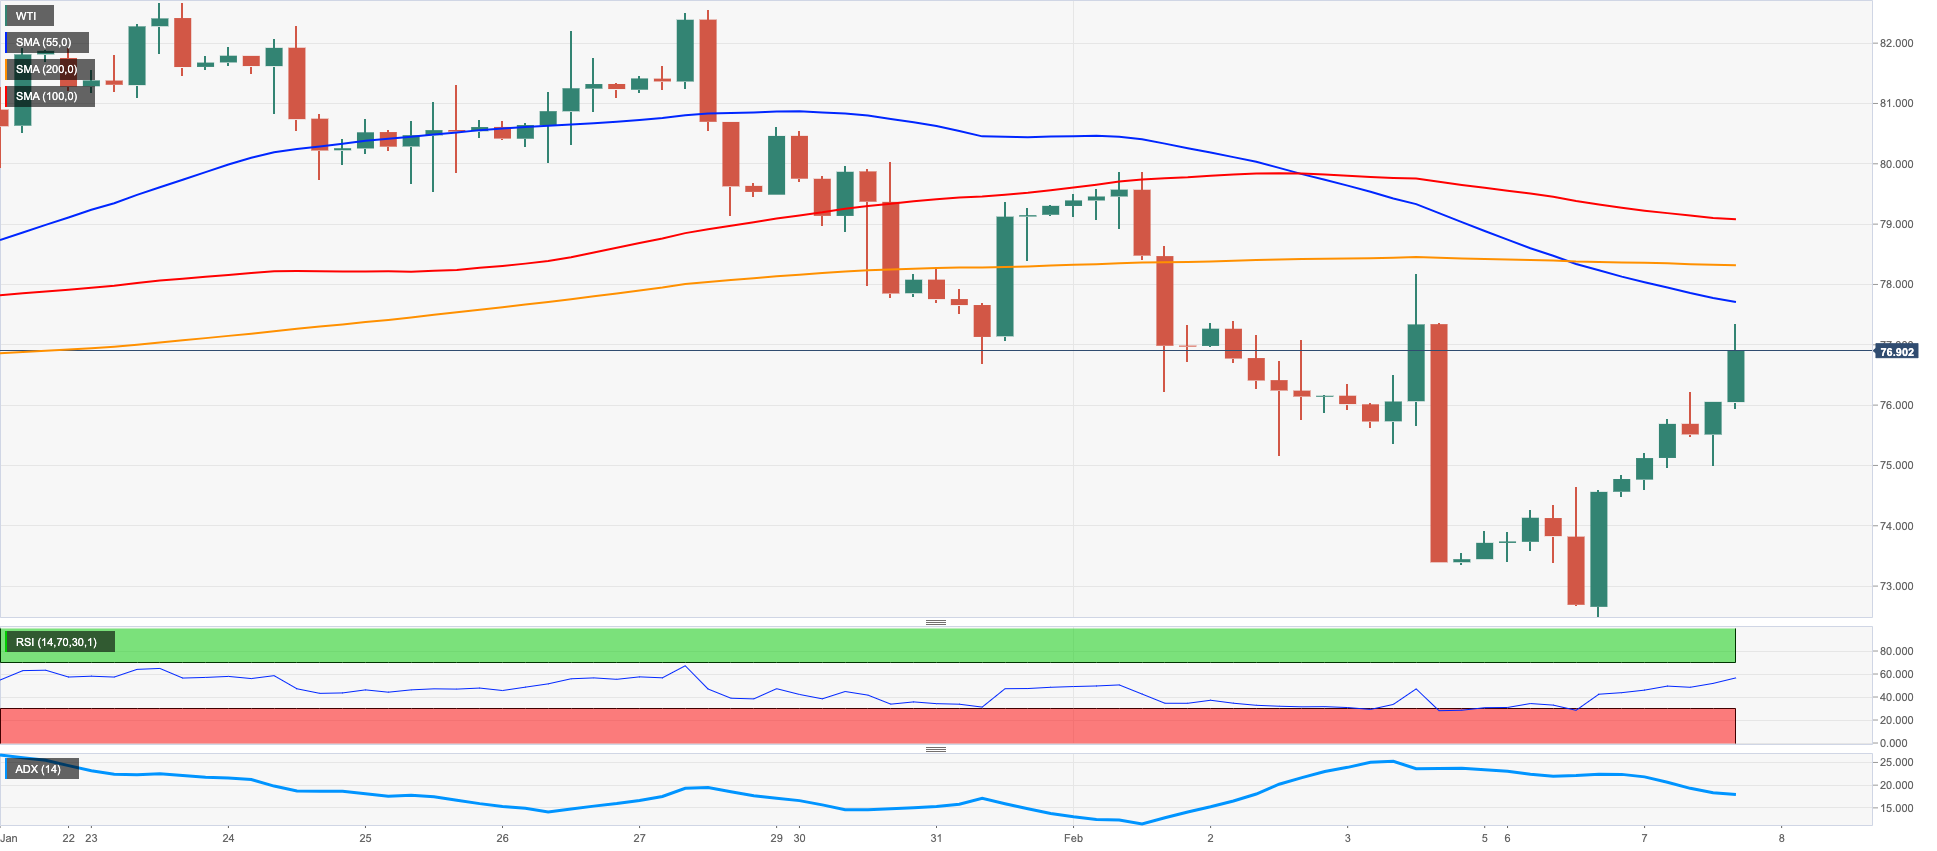
Prices of the barrel of the WTI added to the auspicious start of the week and climbed to 2-day highs just above the $77.00 mark on Tuesday.
The upbeat mood among traders was underpinned by rising hopes that the Chinese reopening could boost the demand for the commodity, while recent news citing that Saudi Arabia increased its prices to Asian buyers also added to the daily gains.
Additionally, the recent earthquake in Türkiye has reignited supply concerns after the Ceyhan terminal halted its normal activity.
Later in the NA session, the API will report on the US crude oil inventories in the week to February 3.
Next on the upside for the WTI comes the provisional 55- and 100-day SMAs at $77.45 and $81.19, respectively, ahead of the 2023 top at $82.60 (January 23). Once cleared, the commodity could then dispute the December 2022 peak at $83.32 (December 1) before the $90.08 level (November 11 2022) and the 200-day SMA at $91.37. By contrast, sellers keep targeting the 2023 low at $72.30 (February 6) prior to the 2022 low at $70.10 (December 9) and the key round level at $70.00. Down from here emerges the weekly low at $66.15 (December 20 2021).
Resistance levels: $77.11 $78.09 $79.68 (4H chart)
Support levels: $72.22 $70.07 $66.11 (4H chart)
GER40
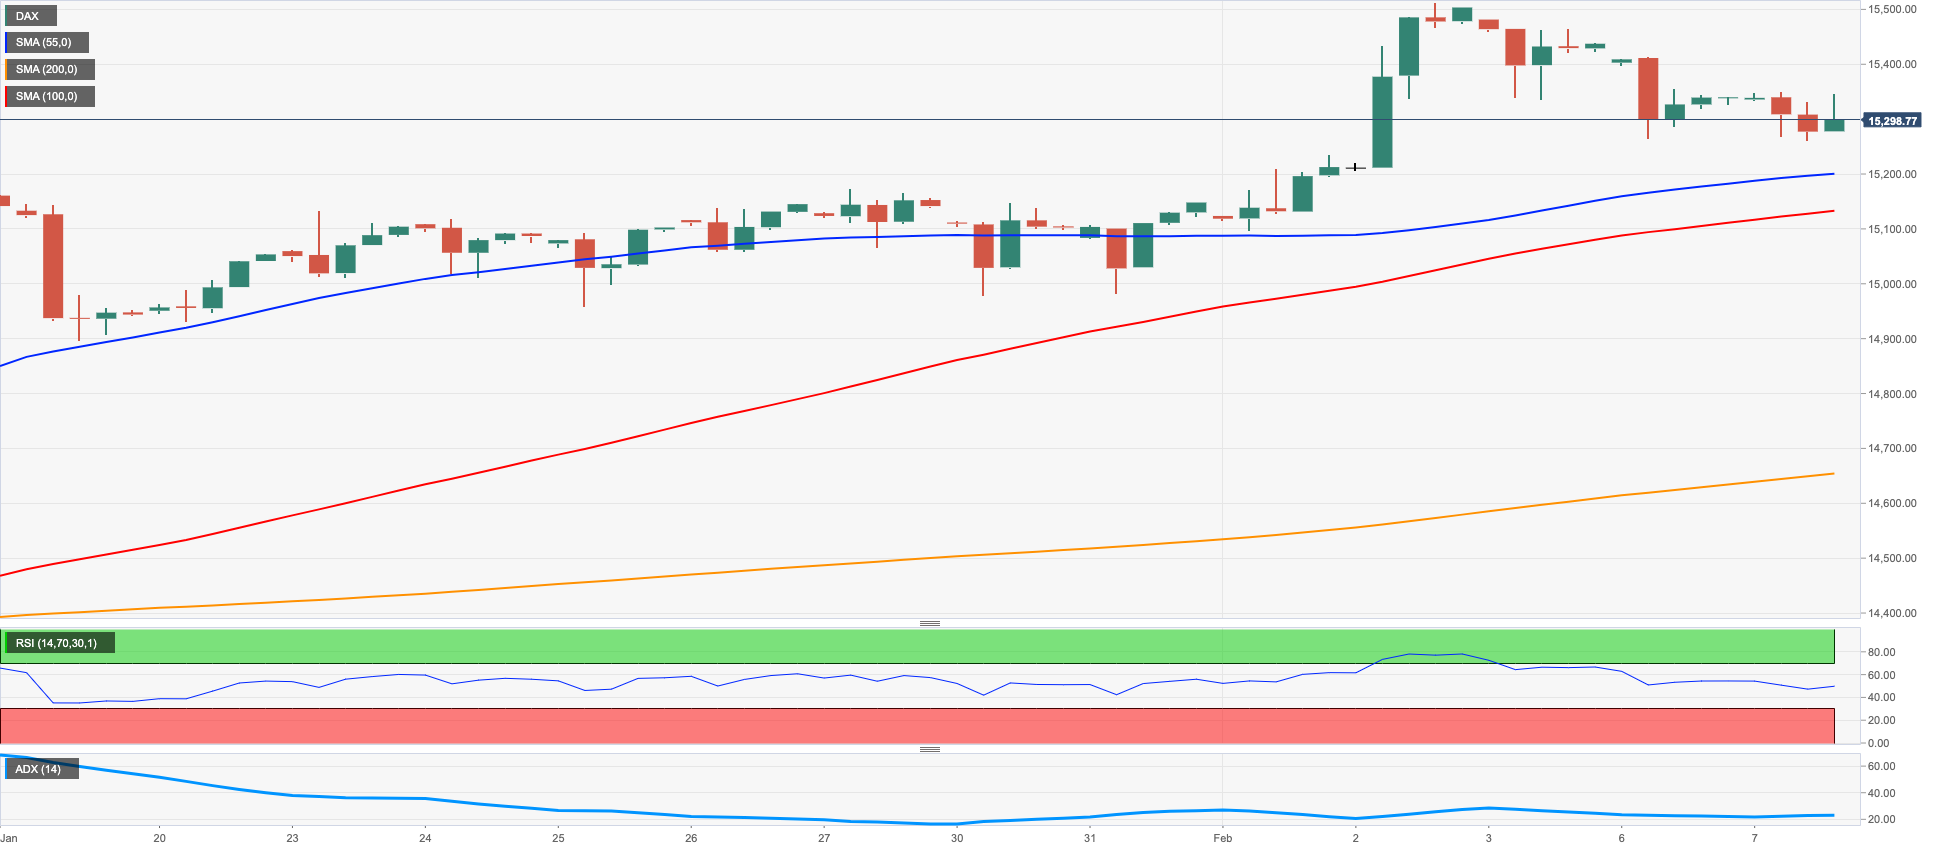
German equities added to the corrective decline and retreated for the third session in a row on Tuesday, this time testing the vicinity of the 15200 region when measured by the DAX40.
In fact, the risk-off mood prevailed in most of the European indices on Tuesday ahead of another appearance by Chief Powell, while fears of an economic slowdown in the region spooked buyers following poor prints from the German docket.
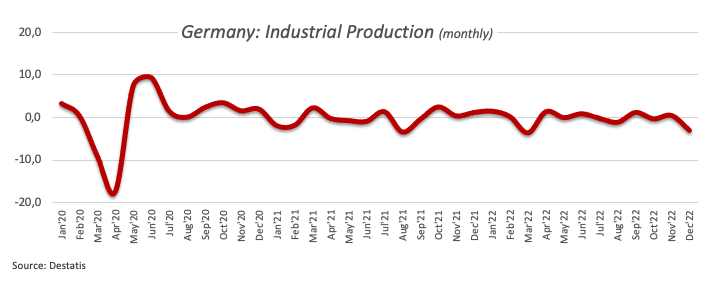
On the above, Industrial Production in Germany contracted at a monthly 3.1% in December, more than initially estimated.
Further out, the German 10-year Bund yields advanced further and printed new 5-week tops near 2.40%, up for the third straight session.
A deeper drop in the DAX40 exposes a probable test of the weekly low at 14906 (January 19) prior to the temporary 55-day SMA at 14602 and the December 2022 low at 13791 (December 20). The breach of this level could prompt a test of the key 200-day SMA at 13660 to emerge on the horizon ahead of the November 2022 low at 13022 (November 3). In the opposite direction, the 2023 high at 15520 (February 2) appears as the next hurdle for bulls before the February 2022 top at 15736 (February 2 2022) and the round level at 16000. Further up aligns the 2022 peak at 16285 (January 5). The daily RSI receded to the 63 neighbourhood.
Best Performers: Continental AG, Linde PLC, Deutsche Bank AG
Worst Performers: Airbus Group, Siemens Energy AG, Vonovia
Resistance levels: 15520 15614 15736 (4H chart)
Support levels: 15223 15154 14906 (4H chart)
NASDAQ
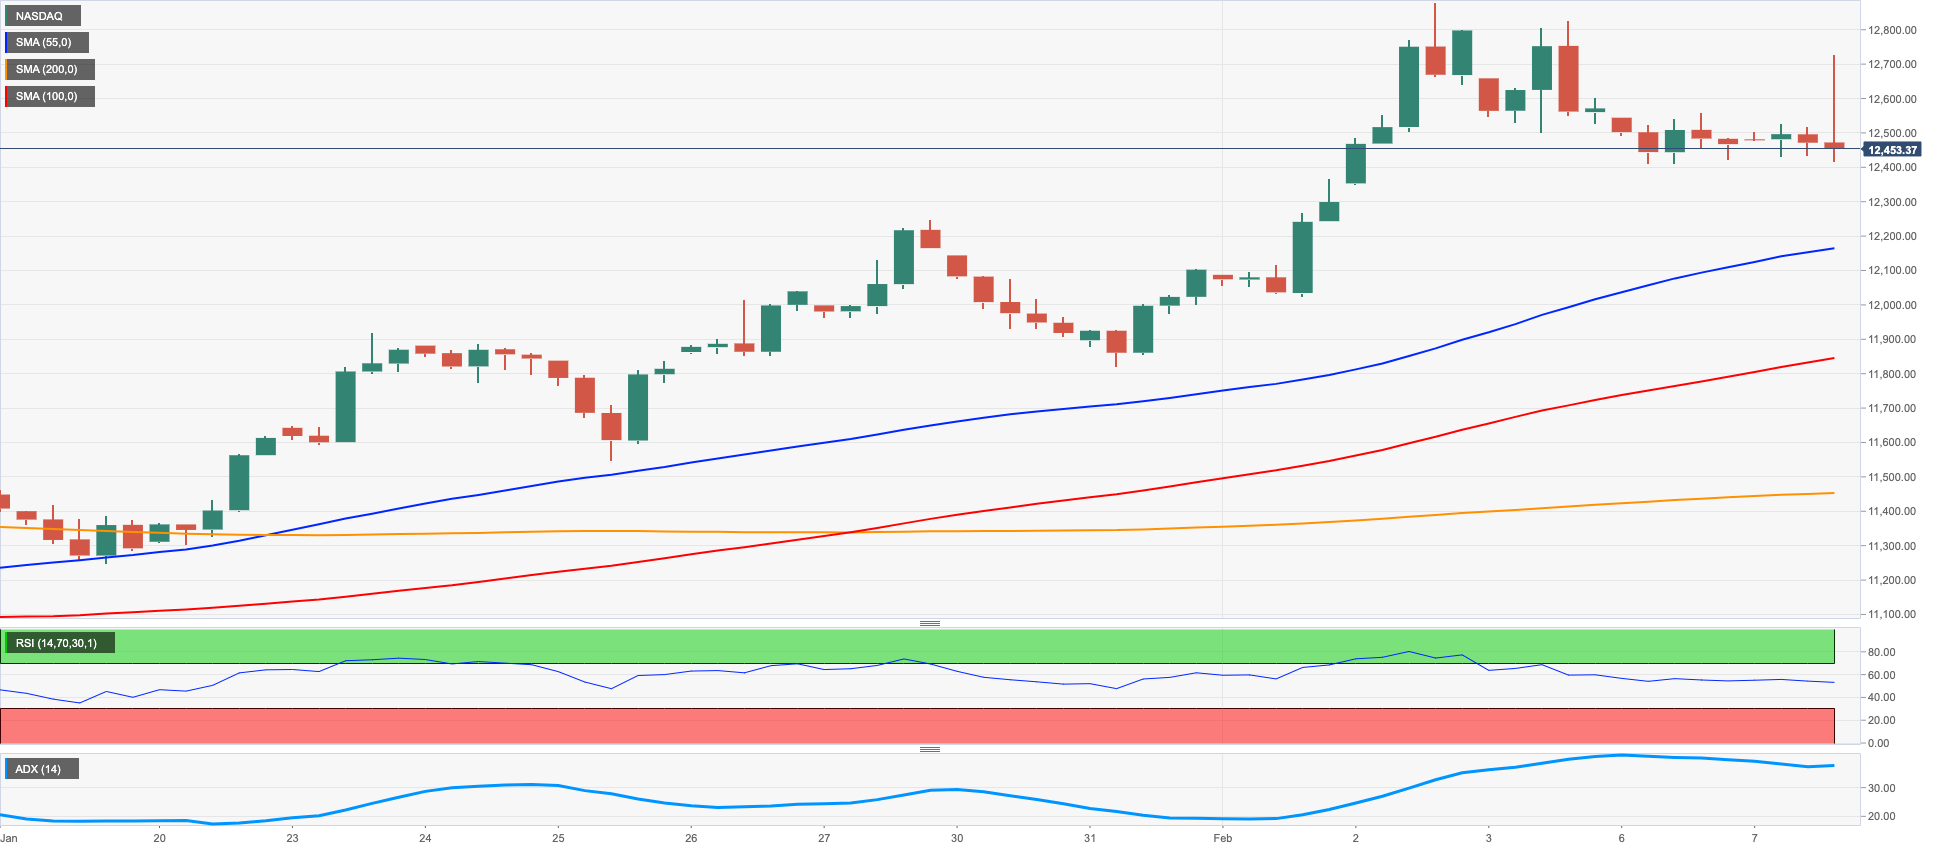
The Nasdaq 100 alternated gains with losses around the 12500 mark amidst the mixed performance in the US stock markets.
In fact, the firm session in software giant Microsoft helped the index to remain afloat amidst daily pullbacks in the Dow Jones and the S&P500.
Furthermore, the recovery in the greenback and further gains in yields in the belly and the long end of the curve also limited the upside in the index on Tuesday.
If the selling pressure intensifies, then the Nasdaq 100 could revisit the key 200-day SMA at 11946 ahead of weekly lows at 11550 (January 25) and 11251 (January 19). Further losses should put the January low at 10696 (January 6) to the test prior to the December 2022 low at 10671 (December 22) and the November 2022 low at 10632 (November 4). Having said that, the immediate up barrier remains at the 2023 peak at 12880 (February 2) seconded by the round level at 13000 and ahead of the weekly high at 13175 (August 26 2022). The daily RSI advanced past the 65 yardstick.
Top Gainers: Fiserv, Zoom Video, Activision Blizzard
Top Losers: Lucid Group, Rivian Automotive, Amazon.com
Resistance levels: 12880 13175 13720 (4H chart)
Support levels: 11928 11550 11450 (4H chart)
DOW JONES
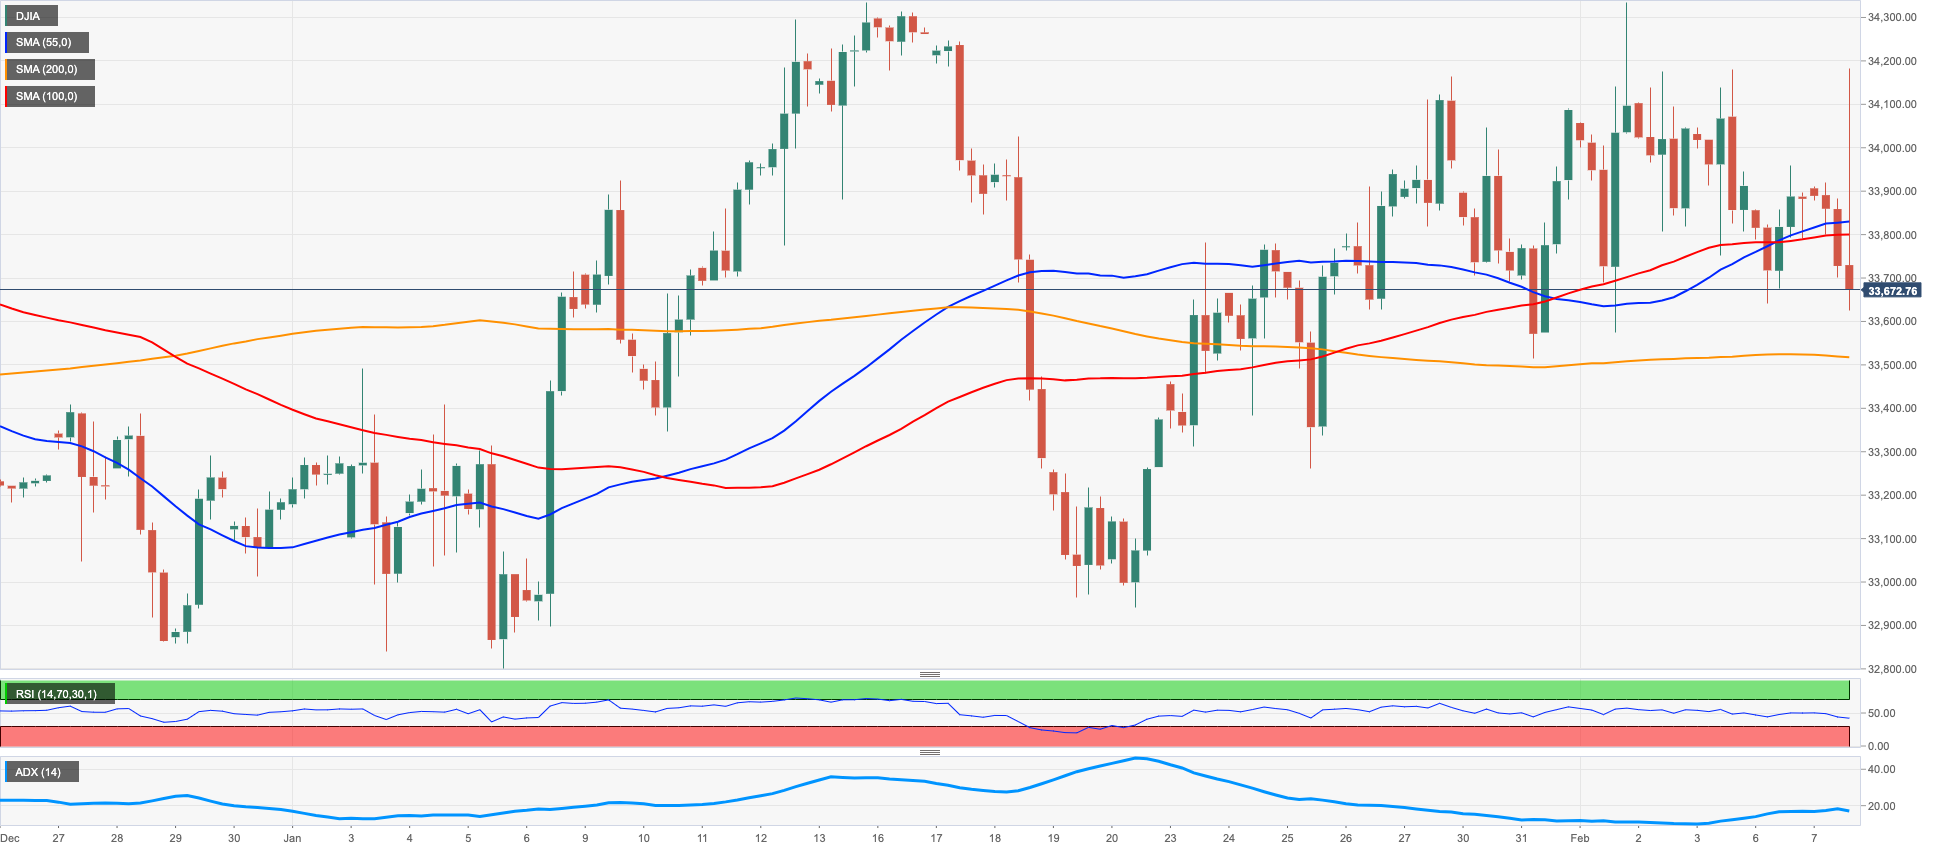
Equities tracked by the Dow Jones could not sustain an early move to the area above the 34000 mark and quickly returned to the negative territory on Tuesday, adding to the ongoing multi-day bearish move.
The index initially gathered upside traction in response to the lack of surprises from Chair Powell at his participation in the Economic Club of Washington, although that uptick quickly died off as the perception that the Fed will maintain its restrictive policy for longer kept gathering pace.
Overall, the Dow Jones deflated 0.62% to 33678, the S&P500 dropped 0.39% to 4094 and the tech-heavy Nasdaq Composite gained 0.91% to 11996.
If the selling pressure gathers extra pace, the Dow Jones could extend the decline to the weekly low at 32948 (January 20) before the December 2022 low at 32573 (December 22) and the key 200-day SMA at 32324. On the flip side, the breakout of the weekly peak at 34334 (February 1) exposes a move to the 2023 high at 34342 (January 13) ahead of the December 2022 top at 34712 (December 13). Beyond the latter, the index could revisit the April 2022 peak at 35492 followed by the February 2022 high at 35824 (February 9). The daily RSI lost the grip and approached the 51 level.
Top Performers: Microsoft, Boeing, Chevron
Worst Performers: Verizon, Home Depot, Caterpillar
Resistance levels: 34334 34712 35492 (4H chart)
Support levels: 33581 33273 32948 (4H chart)
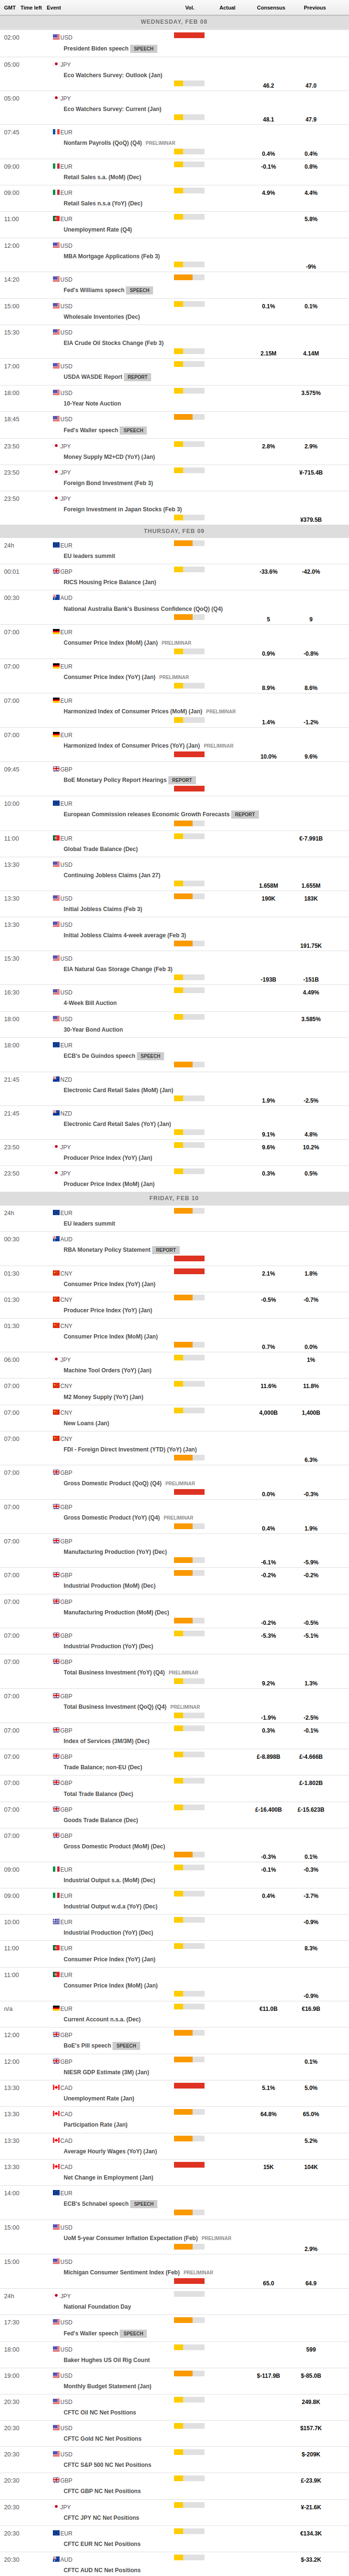
MACROECONOMIC EVENTS
All Information & Updates provided by:

All information relating to the financial markets available on this page has been prepared and issued by FXStreet (Forexstreet SL, Spain, Reg: B62498233) on the basis of publicly available information and all information believed to be reliable and does not conflict with Kuwaiti local laws, and all necessary care has been taken to before the company to ensure that the facts mentioned are correct from the source.
NCM Investment nor any of its directors or employees shall in any way be held responsible for the contents of this news, and the information contained on this page is intended only to provide clients with publicly available information and should not be construed as investment advice, report or analysis and/or constitute an offer or invitation to buy or sell financial instruments of any kind.
RISK WARNING: Forex and CFDs are highly risky leveraged products, as losses can exceed deposits. Please ensure you understand all the risks and take independent advice if necessary. NCM will segregate the clients based on the criteria of the regulator and its bylaws. NCM does not provide any advisory service; the material published does not constitute advice or a recommendation for a transaction in any financial instrument. NCM accepts no responsibility for any use of the content presented and any consequences of that use. Anyone acting on the information provided does so at their own risk.