
- Contact Us:
-

-

-

-


Daily Market Updates
09 Feb 2023
USDJPY
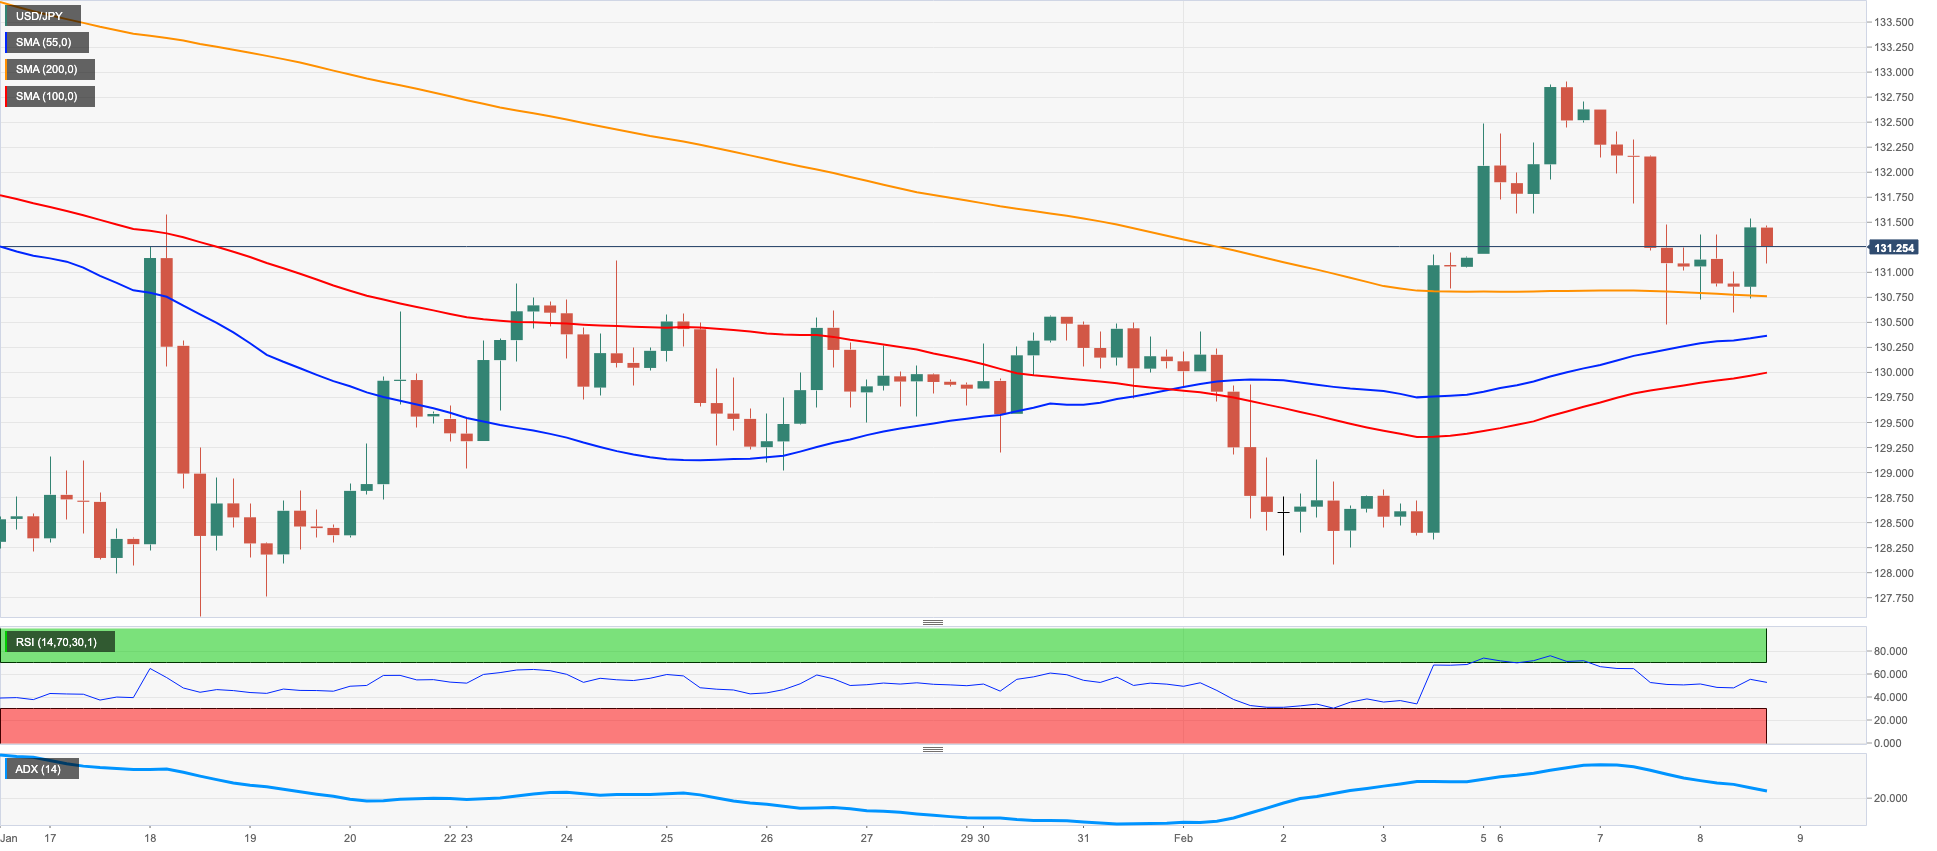
USD/JPY partially reversed Tuesday’s decline and advanced modestly after initially flirting with 3-day lows near 130.60 on Wednesday.
While USD/JPY continued to fade the post-Payrolls strong rebound, the pair nonetheless managed to offset the selling pressure in the greenback and the humble decline in US yields. The JGB 10-year yields, in the meantime, kept the range bound theme around the 0.50% zone.
Meanwhile in Japan, Bank Lending expanded at an annualized 3.1% in January. Additionally, the Eco Watchers Survey Current eased a tad to 48.5 and the Eco Watchers Survey Outlook improved to 49.3, both readings for the current month.
In case bears push harder, USD/JPY could come all the way down and revisit the February low at 128.08 (February 2) ahead of the 2023 low at 127.21 (January 16). The loss of the latter could put the May 2022 low at 126.36 (May 24) back on the investors’ radar prior to the weekly low at 121.27 (March 31 2022). On the contrary, the February peak at 132.90 (February 6) emerges as the immediate resistance seconded by the 2023 high at 134.77 (January 6) and key 200-day SMA at 136.79. Once this region is cleared, the pair could challenge weekly tops at 138.17 (December 15 2022) and 139.89 (November 30 2022) before the key round level at 140.00. The daily RSI picked up impulse and left behind the 51 yardstick.
Resistance levels: 132.90 134.77 137.47 (4H chart)
Support levels: 130.46 129.86 128.08 (4H chart)
GBPUSD
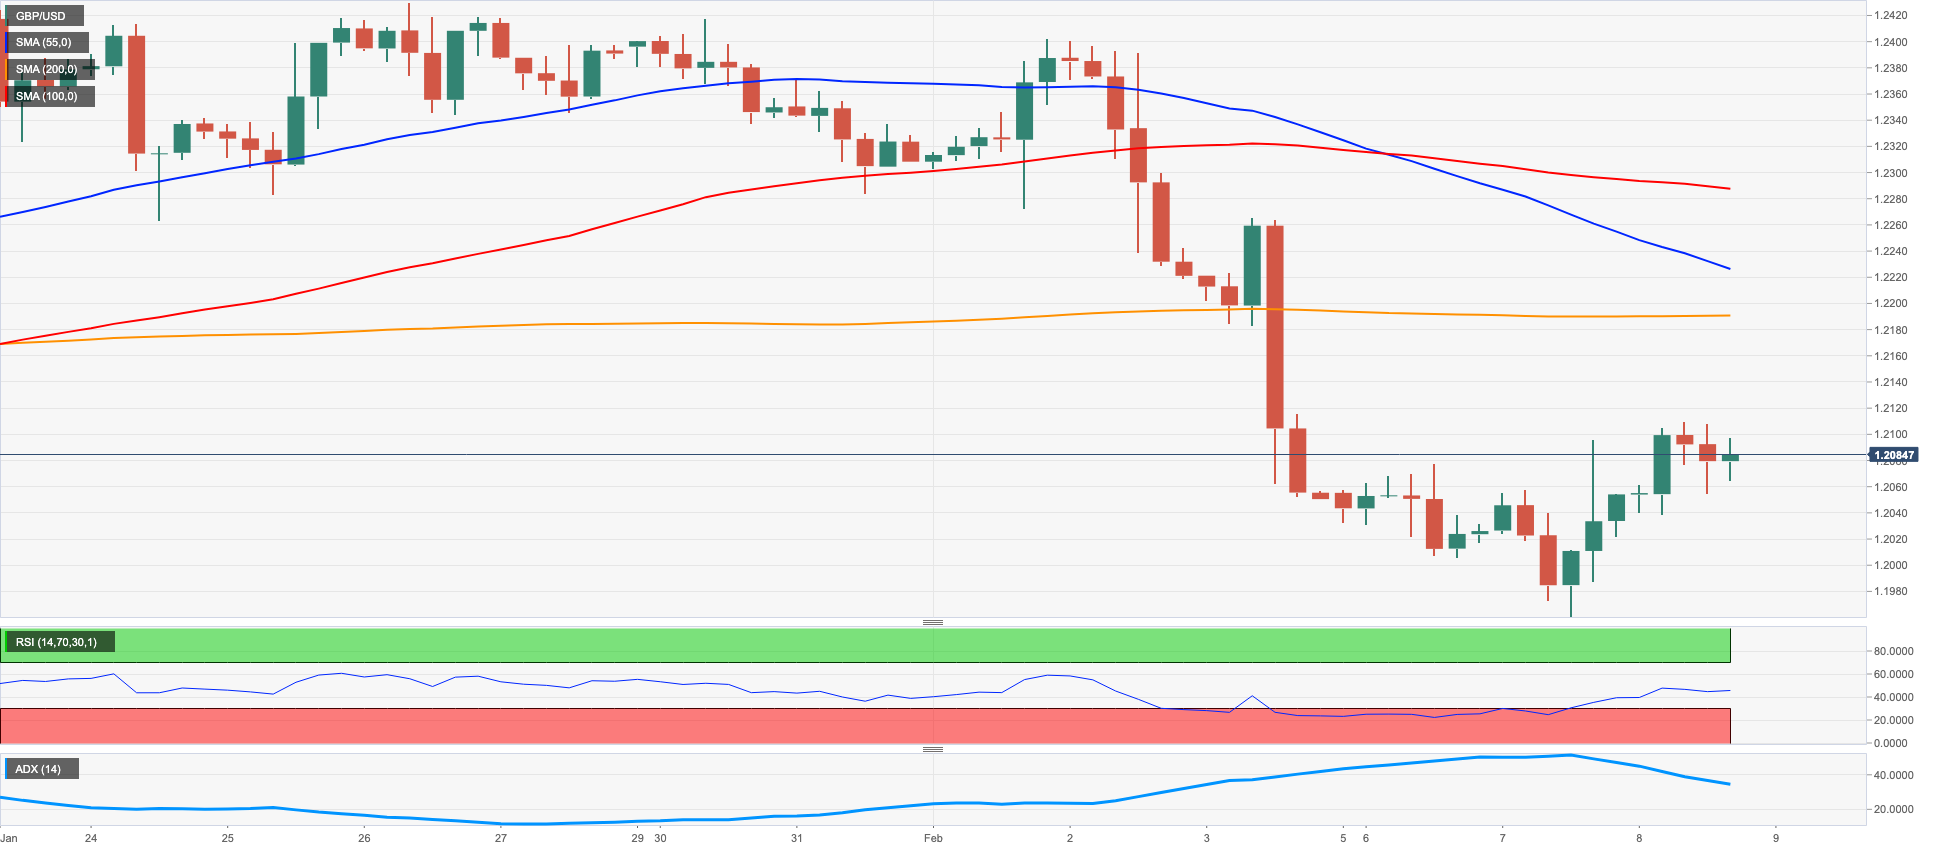
In line with its risk-linked peers, the Sterling gathered further strength and sponsored the second consecutive session with gains in GBP/USD, this time pushing the pair back above the key 1.2000 the figure midweek.
Indeed, Cable added to Tuesday’s advance and regained the area beyond the 1.2000 mark amidst a decent improvement in the appetite for riskier assets, while the 10-year Gilt yields kept hovering around so far monthly peaks past 3.30%.
The next releases of note in the UK docket will be the GDP figures, Industrial Production, Balance of Trade and Construction Output, all due on Friday.
Extra gains in GBP/USD now target the temporary 55-day SMA at 1.2177. Further up, there are no relevant hurdles of note until the 2023 top at 1.2447 (January 23) prior to the May 2022 peak at 1.2666 (May 27) and the key 200-week SMA at 1.2896, all just before the psychological 1.3000 mark. The other way around, there is initial contention at the February low at 1.1960 (February 7). This area appears reinforced by the key 200-day SMA at 1.1945 and comes ahead of the 2023 low at 1.1841 (January 6) and the provisional 100-day SMA at 1.1822. The daily RSI gathered steam and broke above 42.
Resistance levels: 1.2109 1.2184 1.2265 (4H chart)
Support levels: 1.1960 1.1841 1.1778 (4H chart)
AUDUSD
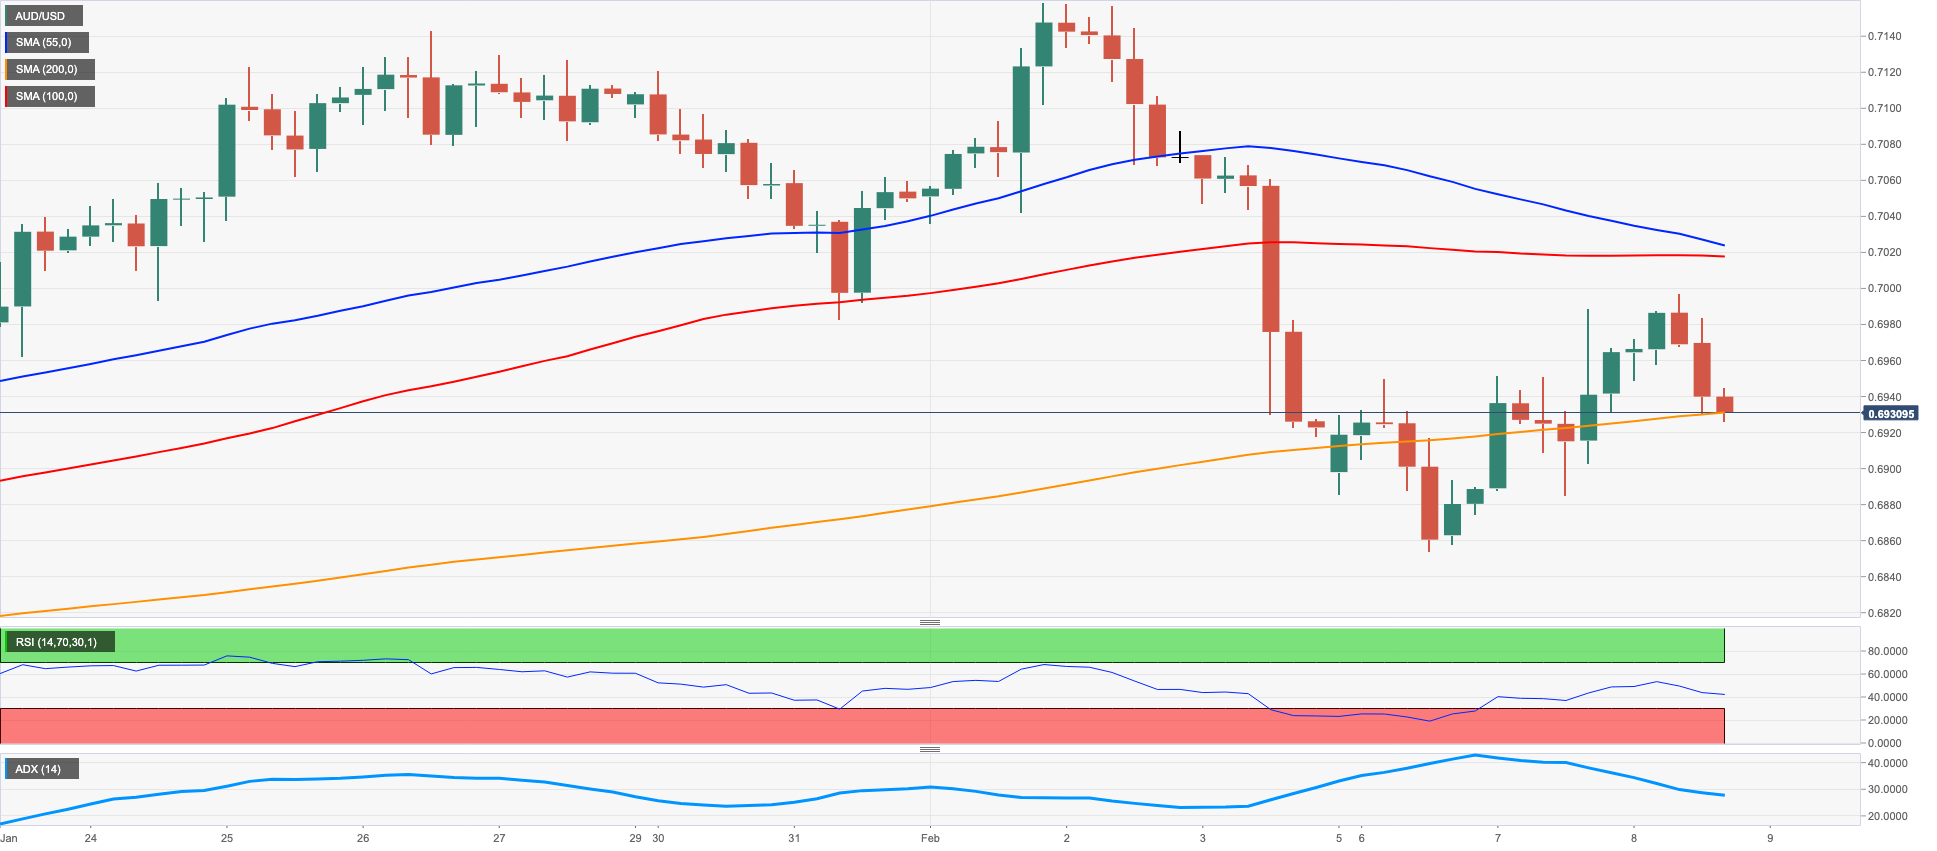
AUD/USD faded the earlier bull run to levels just short of the key 0.7000 barrier on Wednesday, coming under downside pressure afterwards and revisiting the 0.6930/20 band towards the end of the NA session.
Indeed, the pair gave away part of Tuesday’s strong recovery despite the price action around the US dollar remaining inconclusive and investors continued to adjust to the hawkish hike by the RBA on Tuesday.
In addition, the generalized bearish tone in the commodity complex saw copper prices and the iron ore retreating further, all helping with the daily downtick in the Aussie dollar.
In Oz, the Ai Group Industry Index worsened to -11.6 for the month of January.
The resumption of the uptrend is expected to put AUD/USD en route to another visit to the 2023 top at 0.7157 (February 2) ahead of the round level at 0.7200 and prior to the June 2022 peak at 0.7282 (June 3). For all that, the February low at 0.6855 (February 6) now appears as the initial contention zone before the key 200-day SMA at 0.6805. Once cleared, spot could confront the 2023 low at 0.6688 (January 3) prior to the December 2022 low at 0.6629 (December 20). The daily RSI grinded lower and traded below the 50 mark.
Resistance levels: 0.6996 0.7035 0.7157 (4H chart)
Support levels: 0.6921 0.6855 0.6722 (4H chart)
GOLD
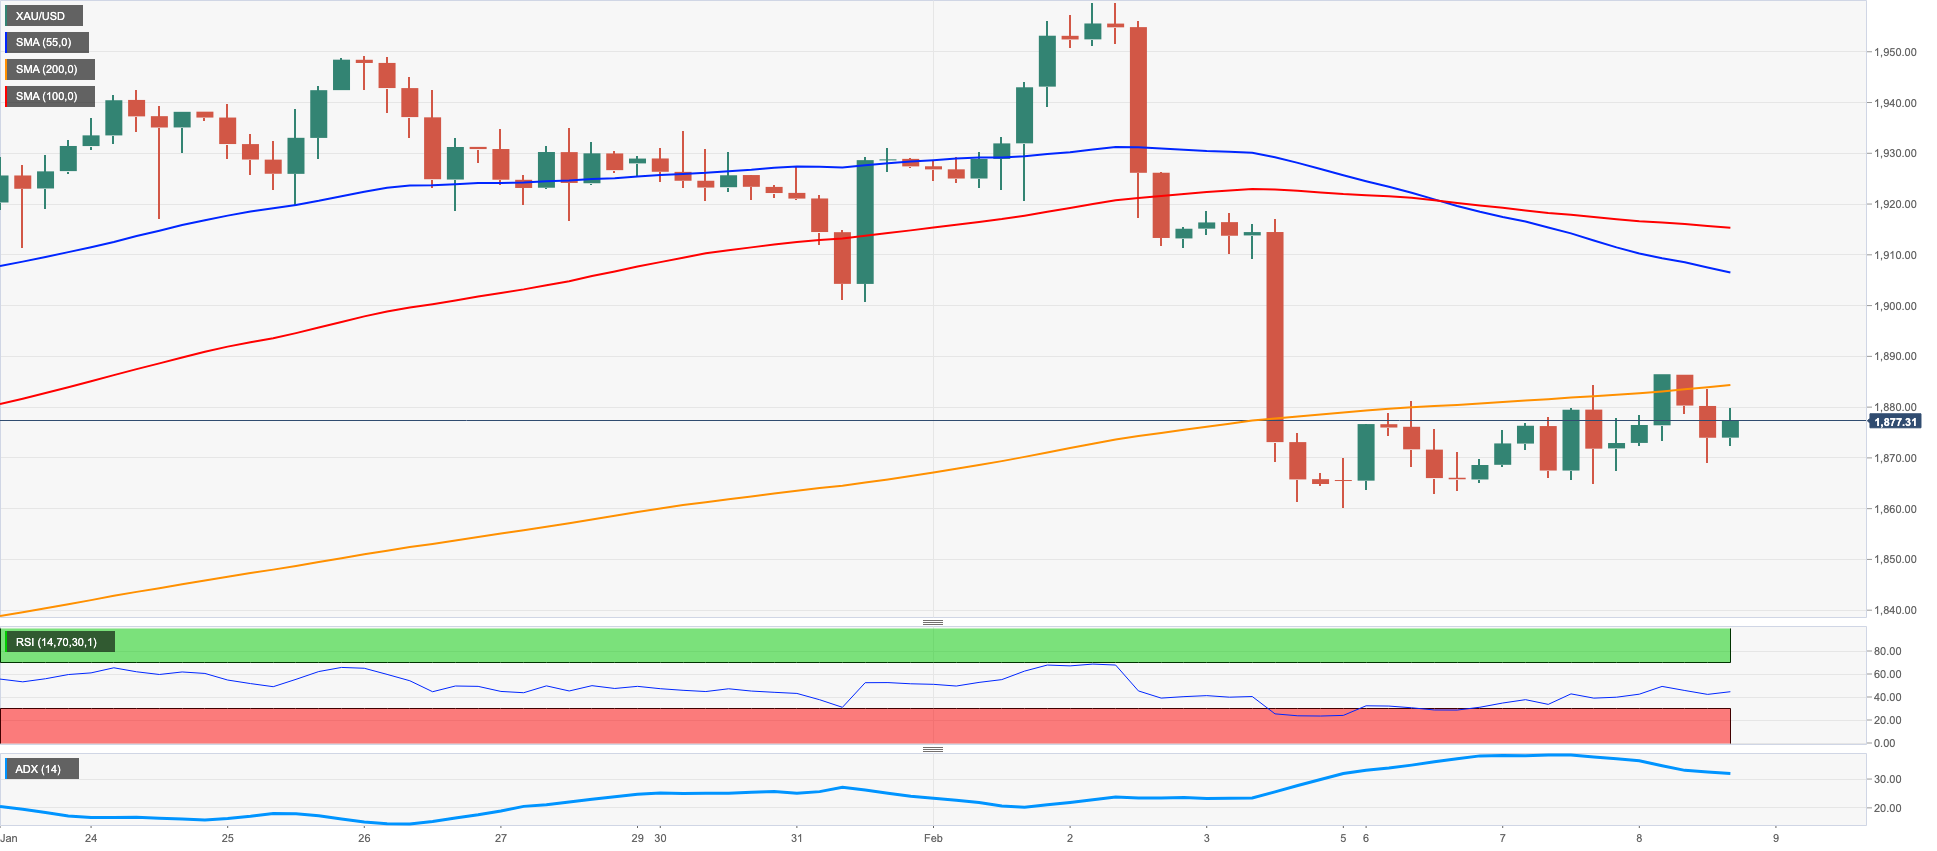
The recovery in prices of the yellow metal remained unchanged for the third session in a row on Wednesday, this time flirting with the $1890 per ounce troy, or 3-day highs.
Another positive performance of the precious metal came on the back of further weakness in the greenback in tandem with the corrective retracement in US yields across the curve, all against the backdrop of the marked progress in the appetite for the risk complex.
Moving forward, bullion is expected to keep tracking the developments around the Fed’s normalization process and the tone from comments by Fed’s policy makers.
Immediately to the upside for gold comes the 2023 high at $1959 (February 2). North from here emerges the April 2022 top at $1998 (April 18) just before the psychological $2000 mark and followed by the 2022 peak at $2070 (March 8). Just the opposite, the February low at $1861 (February 3) is expected to offer decent initial support before the temporary 55-day SMA at $1841 and the key $1800 region. The breakdown of this region could prompt a visit to the 200-day SMA at $1776 to emerge on the horizon ahead of the interim 100-day SMA at $1767 and the weekly low at $1727 (November 23).
Resistance levels: $1886 $1918 $1959 (4H chart)
Support levels: $1861 $1825 $1797 (4H chart)
CRUDE WTI
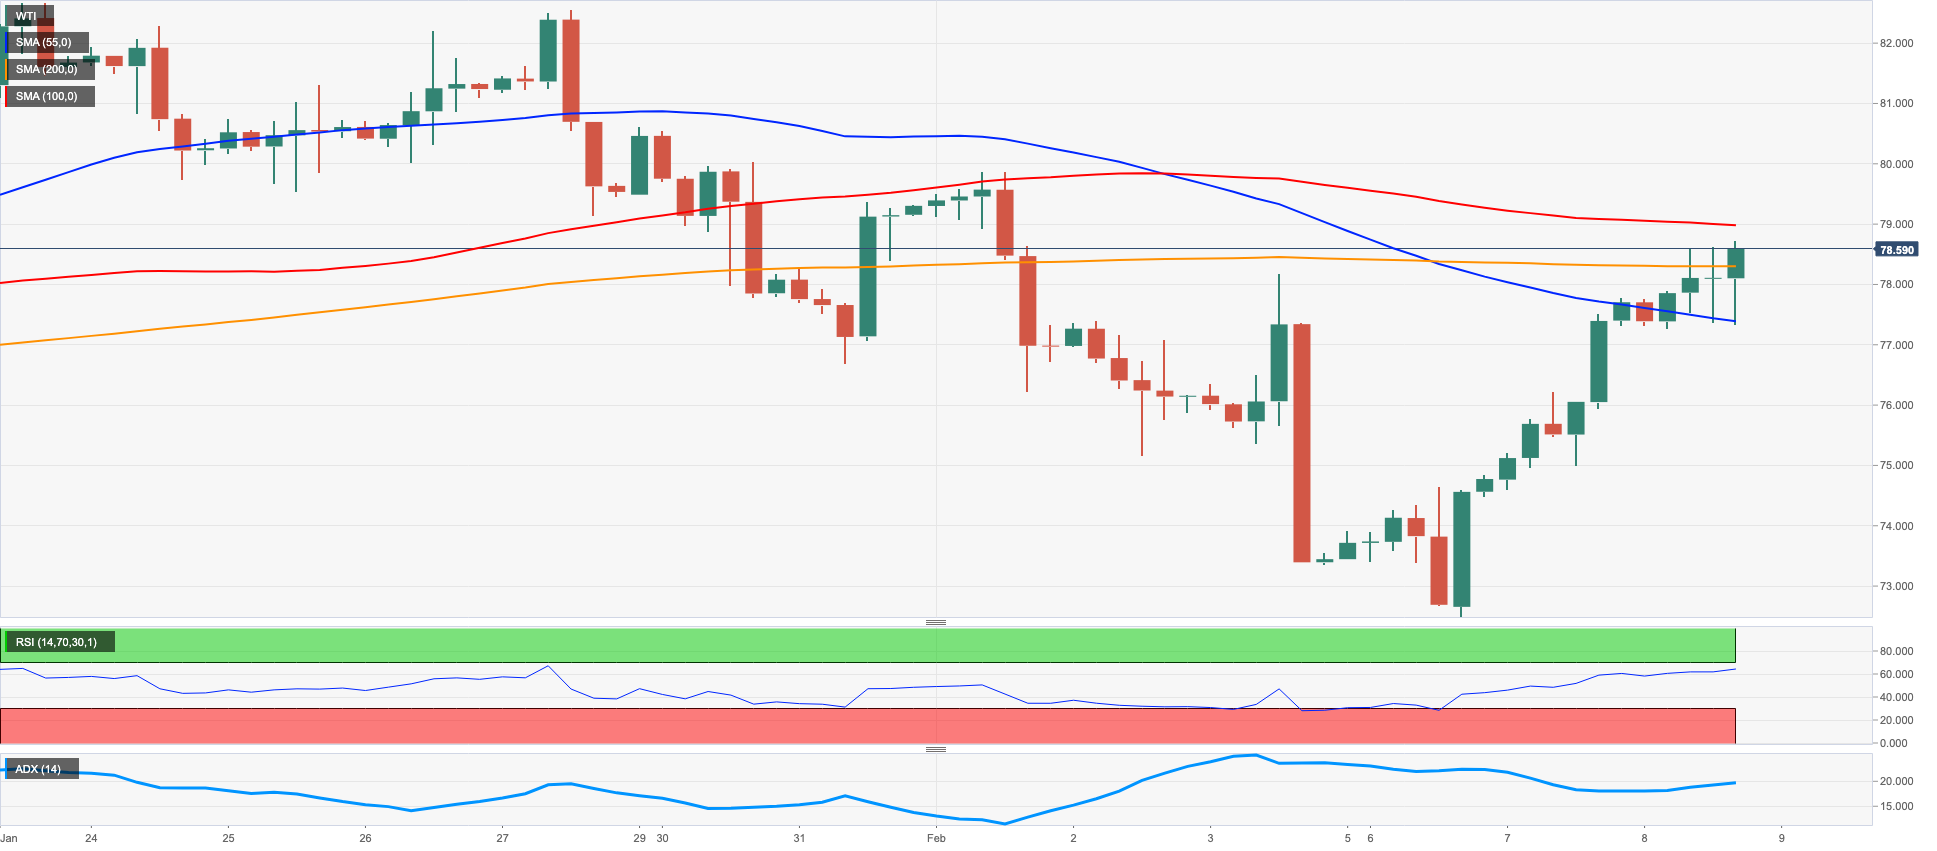
Prices of the American benchmark for the sweet light crude oil added to the weekly rebound and surpassed the $78.00 mark per barrel on Wednesday.
Further improvement in the commodity came on the back of easing concerns around a potential economic slowdown, particularly in response to Chair Powell’s message on Tuesday, which eventually came in less hawkish than expected and in line with the latest post-FOMC press conference.
In addition, disruptions around the Turkish Ceyhan oil terminal remained, albeit partially, sustaining prices from the supply side.
In addition, and according to the EIA’s weekly report, US crude oil inventories increased less than expected by 2.423M barrels in the week to February 3, while supplies at Cushing went up by 1.043M barrels, Distillate Stocks rose by 2.932M barrels and gasoline stockpiles increased sharply by 5.008M barrels.
WTI now faces a minor hurdle at the weekly top at $78.49 (February 8) ahead of the interim 100-day SMA at $81.14 and $ the 2023 peak at $82.60 (January 23). The breakout of the latter could prompt the December 2022 high at $83.32 (December 1) to emerge on the horizon prior to the $90.08 level (November 11 2022) and the 200-day SMA, today at $91.24. In the opposite direction, the 2023 low at $72.30 (February 6) turns up as the big magnet for sellers ahead of the 2022 low at $70.10 (December 9), which is closely followed by the key round level at $70.00 and the weekly low at $66.15 (December 20 2021).
Resistance levels: $78.49 $79.68 $82.44 (4H chart)
Support levels: $74.72 $72.22 $70.07 (4H chart)
GER40
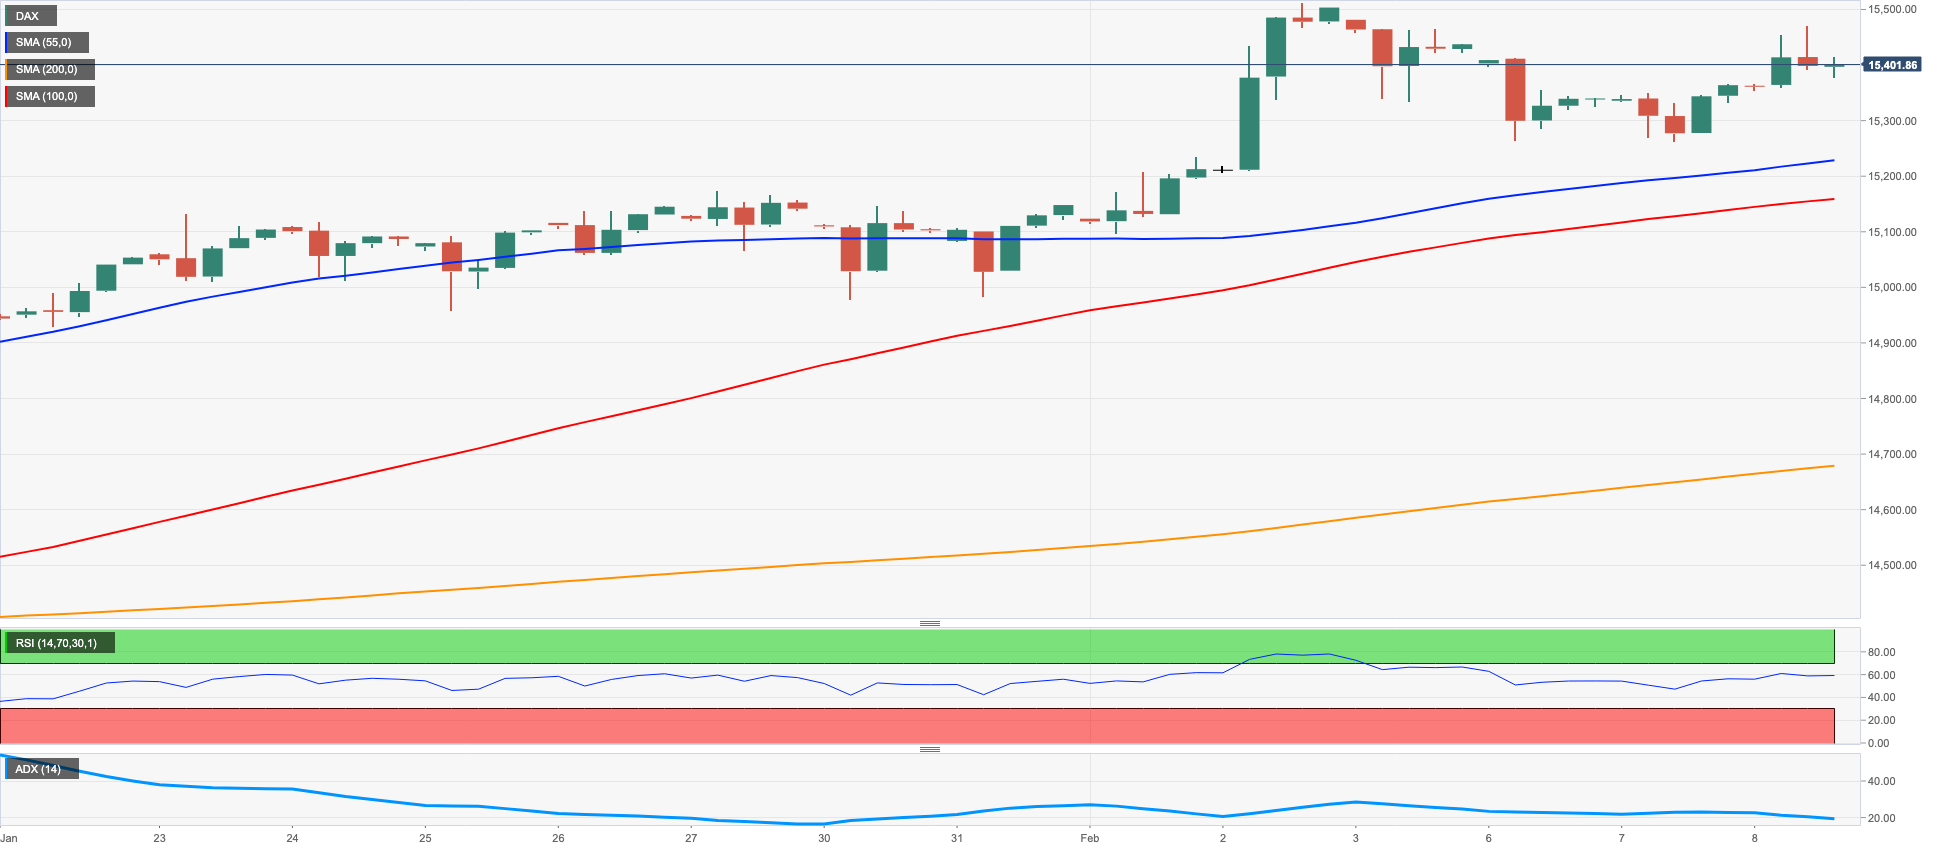
Equities tracked by the German benchmark index DAX40 followed the rest of their European peers and ended the session with decent gains following the strong rebound in US markets on Tuesday.
Indeed, optimism among investors gathered extra pace following a not-so-hawkish message from Chief Powell at his interview on Tuesday, which eventually reinforced the view that the Fed could be closer to pause its hiking cycle.
The index therefore reversed three consecutive daily drops and returned to the 15500 region amidst another positive performance of the German 10-year Bund yields, this time approaching the 2.40% region.
There were no data releases in Germany on Wednesday.
If the upside momentum gathers extra impulse, then the DAX40 could dispute the 2023 top at 15520 (February 2) ahead of the February 2022 top at 15736 (February 2 2022). The surpass of this level could put a visit to the round level at 16000 back on the investors’ radar prior to the 2022 high at 16285 (January 5). On the flip side, the next support of importance is seen at the weekly low at 14906 (January 19) ahead of the interim 55-day SMA at 14621 and the December 2022 low at 13791 (December 20). A drop below the latter exposes the key 200-day SMA at 13667 seconded by the November 2022 low at 13022 (November 3). The daily RSI leapt to the boundaries of the 68 area.
Best Performers: Bayer, Linde PLC, Fresenius Medical Care KGAA ST
Worst Performers: Sartorius AG VZO, Zalando SE, Heidelbergcement
Resistance levels: 15486 15520 15614 (4H chart)
Support levels: 15273 15177 14906 (4H chart)
NASDAQ
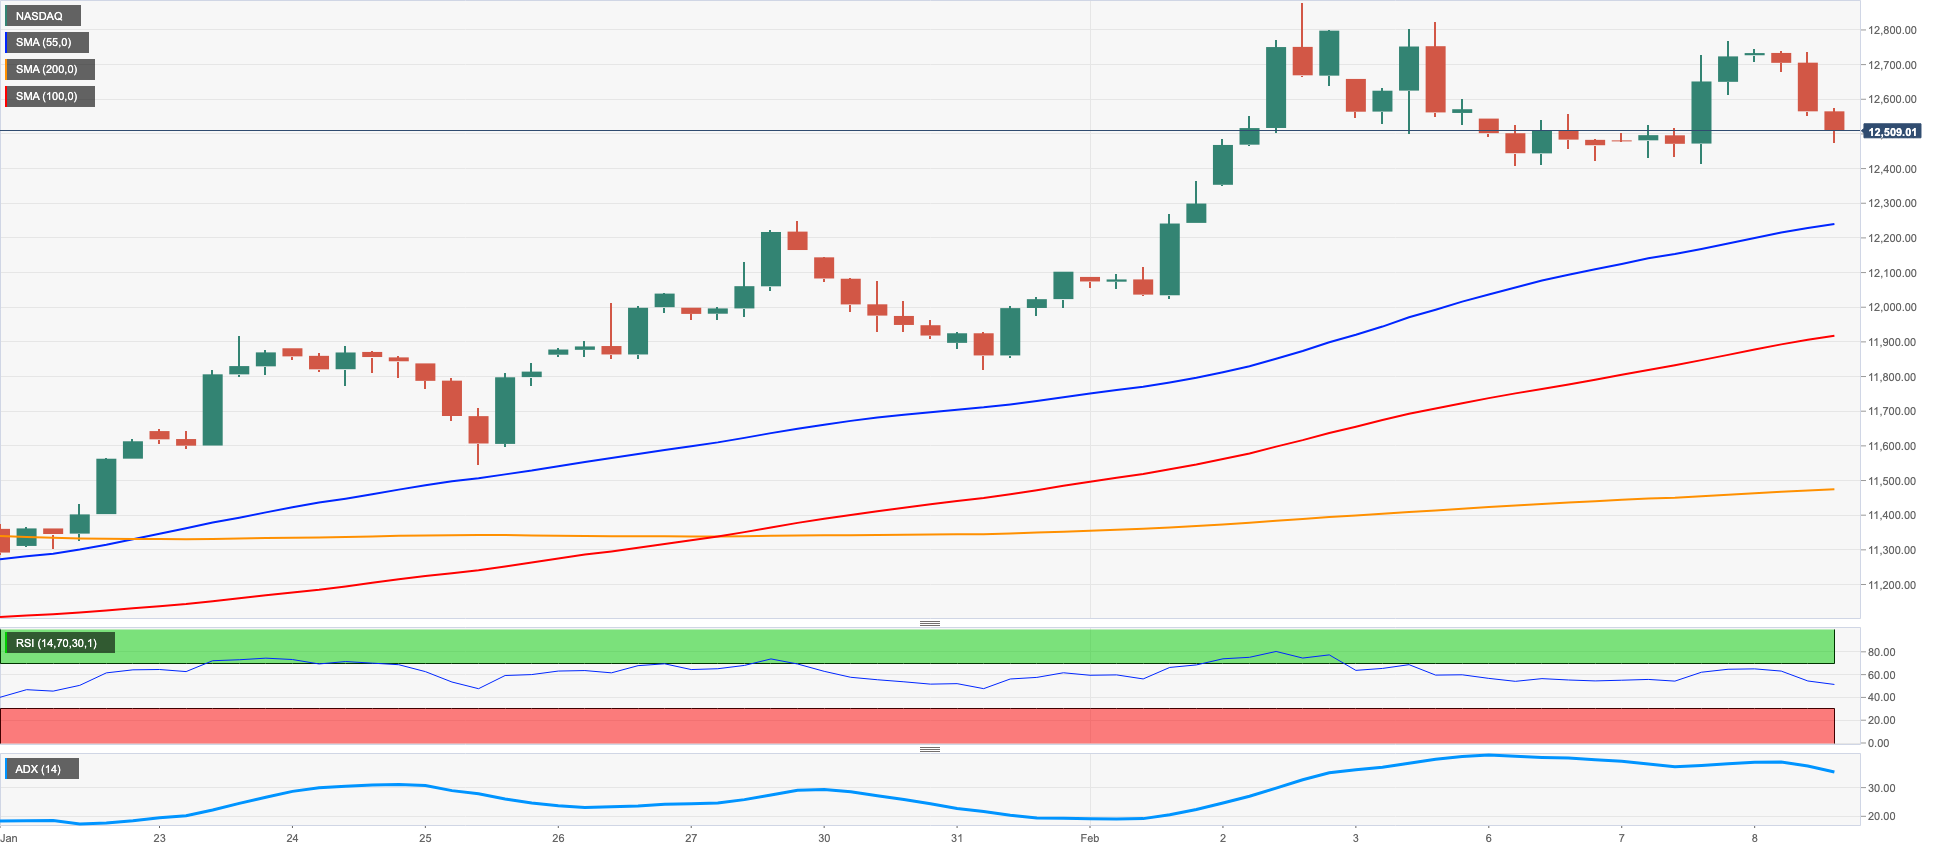
The resumption of the Fed’s hawkish narrative in combination with disappointing news from megacap Alphabet were enough to spark a moderate decline in the tech reference index Nasdaq 100.
Indeed, Fed-speakers (Williams, Kashkari, Cook) reiterated once again the bank’s intention to extend the tightening cycle beyond the 5%-5.25% threshold and stay around those levels for some time.
Those comments weighed on investors’ sentiment and forced the major US stocks indices to give away part of Tuesday’s intense advance.
Despite the daily decline, the outlook for the Nasdaq 100 remains skewed to the upside for the time being. Against that, the 2023 high at 12880 (February 2) remains the initial hurdle ahead of the round level at 13000 and prior to the weekly top at 13175 (August 26 2022). In the opposite direction, the loss of the weekly low at 12411 (February 6) should put the key 200-day SMA at 11943 to the test before weekly lows at 11550 (January 25) and 11251 (January 19). Down from here comes the January low at 10696 (January 6) seconded by the December 2022 low at 10671 (December 22) and the November 2022 low at 10632 (November 4). The daily RSI receded to the 62 neighbourhood.
Top Gainers: Fortinet, Palo Alto Networks, Tesla
Top Losers: Alphabet A, Alphabet C, Illumina
Resistance levels: 12771 12880 13175 (4H chart)
Support levels: 12411 11906 11550 (4H chart)
DOW JONES
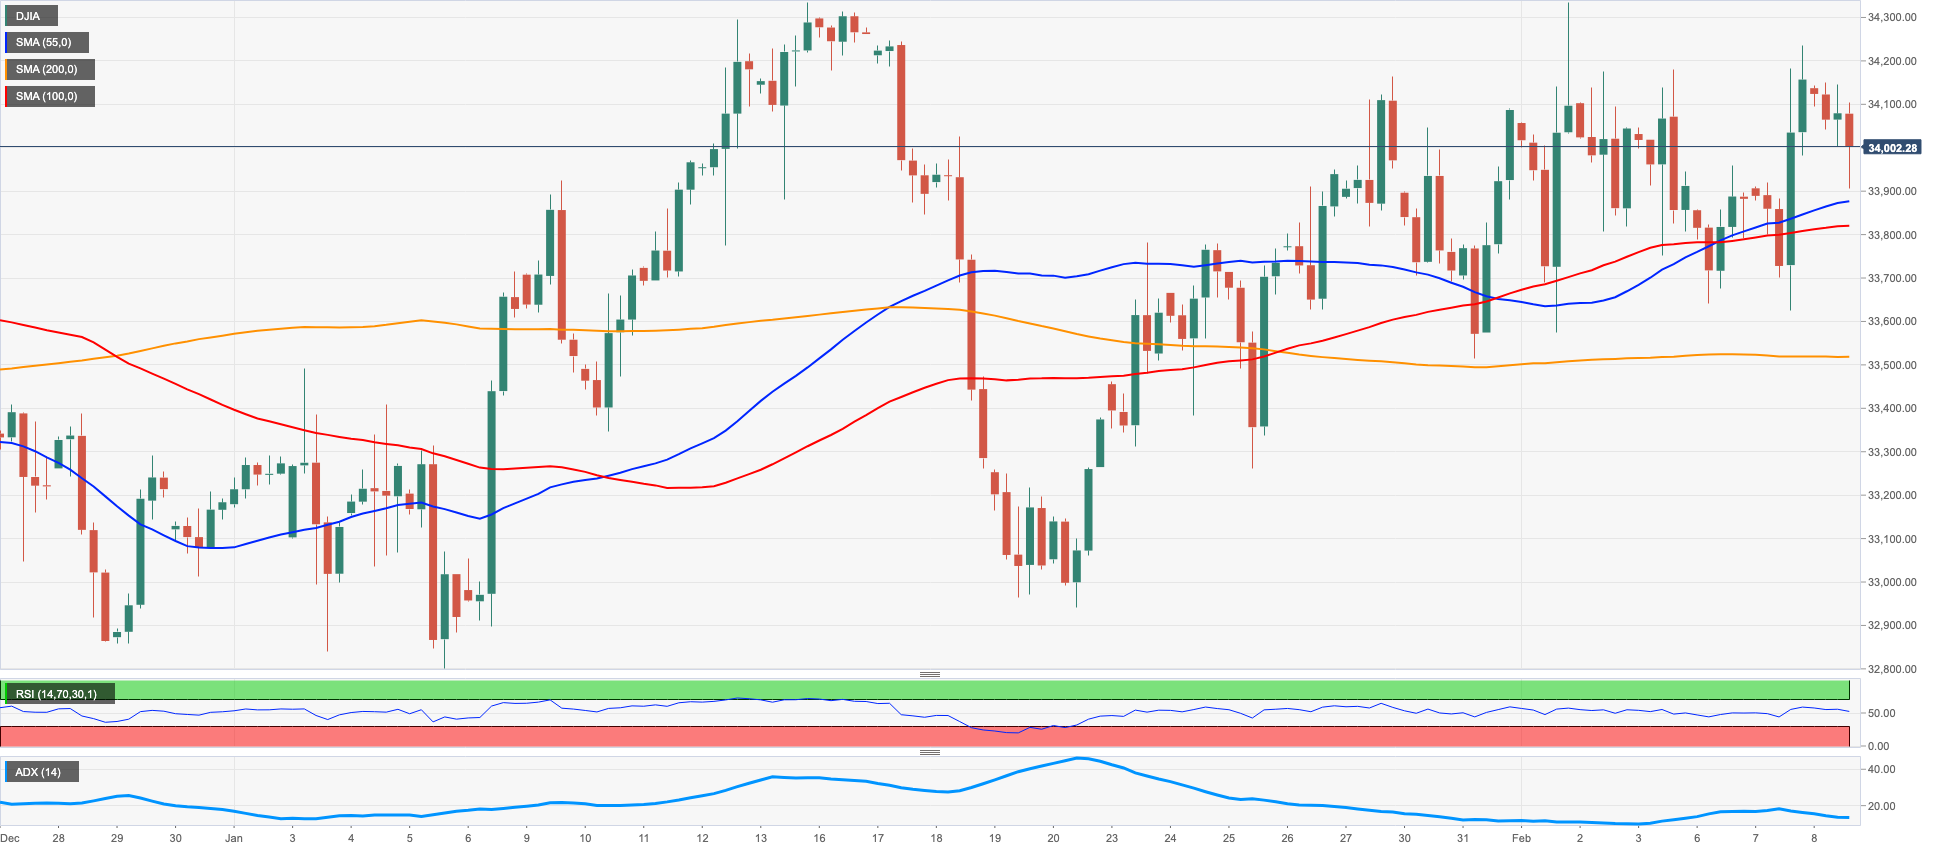
Sellers returned to the markets and triggered a corrective knee-jerk in equites measured by the Dow Jones on Wednesday.
Investors, in fact, succumbed once again to aggressive Fed-speak (Williams, Cook and Kashkari this time), which insisted that rates will still go further up to levels beyond the 5%, and the central bank intends to keep the restrictive stance for quite some time.
On the whole, the Dow Jones dropped 0.35% to 34027, the S&P500 deflated 0.98% to 4123 and the tech-heavy Nasdaq Composite retreated 1.57% to 11924.
The Dow Jones remains within a consolidative fashion and occasional bullish attempts keep targeting the weekly high at 34334 (February 1), which is closely followed by the 2023 top at 34342 (January 13) and the December 2022 peak at 34712 (December 13). Further up comes the April 2022 high at 35492 ahead of the February 2022 top at 35824 (February 9). By contrast, sellers should not meet any contention of note until the weekly low at 32948 (January 20) prior to the December 2022 low at 32573 (December 22) and the key 200-day SMA at 32326.
Top Performers: Merck&Co, UnitedHealth, Goldman Sachs
Worst Performers: Nike, Chevron, Intel
Resistance levels: 34334 34712 35492 (4H chart)
Support levels: 33581 33273 32948 (4H chart)
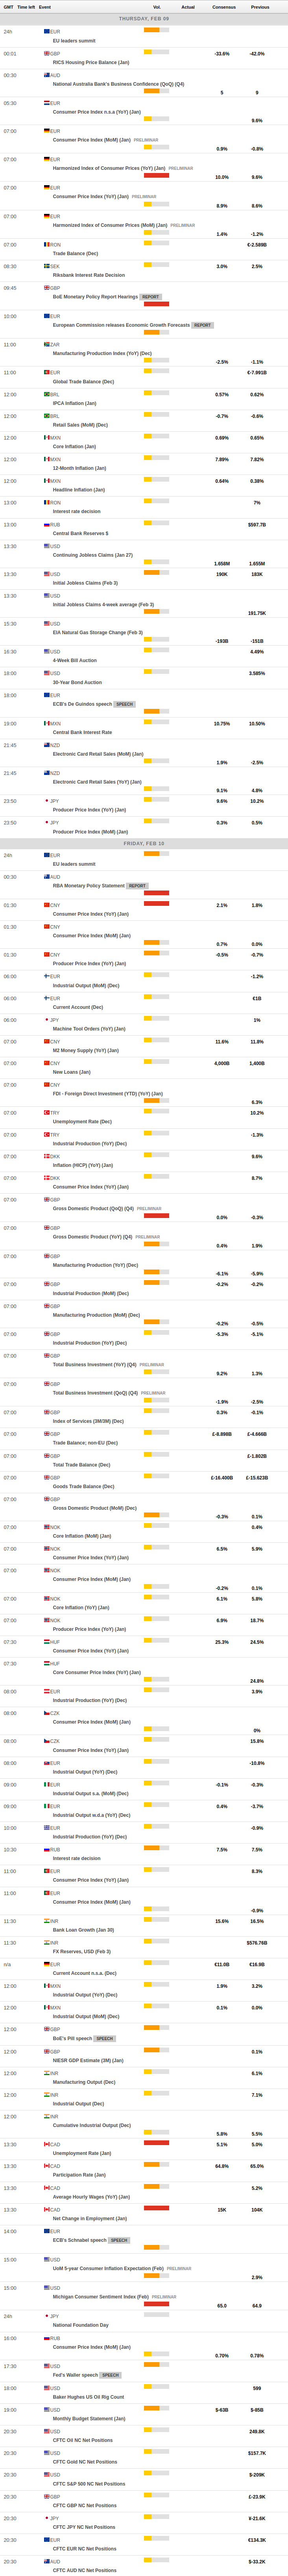
MACROECONOMIC EVENTS
All Information & Updates provided by:

All information relating to the financial markets available on this page has been prepared and issued by FXStreet (Forexstreet SL, Spain, Reg: B62498233) on the basis of publicly available information and all information believed to be reliable and does not conflict with Kuwaiti local laws, and all necessary care has been taken to before the company to ensure that the facts mentioned are correct from the source.
NCM Investment nor any of its directors or employees shall in any way be held responsible for the contents of this news, and the information contained on this page is intended only to provide clients with publicly available information and should not be construed as investment advice, report or analysis and/or constitute an offer or invitation to buy or sell financial instruments of any kind.
RISK WARNING: Forex and CFDs are highly risky leveraged products, as losses can exceed deposits. Please ensure you understand all the risks and take independent advice if necessary. NCM will segregate the clients based on the criteria of the regulator and its bylaws. NCM does not provide any advisory service; the material published does not constitute advice or a recommendation for a transaction in any financial instrument. NCM accepts no responsibility for any use of the content presented and any consequences of that use. Anyone acting on the information provided does so at their own risk.