
- Contact Us:
-

-

-

-


Daily Market Updates
10 Feb 2023
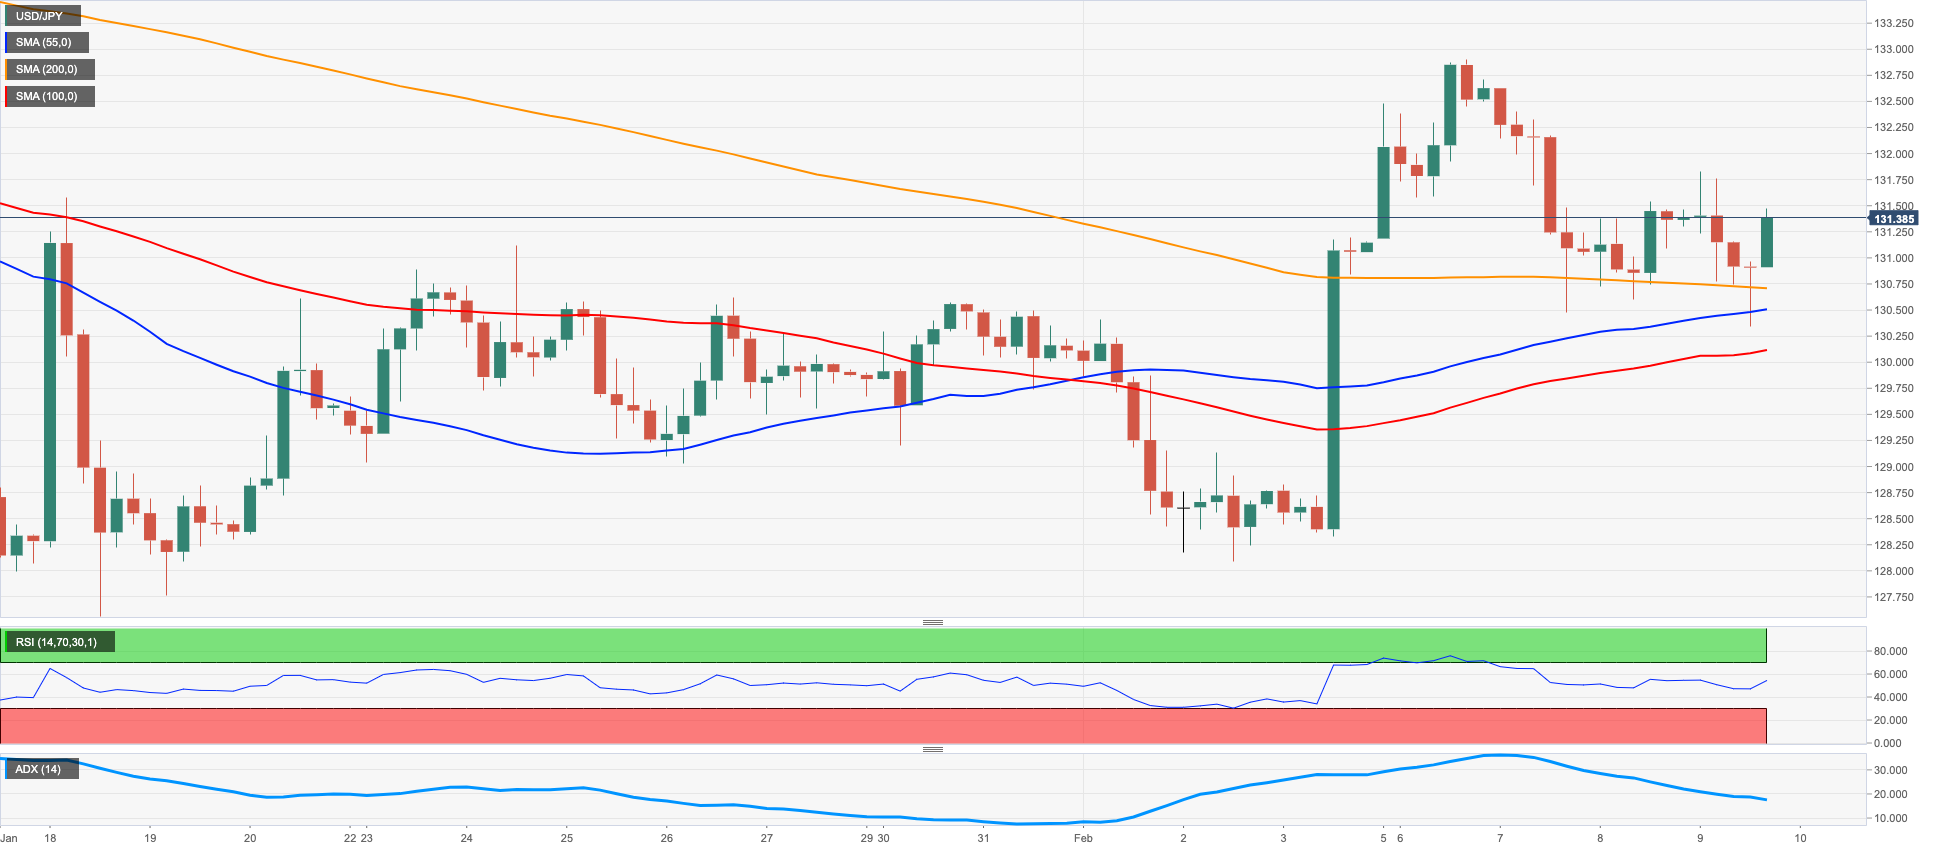
USDJPY
USD/JPY extended the rebound and added to Wednesday’s modest advance, refocusing once again on the 132.00 neighbourhood on Thursday.
This time, spot managed to ignore the negative sentiment in the greenback and gathered extra steam in response to the U-turn in US yields across the curve, briefly advancing to levels just shy of the 132.00 mark.
In the Japanese bond market, the JGB 10-year reference yields remained side-lined around the 0.50% level.
In Japan, Foreign Bond Investment rose to ¥1127.5B in the week to February 4, while Machine Tool Orders contracted at an annualized 9.7% in January.
If the decline gathers momentum, USD/JPY could retest the February low at 128.08 (February 2) prior to the 2023 low at 127.21 (January 16). A deeper pullback could put the May 2022 low at 126.36 (May 24) to the test ahead of the weekly low at 121.27 (March 31 2022). The other way around, the interim 55-day SMA at 132.80 precedes the February high at 132.90 (February 6) before the 2023 top at 134.77 (January 6). The surpass of this level exposes a potential move to the key 200-day SMA at 136.79 prior to weekly peaks at 138.17 (December 15 2022) and 139.89 (November 30 2022) ahead of the key round level at 140.00. The daily RSI improved further and poked with the 52 zone.
Resistance levels: 131.82 132.90 134.77 (4H chart)
Support levels: 130.34 129.86 128.08 (4H chart)
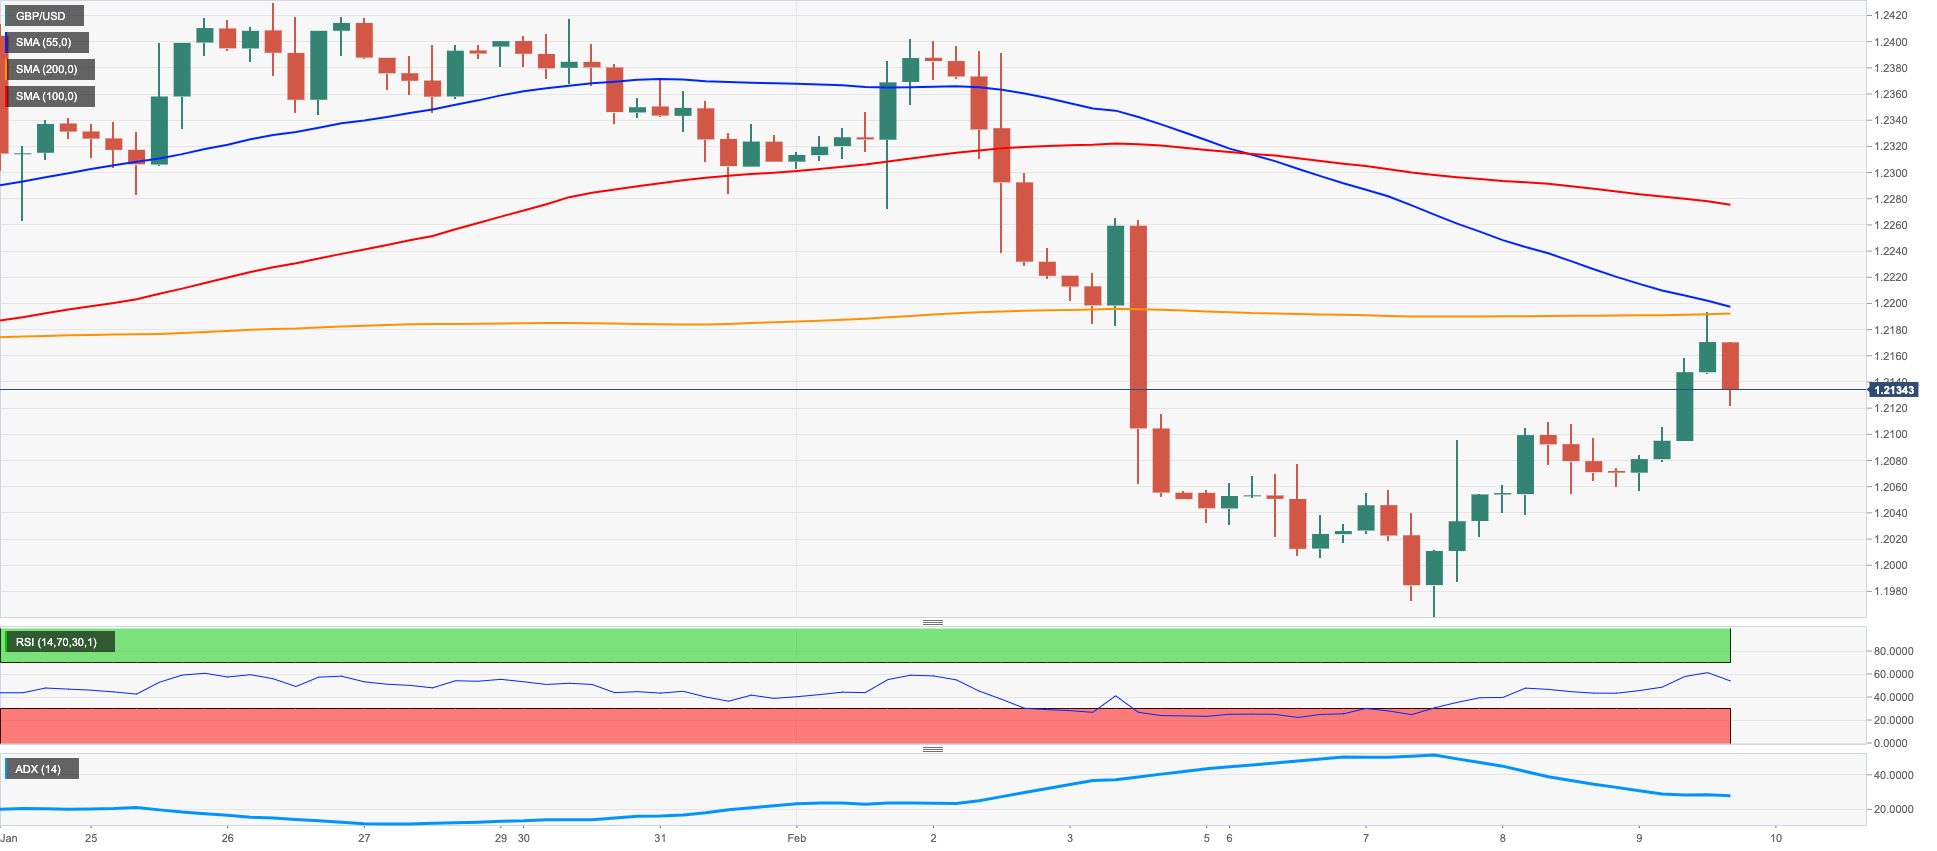
GBPUSD
GBP/USD kept the weekly recovery well in place on Thursday, advancing for the third session in a row and retesting the just below 1.2200 the figure.
The moderate decline in the greenback allowed some respite to the risk complex and lent extra oxygen to the upside momentum around the British pound. In the meantime, Cable remains well underpinned by the 200-day SMA, today near 1.1940.
Indeed, Cable added to Tuesday’s advance and regained the area near the 1.2200 mark amidst a decent improvement in the appetite for riskier assets, while the 10-year Gilt yields kept hovering around so far monthly peaks around 3.30%.
The UK calendar remained empty on Thursday, leaving all the attention to the publication of GDP results, Industrial Production, Balance of Trade and Construction Output, all expected on Friday.
The continuation of the weekly recovery in GBP/USD faces the next hurdle at the weekly high at 1.2193 (February 9). Once that region is cleared, Cable could challenge the 2023 peak at 1.2447 (January 23) ahead of the May 2022 high at 1.2666 (May 27) and the key 200-week SMA at 1.2896, which is closely followed by the psychological 1.3000 yardstick. Having said that, initial support comes at the February low at 1.1960 (February 7) just before the key 200-day SMA at 1.1943. South from here turns up the 2023 low at 1.1841 (January 6) prior to the temporary 100-day SMA at 1.1830. The daily RSI edged further up and surpassed 45.
Resistance levels: 1.2193 1.2265 1.2401 (4H chart)
Support levels: 1.1960 1.1841 1.1778 (4H chart)
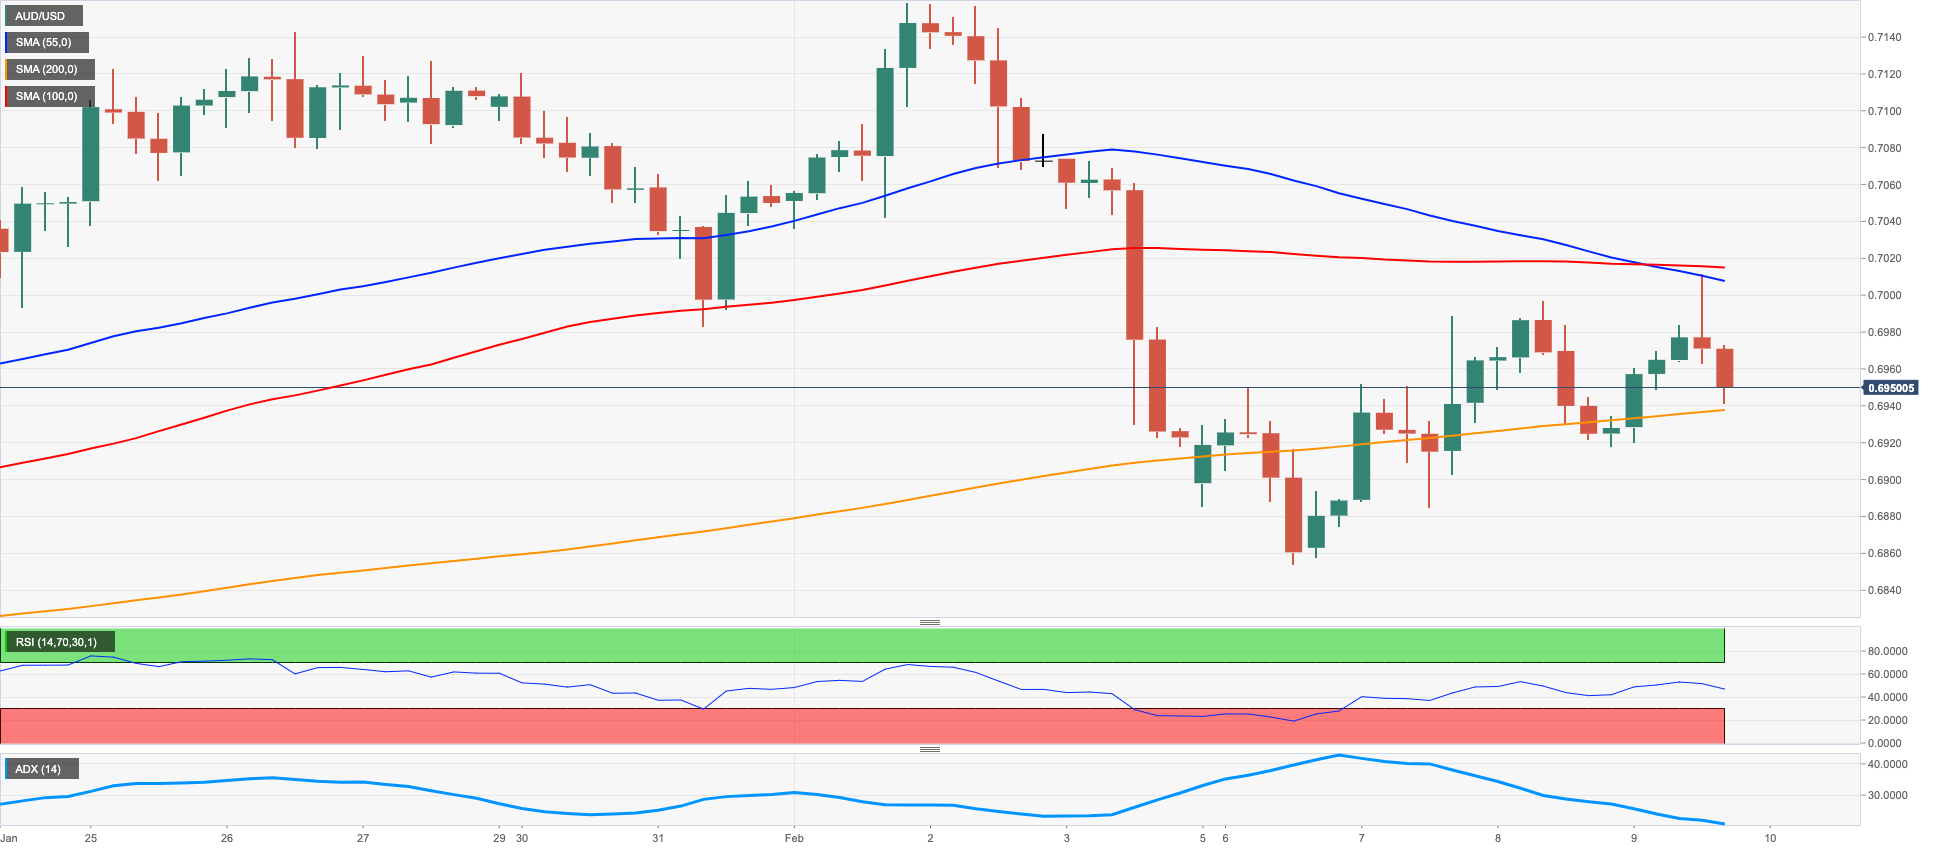
AUDUSD
The pronounced decline in the greenback allowed AUD/USD to resume to weekly recovery and briefly trespass the key 0.7000 barrier on Thursday.
The resumption of a strong buying interest around the risk-associated universe helped the Aussie dollar to advance to weekly highs and extend the bounce off Monday’s multi-week lows near 0.6850.
The mixed performance of the commodity complex also helped AUD reclaim ground lost, with both copper prices and the iron ore advancing modestly on Thursday.
Indeed, the pair gave away part of Tuesday’s strong recovery despite the price action around the US dollar remaining inconclusive and investors continued to adjust to the hawkish hike by the RBA on Tuesday.
In addition, the generalized bearish tone in the commodity complex saw copper prices and the iron ore retreating further, all helping with the daily downtick in the Aussie dollar.
In the Australian calendar, final results saw Building Permits expand 18.5% MoM in December and contract 3.8% vs. the same month of 2021. In addition, Private House Approvals contracted 2.3% MoM also in December.
The surpass of the key 0.7000 barrier should motivate AUD/USD to dispute the 2023 peak at 0.7157 (February 2) seconded by the round level at 0.7200 and ahead of the June 2022 high at 0.7282 (June 3). On the contrary, the February low at 0.6855 (February 6) appears propped up by the 55-day SMA, while the loss of this region could put a test of the key 200-day SMA at 0.6804 back on the investors’ radar ahead of the 2023 low at 0.6688 (January 3) and before the December 2022 low at 0.6629 (December 20). The daily RSI improved further and approached the 53 region.
Resistance levels: 0.7011 0.7072 0.7157 (4H chart)
Support levels: 0.6931 0.6855 0.6722 (4H chart)
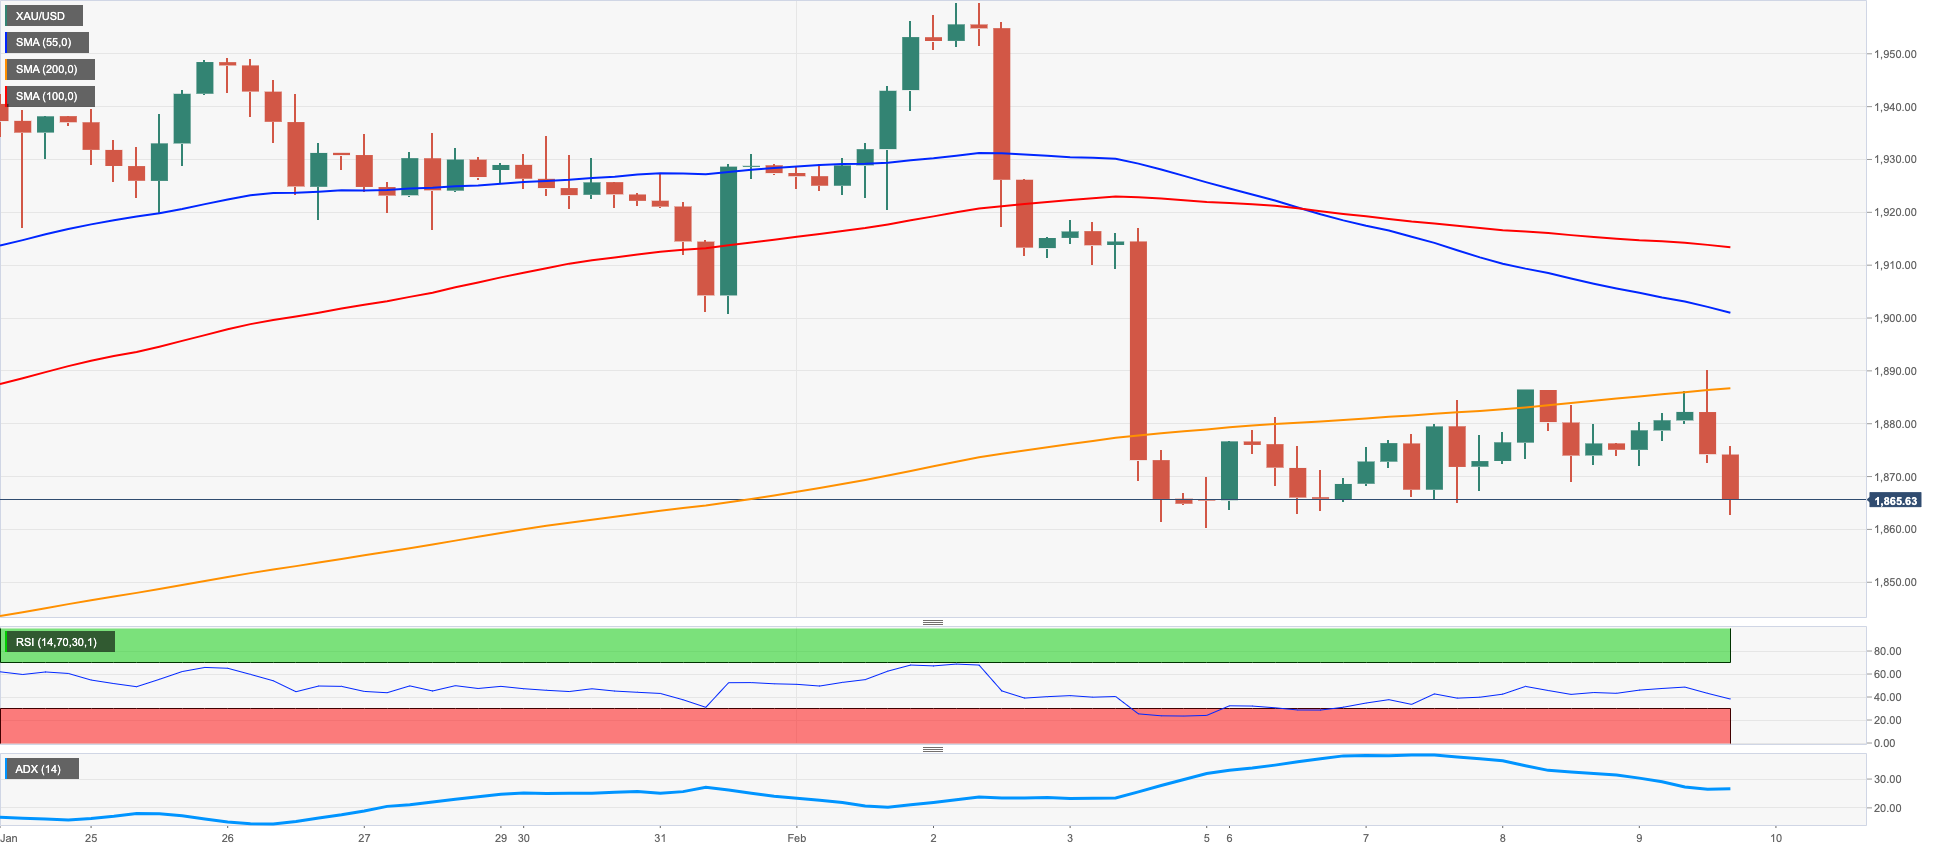
GOLD
After hitting fresh weekly tops around $1890, gold prices deflated afterwards and returned to the negative territory for the first time after three consecutive daily advances.
Initially, the ounce troy of the precious metal extended its march north after further downside pressure in the greenback forced the USD Index (DXY) to slip back below the 103.00 support, or weekly lows.
However, the late strong bounce in US yields across the curve put bullion under renewed and strong downside pressure and forced it to recede to the vicinity of the key contention area near $1860.
There are no changes to the topside in gold, as the metal continues to target the 2023 top at $1959 (February 2) ahead of the April 2022 peak at $1998 (April 18). This level is closely followed by the psychological $2000 mark prior to the 2022 high at $2070 (March 8). For all that, immediate contention emerges at the February low at $1861 (February 3) seconded by the interim 55-day SMA at $1844 and the key $1800 region. Further down emerges the 200-day SMA at $1776 just before the provisional 100-day SMA at $1771 and the weekly low at $1727 (November 23).
Resistance levels: $1890 $1918 $1959 (4H chart)
Support levels: $1861 $1825 $1797 (4H chart)
CRUDE WTI
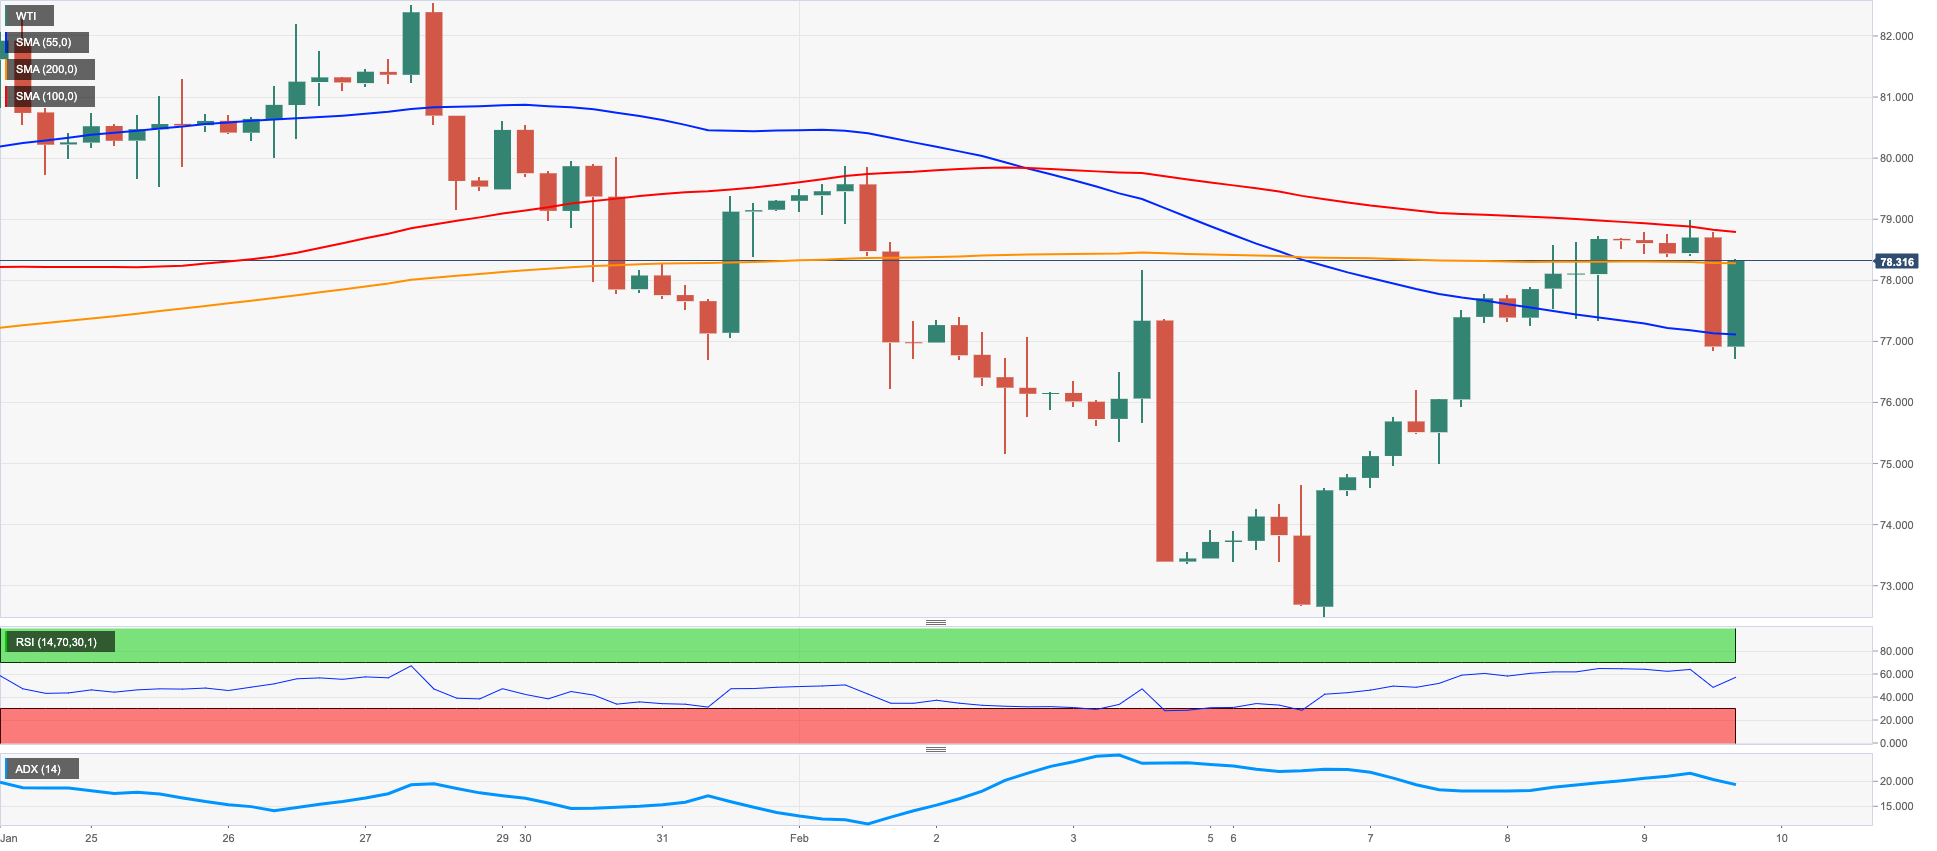
Prices of the WTI saw their strong weekly recovery trimmed on Thursday.
In fact, and after hitting new tops near $78.80, crude oil prices embarked on a corrective decline in response to renewed concerns over a probable slowdown in the economy and its impact on the demand for the commodity. These fears were exacerbated in past hours in light of further hawkish messages from Fed’s rate setters.
Collaborating with the sour mood among traders, the recent strong build in US crude oil inventories - as per the weekly report by the EIA - increased to levels last seen nearly 2 years ago.
As usual, prospects for the rebound in the demand for crude oil in tandem with the Chinese reopening somehow limited the daily retracement.
WTI seems to have met some resistance below the key $80.00 mark per barrel so far. Against that, further upside could then confront the temporary 100-day SMA at $81.08 ahead of the 2023 high at $82.60 (January 23) and the December 2022 top at $83.32 (December 1). Further north appears the $90.08 level (November 11 2022) prior to the 200-day SMA at $91.11. On the other hand, there are no support levels of note until the 2023 low at $72.30 (February 6). The breach of this level exposes the 2022 low at $70.10 (December 9), just before the key round level at $70.00 and the weekly low at $66.15 (December 20 2021).
Resistance levels: $78.80 $79.68 $82.44 (4H chart)
Support levels: $77.11 $74.72 $72.22 (4H chart)
GER40
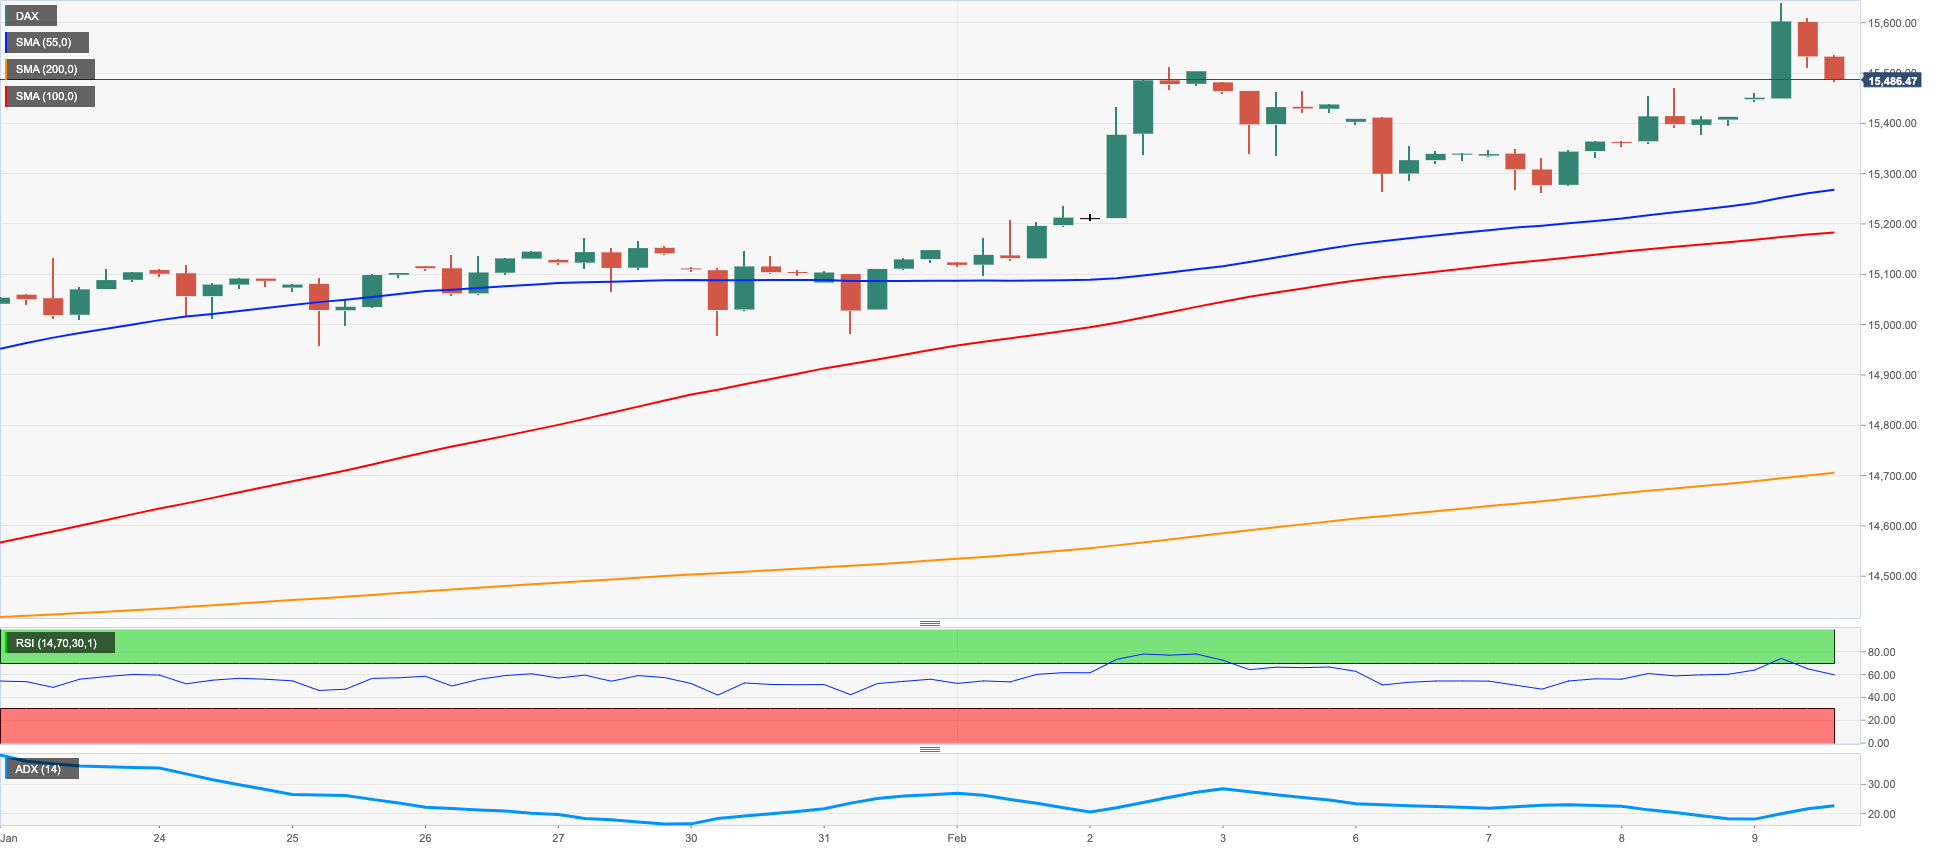
European stocks navigated a “sea of green” on Thursday on the back of encouraging corporate results and the broad-based mood tilted towards the risk complex. That said, the German stock benchmark DAX40 climbed to levels last seen back a year ago near 15700, although it eased some ground afterwards, ending the session with decent gains.
In addition, market participants appear to have already started to look past the already anticipated 50 bps rate hike by the ECB at its March event despite aggressive ECB-speak favouring the continuation of the tightening cycle (De Guindos, Knot).
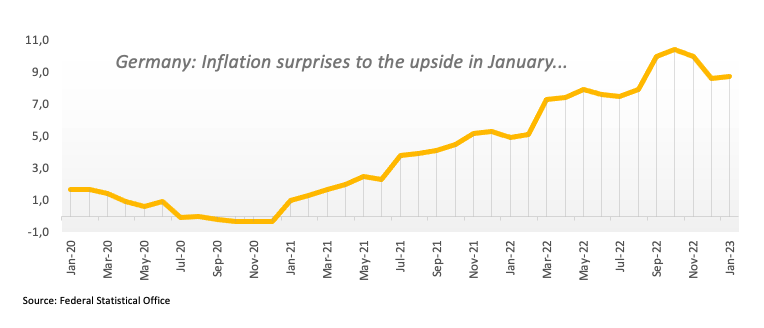
In addition, mixed results from the preliminary inflation readings in Germany showed the CPI rising 8.7% YoY in January (from 8.6%), while the broader HICP is seen gaining 9.2% over the last twelve months (from 9.6%). Of note, however, is that the CPI now shifted to a new base year and a new balance of the goods’ basket. That said, investors should wait for the December prints based on the new basket of goods to assess the direction of inflation in January.
Looking at the German debt market, the 10-year Bund yields snapped four sessions in a row with gains and receded to the 2.30% region.
The DAX40 printed a new 2023 high at 15658 (February 2). The breakout of this level could then put the February 2022 peak at 15736 (February 2 2022) back on the investors’ radar ahead of the round level at 16000 and the 2022 high at 16285 (January 5). By contrast, there are no support levels of note until the weekly low at 14906 (January 19) followed by the provisional 55-day SMA at 14640 and the December 2022 low at 13791 (December 20). South from here comes the key 200-day SMA at 13674 before the November 2022 low at 13022 (November 3). The daily RSI moved into the overbought territory just past 70.
Best Performers: Siemens AG, Fresenius SE, Siemens Energy AG
Worst Performers: Bayer, Fresenius Medical Care KGAA ST, Symrise AG
Resistance levels: 15658 15736 15912 (4H chart)
Support levels: 15273 14969 14906 (4H chart)
NASDAQ
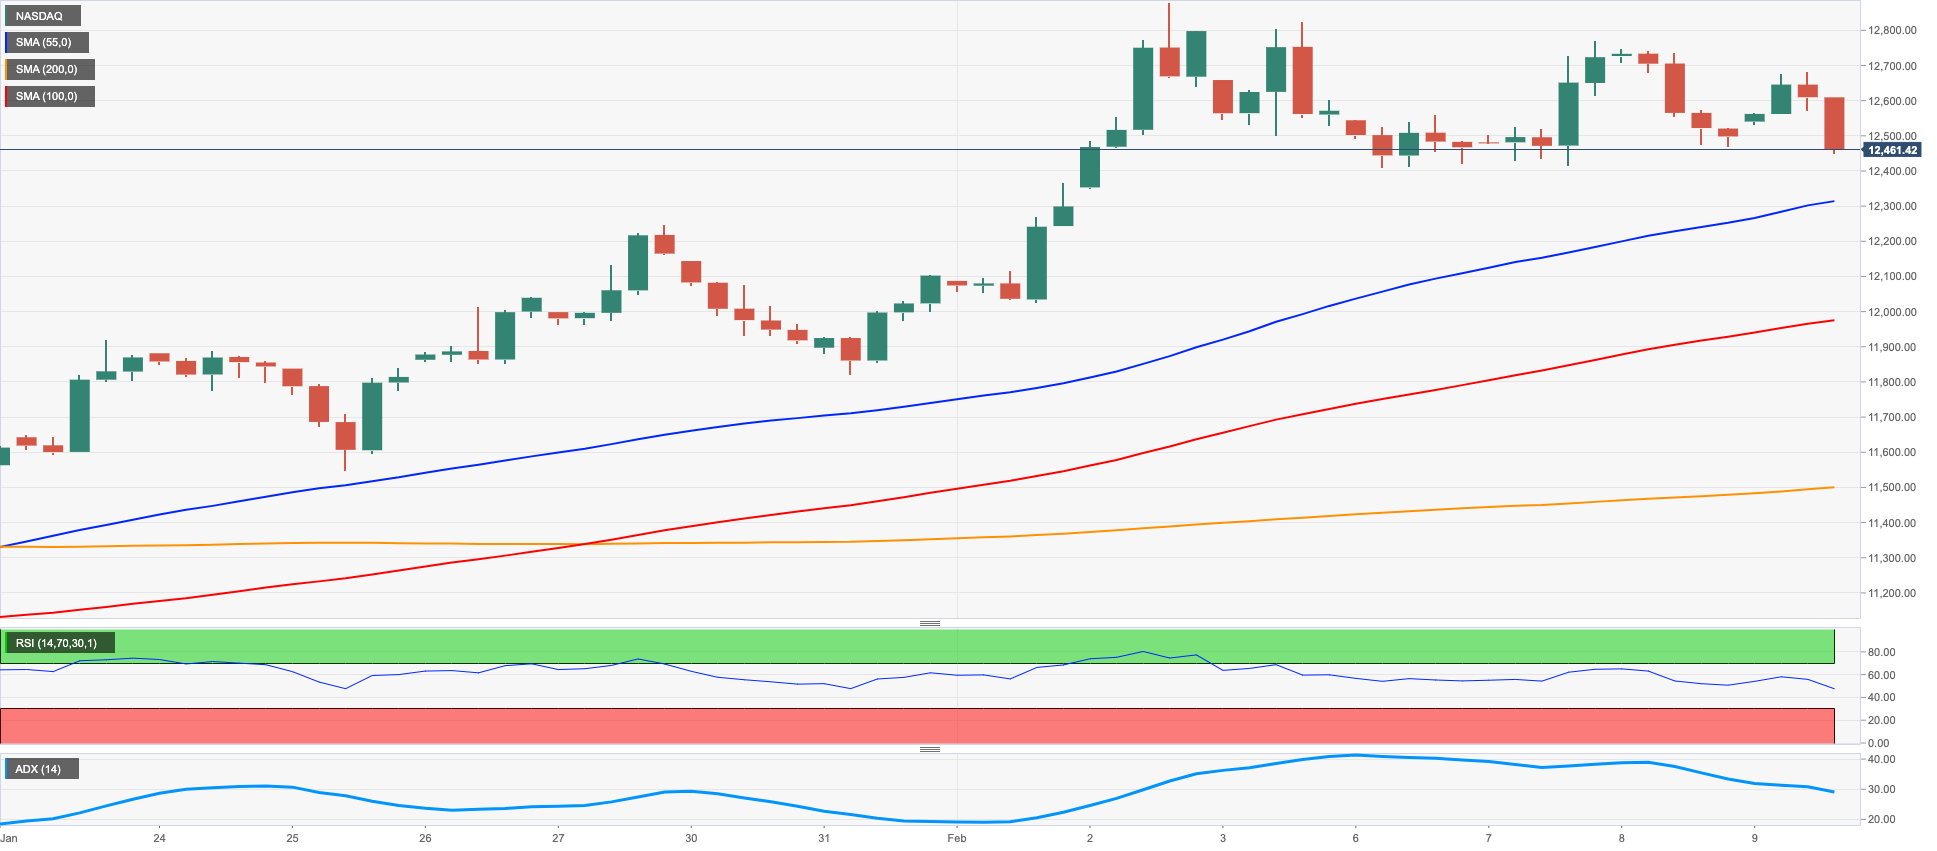
Tech stocks gauged by the Nasdaq 100 alternated gains with losses near the 12500 zone at the beginning of the second half of the week following Wednesday’s marked decline.
In fact, the index remained close to the previous day’s closing levels despite some corporate results came in on the strong side, while the tepid rebound in the greenback from daily lows and the abrupt change of direction in US yields - which rapidly reversed the bearish mood that prevailed since the opening bell in Europe – kept the price action around the index subdued.
Next on the upside for the Nasdaq 100 aligns the 2023 top at 12880 (February 2) closely followed by the round level at 13000 and the weekly top at 13175 (August 26 2022). On the flip side, the breach of the weekly low at 12411 (February 6) could accelerate the decline to the key 200-day SMA at 11938 ahead of weekly lows at 11550 (January 25) and 11251 (January 19). Extra losses are expected to retest the January low at 10696 (January 6) prior to the December 2022 low at 10671 (December 22) and the November 2022 low at 10632 (November 4). The daily RSI broke below the 62 mark.
Top Gainers: AstraZeneca ADR, Tesla, Globalfoundries
Top Losers: Lucid Group, Alphabet C, Enphase
Resistance levels: 12771 12880 13175 (4H chart)
Support levels: 12411 11906 11550 (4H chart)
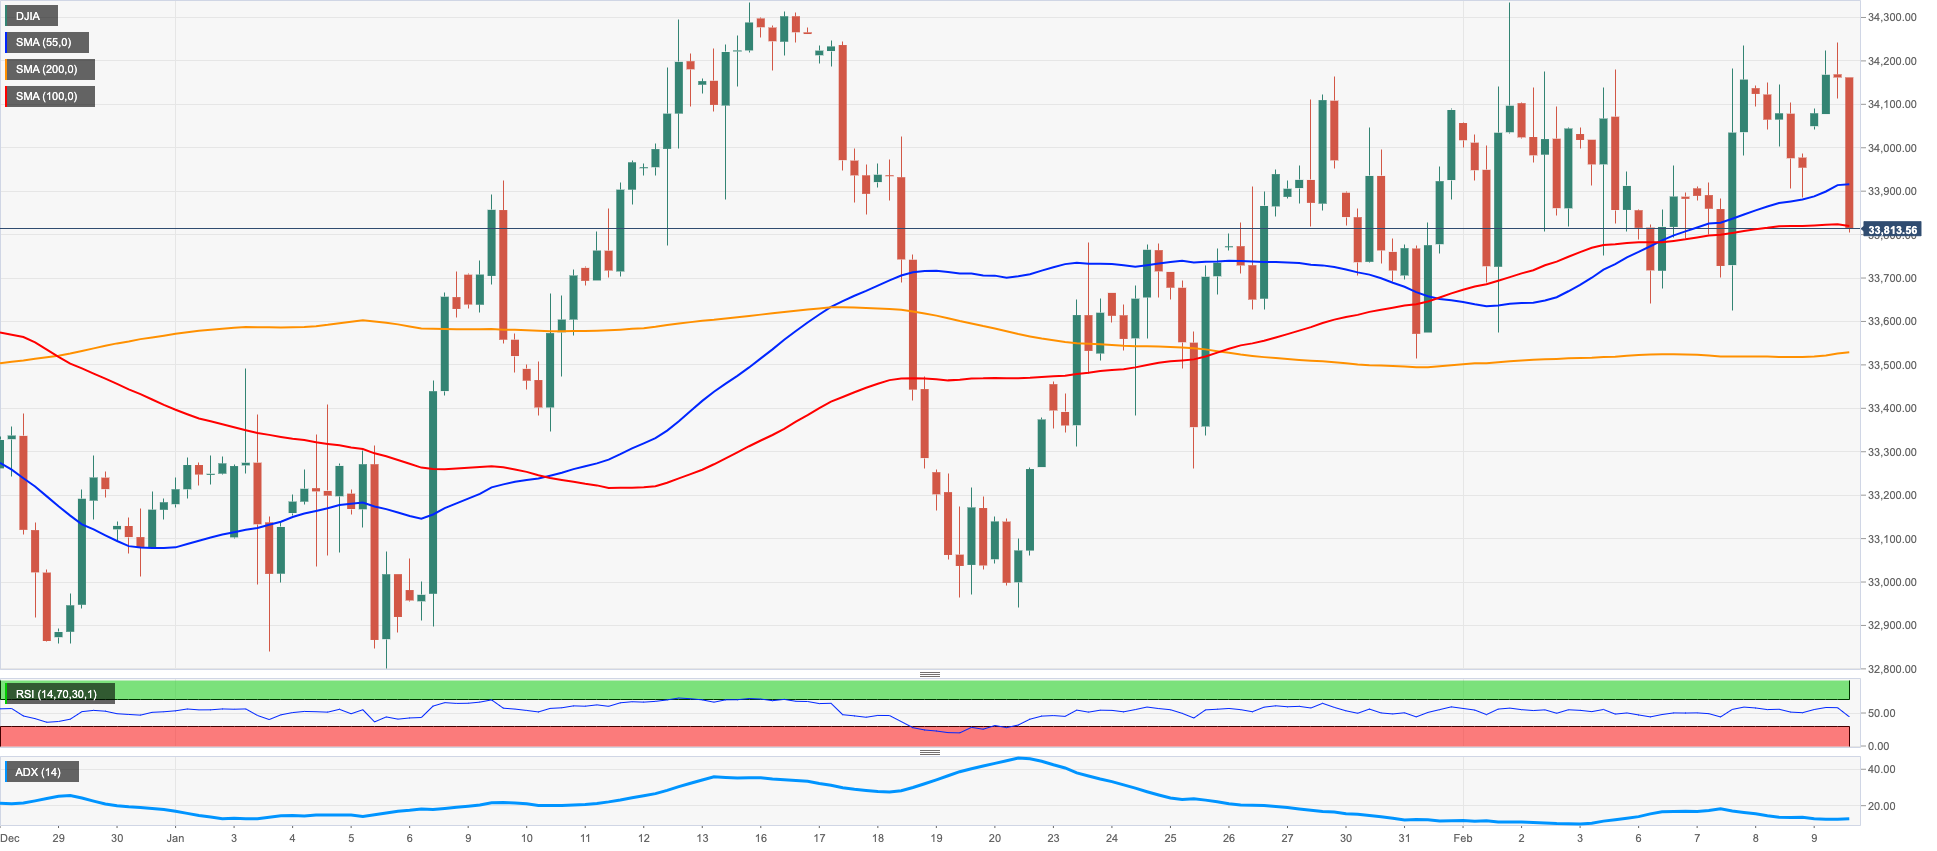
DOW JONES
Equities tracked by the Dow Jones added to Wednesday’s pullback and retreated to 2-day lows near the 33800 region on Thursday.
In fact, the index quickly faded the initial optimism led by better-than-expected corporate results and auspicious news and slipped back into the negative territory amidst the bounce in the dollar and the late U-turn in US yields, while recession concerns also played their part.
In the meantime, the Dow Jones retreated 0.35% to 33829, the S&P500 dropped 0.34% to 4103 and the tech-benchmark Nasdaq Composite deflated 0.31% to 11874.
While further range bound appears likely around the Dow Jones, the immediate hurdle remains at the weekly top at 34334 (February 1) just before the 2023 peak at 34342 (January 13) and the December 2022 high at 34712 (December 13). The surpass of this level could lead up to a visit to the April 2022 top at 35492 prior to the February 2022 peak at 35824 (February 9). In the opposite direction, there is a temporary support at the 55-day SMA at 33687 followed by the weekly low at 32948 (January 20). If bears push harder, then a test of the December 2022 low at 32573 (December 22) could start shaping up before the key 200-day SMA at 32326.
Top Performers: Salesforce Inc, Walt Disney, American Express
Worst Performers: Boeing, Walgreen Boots, Verizon
Resistance levels: 34334 34712 35492 (4H chart)
Support levels: 33634 33581 33273 (4H chart)
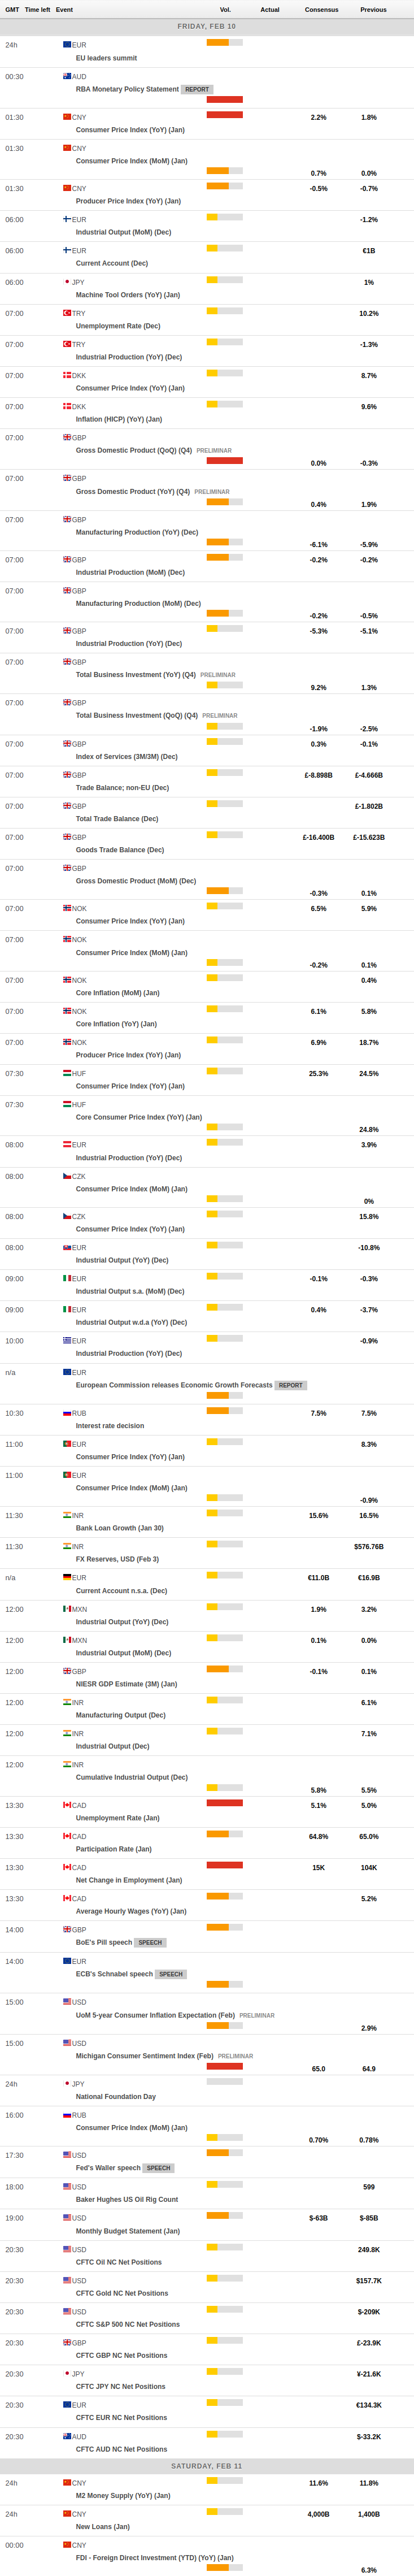
MACROECONOMIC EVENTS
All Information & Updates provided by:

All information relating to the financial markets available on this page has been prepared and issued by FXStreet (Forexstreet SL, Spain, Reg: B62498233) on the basis of publicly available information and all information believed to be reliable and does not conflict with Kuwaiti local laws, and all necessary care has been taken to before the company to ensure that the facts mentioned are correct from the source.
NCM Investment nor any of its directors or employees shall in any way be held responsible for the contents of this news, and the information contained on this page is intended only to provide clients with publicly available information and should not be construed as investment advice, report or analysis and/or constitute an offer or invitation to buy or sell financial instruments of any kind.
RISK WARNING: Forex and CFDs are highly risky leveraged products, as losses can exceed deposits. Please ensure you understand all the risks and take independent advice if necessary. NCM will segregate the clients based on the criteria of the regulator and its bylaws. NCM does not provide any advisory service; the material published does not constitute advice or a recommendation for a transaction in any financial instrument. NCM accepts no responsibility for any use of the content presented and any consequences of that use. Anyone acting on the information provided does so at their own risk.