
- Contact Us:
-

-

-

-


Daily Market Updates
13 Feb 2023
USDJPY
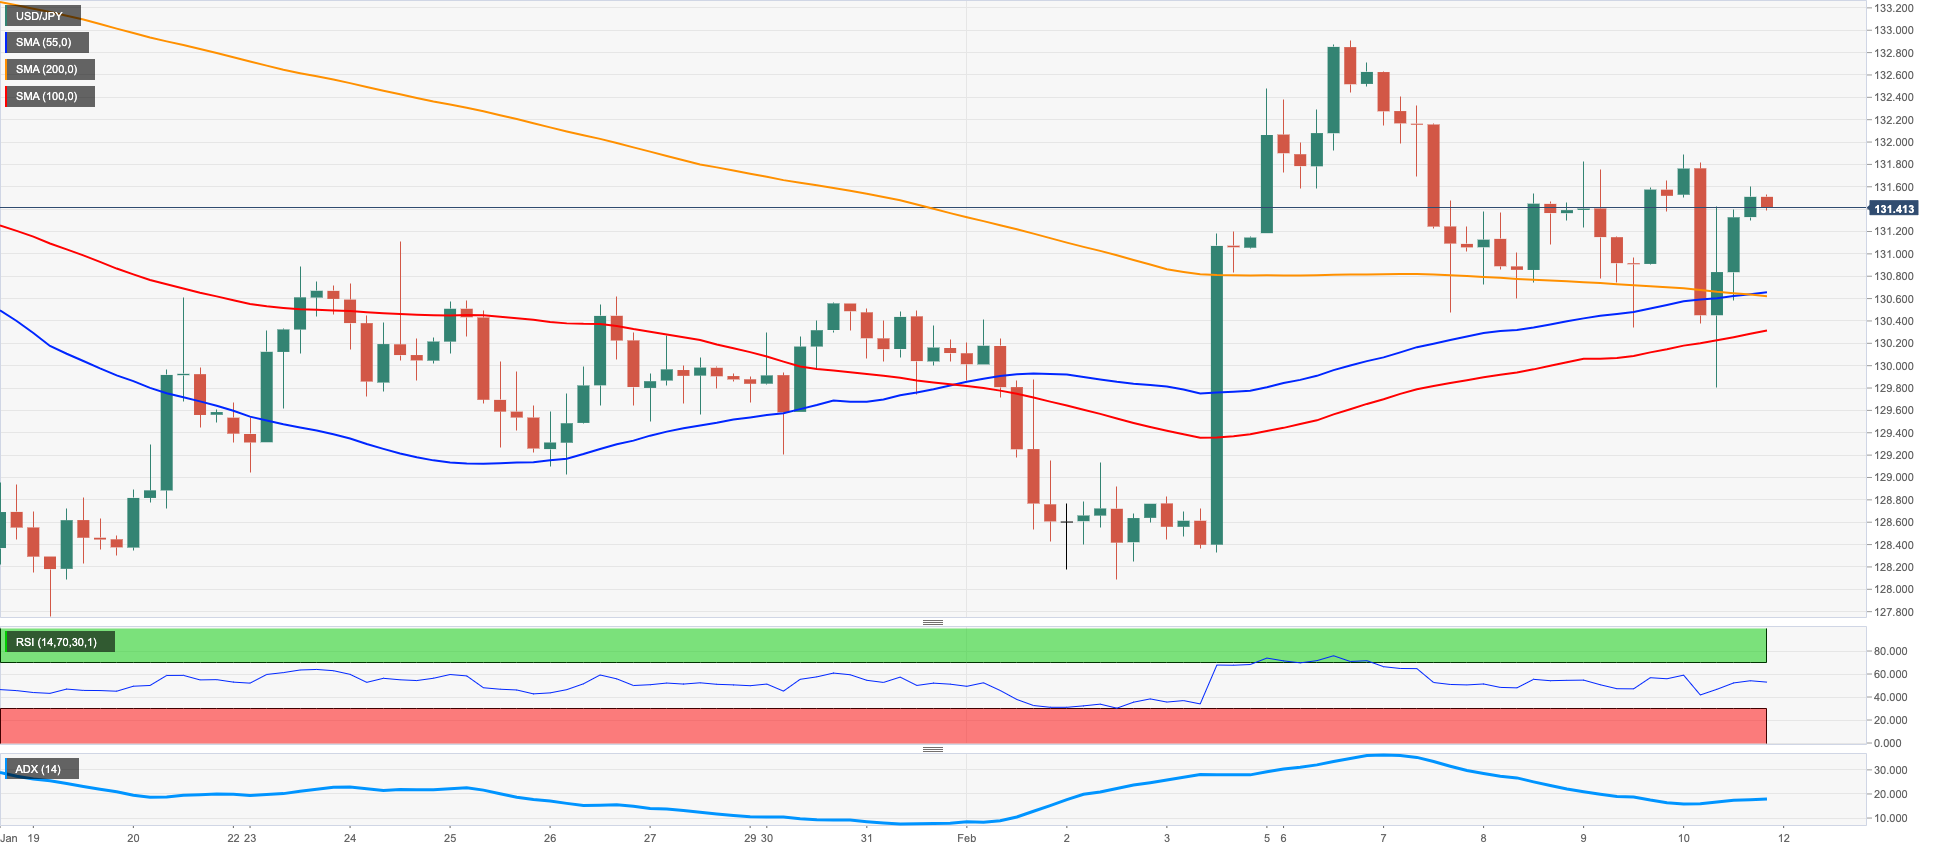
USD/JPY managed to reverse an earlier drop to multi-day lows in the sub-130.00 region and close well north of 131.00 the figure on Friday, up marginally for the day.
The negative price action in the pair came despite renewed and strong buying interest around the greenback, while the continuation of the march north in US yields helped spot reverse that initial acute knee-jerk.
On the domestic front, the Japanese government would likely nominate K.Ueda to succeed H.Kuroda at the helm of the Bank of Japan.
In the Japanese calendar, Producer Prices came in flat vs. the previous month in January and rose 9.5% from a year earlier.
USD/JPY appears side-lined for the time being. In case the selling pressure picks up pace, the pair should meet initial support at the weekly low at 129.79 (February 10) ahead of the February low at 128.08 (February 2). Down from here emerges the 2023 low at 127.21 (January 16) prior to the May 2022 low at 126.36 (May 24) and the weekly low at 121.27 (March 31 2022). Having said that, occasional bullish attempts should meet a temporary hurdle at the temporary 55-day SMA at 132.67 just ahead of the February top at 132.90 (February 6). Once this level is cleared, the pair could dispute the 2023 peak at 134.77 (January 6) followed by the key 200-day SMA at 136.80 and weekly highs at 138.17 (December 15 2022) and 139.89 (November 30 2022), all prior to the key round level at 140.00. The daily RSI looked stable above 51.
Resistance levels: 131.88 132.90 134.77 (4H chart)
Support levels: 129.79 128.08 127.21 (4H chart)
GBPUSD
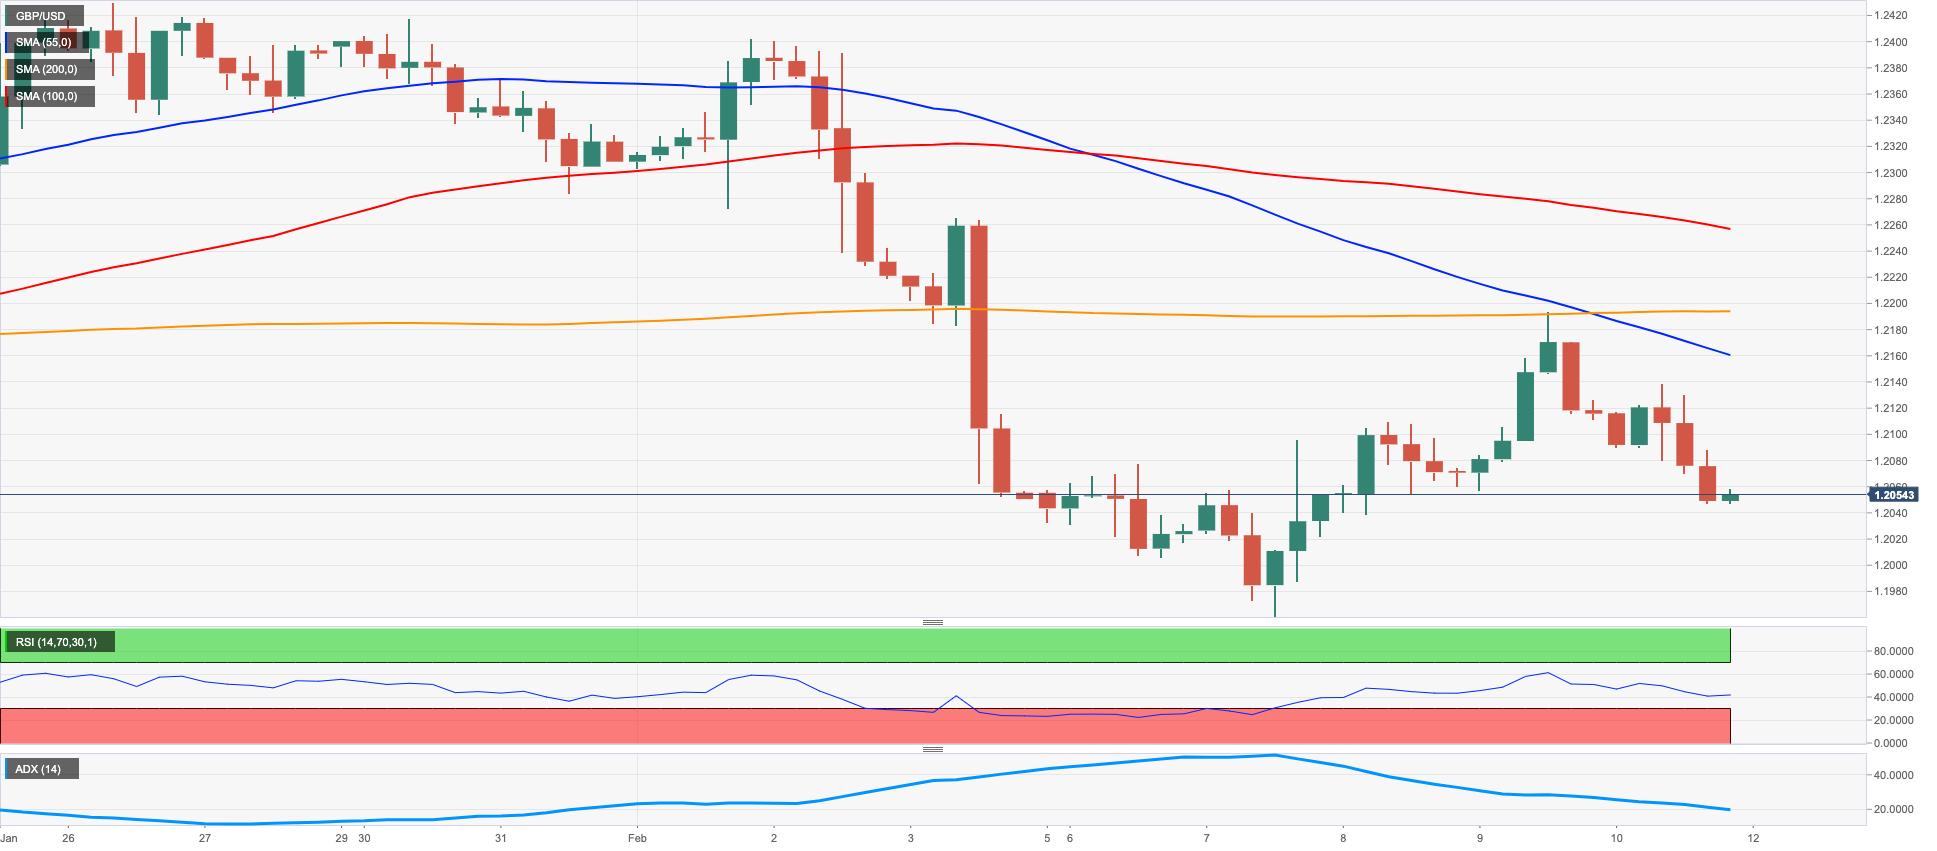
After three consecutive daily advances, GBP/USD met some moderate selling pressure on Friday, halting the recent positive streak and revisiting the mid-1.2000s at the same time.
The renewed bounce in the demand for the greenback put Cable’s recent upside to the test at the end of the week, helped at the same time by mixed results from key UK fundamentals, while the likeliness that the UK economy could have avoided recession in Q4 failed to lend some support to the quid either.
On the latter, the GDP 3-Month Average came in flat in December, while the GDP contracted less than expected 0.1% YoY in the same month and the flash GDP Growth Rate saw the economy expanding 0.4% YoY in Q4 and 0% inter-quarter. Additional releases for the month of December saw the Goods Trade deficit widen to £19.271B, Construction Output expanded 3.7% YoY, Industrial Production contract 4% from a year earlier and Manufacturing Production shrank 5.7% over the last twelve months. Finally, the NIESR Monthly GDP Tracker sees a 0.1% monthly contraction during January.
If bulls regain the upper hand, GBP/USD could be headed towards the weekly peak at 1.2193 (February 9) in the short-term horizon. The surpass of this level could put Cable en route to confront the 2023 high at 1.2447 (January 23) prior to the May 2022 top at 1.2666 (May 27) and ahead of the key 200-week SMA at 1.2896, all preceding the psychological 1.3000 mark. In the opposite direction, the February low at 1.1960 (February 7) remains propped up by the key 200-day SMA at 1.1942. Once this region is cleared, the 2023 low at 1.1841 (January 6) could emerge on the horizon before the interim 100-day SMA at 1.1842. The daily RSI grinded lower and approached the 41 yardstick.
Resistance levels: 1.2139 1.2193 1.2265 (4H chart)
Support levels: 1.2046 1.1960 1.1841 (4H chart)
AUDUSD
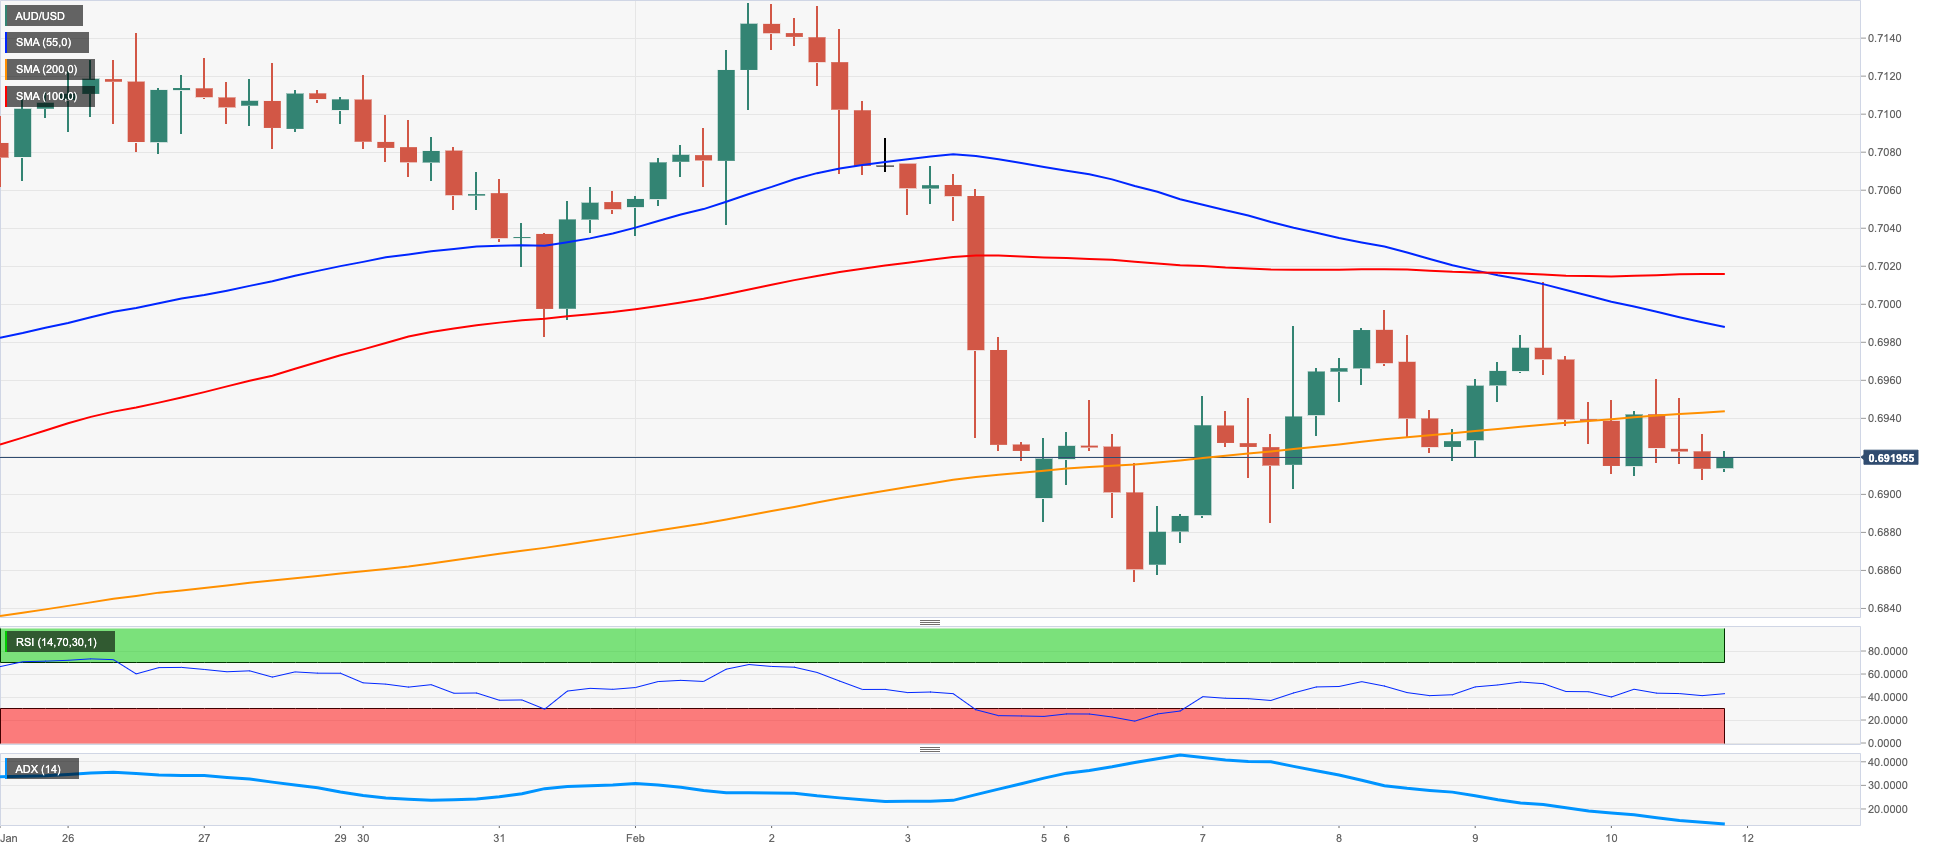
AUD/USD kept the erratic price action unchanged at the end of the week, this time ending the session just above the 0.6900 mark and adding to Thursday’s humble advance. All in all, the pair managed to close the week with decent gains and regain some ground following the previous strong pullback.
The resumption of the buying interest in the greenback kept the Aussie dollar on the defensive and the risk complex in general under pressure on Friday.
Extra weakness for AUD came from the commodity galaxy, where copper prices retreated modestly and the iron ore charted marginal gains.
In the docket, the RBA published its Statement on Monetary Policy (SoMP), where it revised up its inflation projections, adding that there are upside risks to wage growth, as the labour market remains tight. The statement, therefore, reinforced the idea that a pause in the RBA’s tightening cycle remains pretty far for the time being.
AUD/USD faces an immediate up barrier at the weekly peak at 0.7011 (February 9) ahead of the 2023 high at 0.7157 (February 2). North from here emerges the round level at 0.7200 prior to the June 2022 top at 0.7282 (June 3). The other way around, sellers are expected to meet the next support at the February low at 0.6855 (February 6), which remains bolstered by the 55-day SMA (0.6857). The breach of this level could open the door to a probable visit to the key 200-day SMA at 0.6803 before the 2023 low at 0.6688 (January 3) and the December 2022 low at 0.6629 (December 20). The daily RSI eased a tad to the 48 zone.
Resistance levels: 0.6960 0.7011 0.7072 (4H chart)
Support levels: 0.6908 0.6855 0.6722 (4H chart)
GOLD
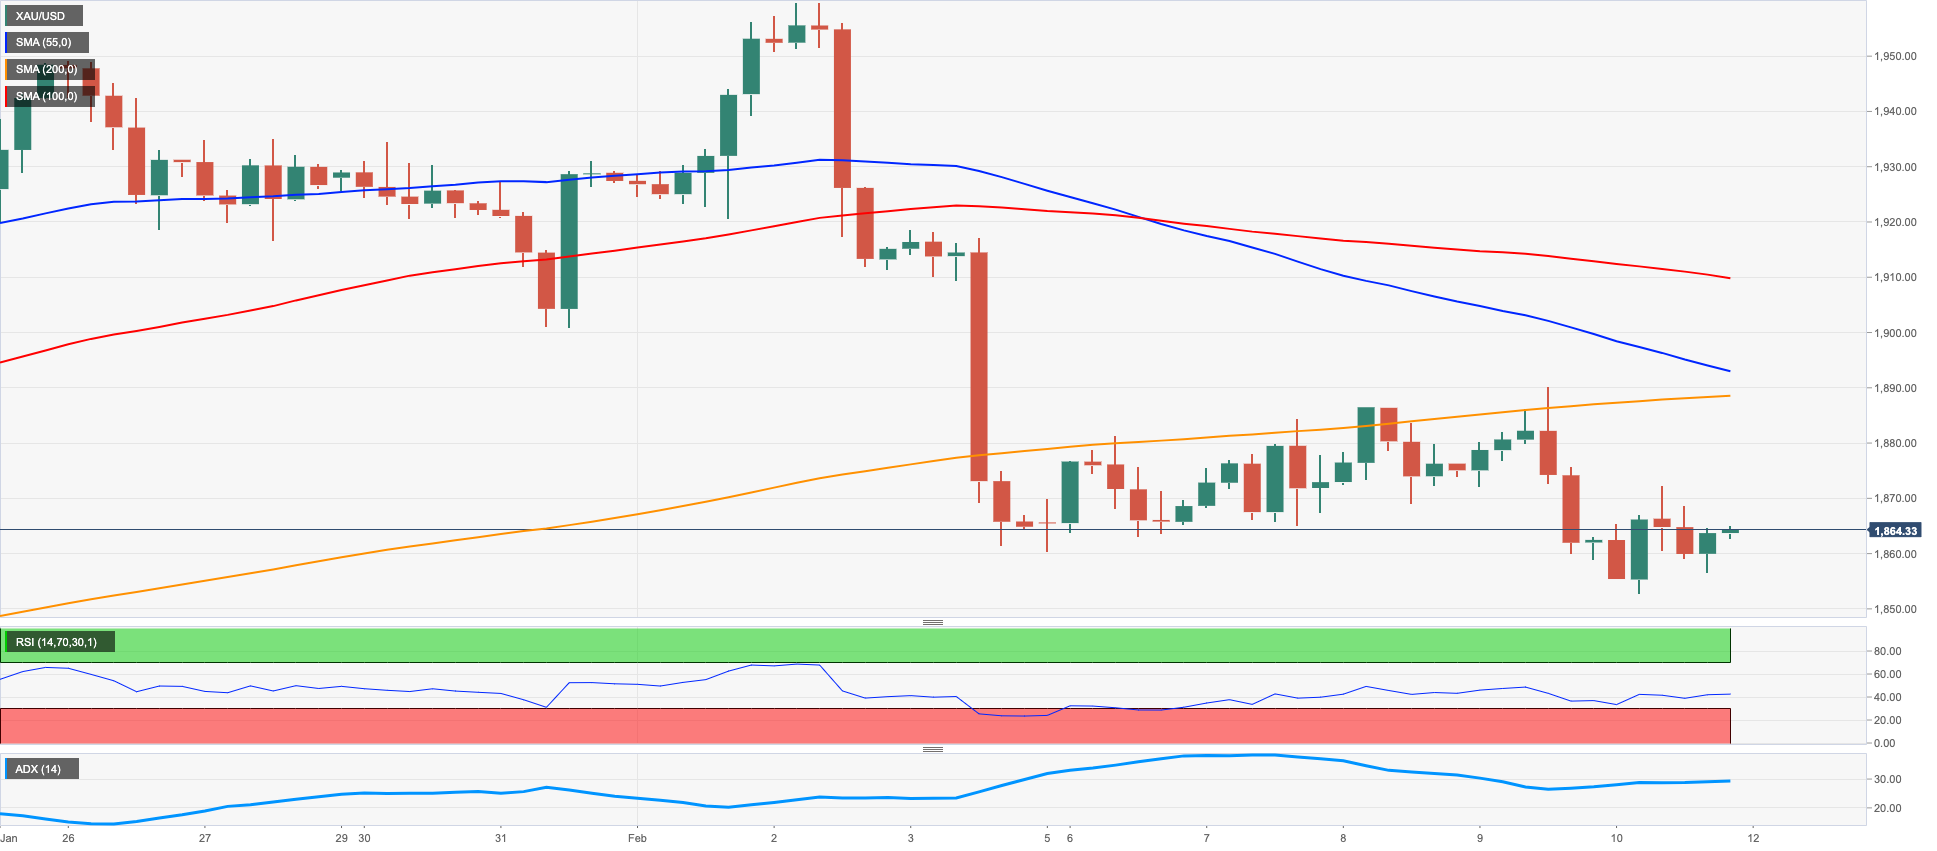
Following a drop to new 5-week lows near $1850, gold prices staged a small comeback which was enough to put the daily performance back on the positive territory, despite the week ending up marginally on the defensive.
The intense rebound in the dollar debilitated the sentiment surrounding the precious metal, while the continuation of the march north in US yields across the curve also dragged bullion lower.
Moving forward, the imminent publication of US inflation figures for the month of January (February 14) should keep the cautious tone unchanged around the yellow metal in the first half of the next week.
Gold prices came under pressure in the second half of the week and now see the next contention at the provisional 55-day SMA at $1846 seconded by the key $1800 region. The breakdown of this region could put a potential test of the 200-day SMA at $1776 on the traders’ radar closely followed by the temporary 100-day SMA at $1773 and the weekly low at $1727 (November 23). On the contrary, there is a minor hurdle at the weekly top at $1890 (February 9). Once bullion leaves this level behind, it could then attempt a move to the 2023 peak at $1959 (February 2) prior to the April 2022 high at $1998 (April 18). Soon afterwards comes the psychological $2000 mark ahead of the 2022 top at $2070 (March 8).
Resistance levels: $1872 $1885 $1910 (4H chart)
Support levels: $1852 $1825 $1797 (4H chart)
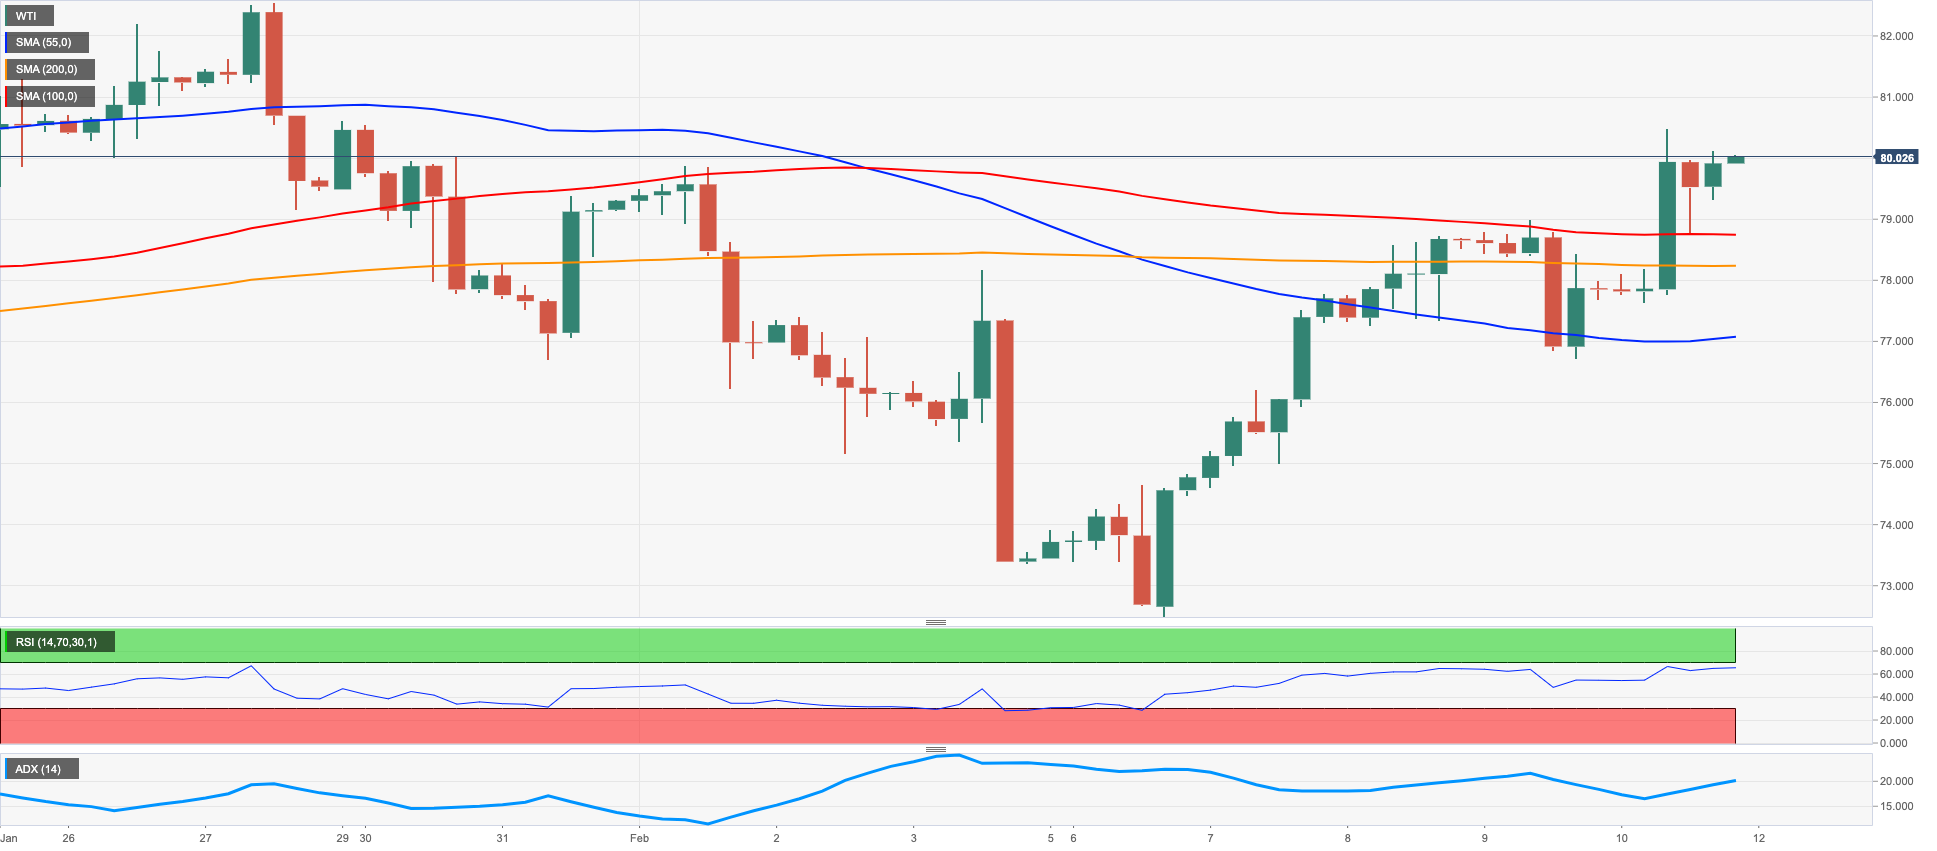
CRUDE WTI
Traders put aside recession fears, left behind concerns regarding the continuation of the tightening process by major central banks and refocused their attention on the recent announcement from Russian oil minister A.Novak, who said the country will reduce its oil output by 500 kbpd in March.
The Russian move plans to counteract the G7 price cap on Russian exports of crude oil and oil products in place since early February. The news lent extra wings to the barrel of the WTI, lifting it to new monthly highs just past the key $80.00 mark per barrel.
In the meantime, the WTI gained nearly 9% this week and managed at the same time to reverse two consecutive weeks with losses.
In the calendar, the US oil rig count went up by 10 in the week to February 10 to 609 US total active oil rigs, according to the latest report of the US drilling activity by Baker Hughes.
If WTI leaves behind the February high at $80.29 (February 10) it should quickly revisit the provisional 100-day SMA at $81.05 prior to the 2023 top at $82.60 (January 23) and the December 2022 peak at $83.32 (December 1). Once this level is cleared, the WTI could advance to the $90.08 level (November 11 2022) ahead of the 200-day SMA at $90.98. Just the opposite, the next support level of relevance aligns at the 2023 low at $72.30 (February 6) ahead of the 2022 low at $70.10 (December 9) and closely followed by the key round level at $70.00 and the weekly low at $66.15 (December 20 2021).
Resistance levels: $80.29 $82.44 $83.32 (4H chart)
Support levels: $78.13 $76.50 $74.72 (4H chart)
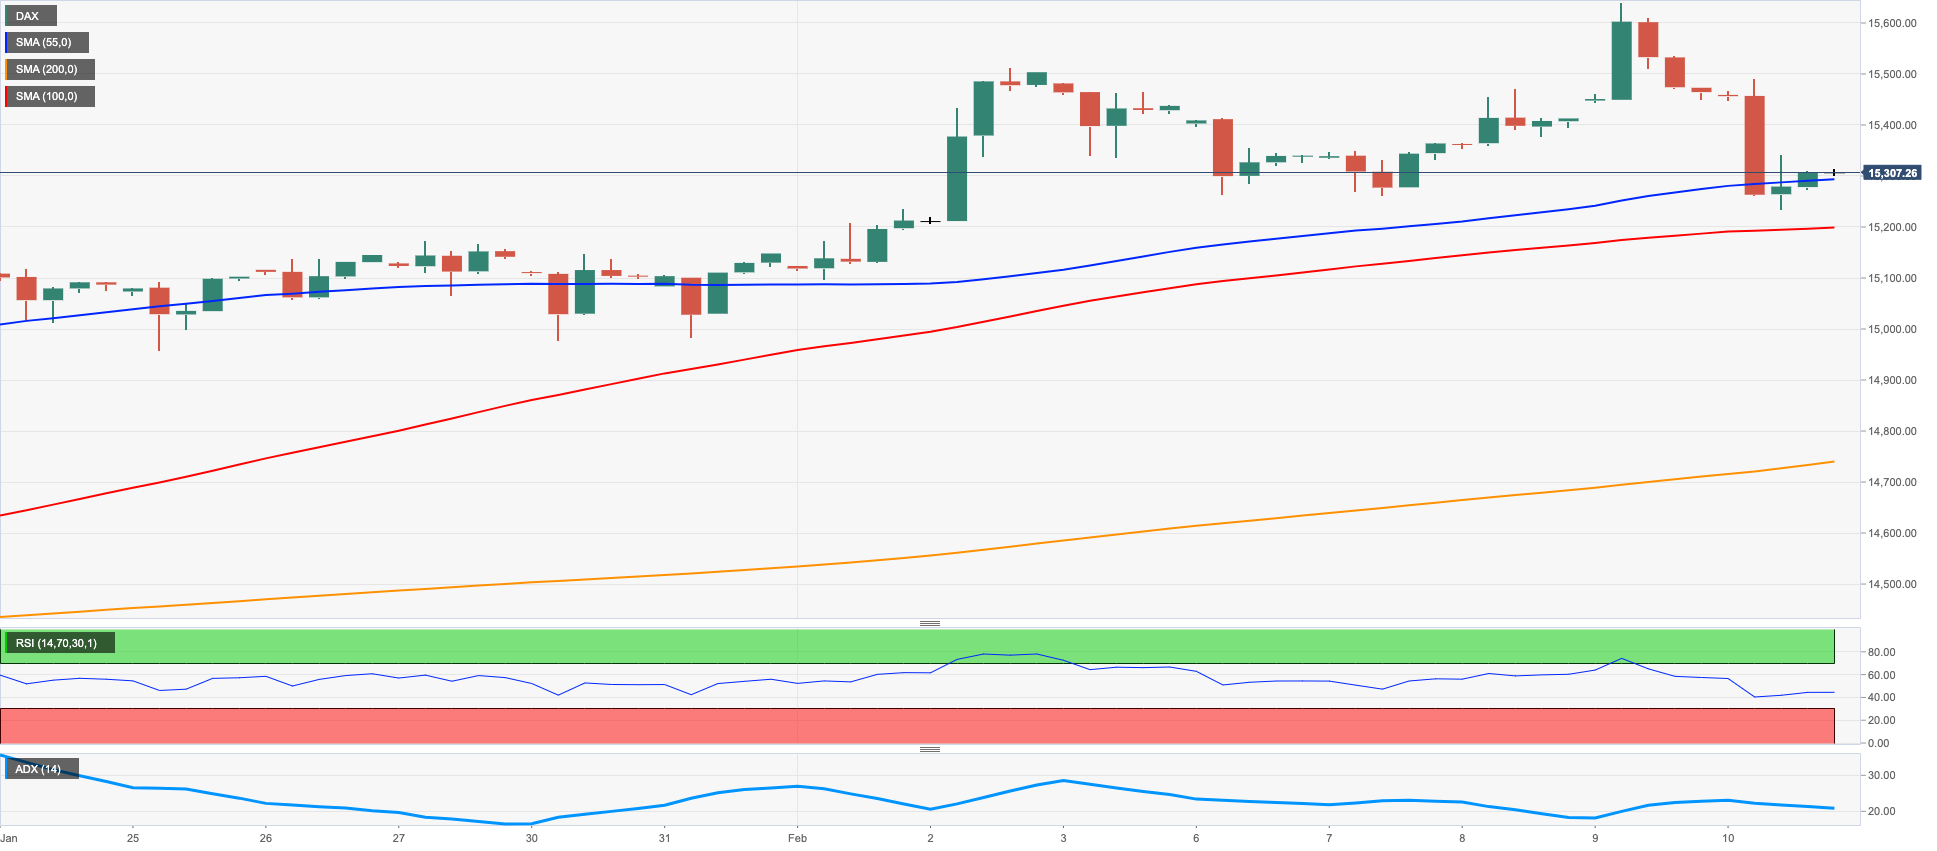
GER40
Renewed concerns over a potential economic slowdown hurt investors’ sentiment and forced European markets to give away part of the recent optimism. Those fears were exacerbated following the disheartening prints from the UK GDP and despite its economy appearing to have avoided a recession in Q4 2022.
On this, the German stock reference DAX40 set aside two straight sessions with gains and retreated to weekly lows in the 15300 region on Friday. The renewed downside pressure left the index slightly in the red territory after two weekly advances in a row.
The daily drop in the index contrasted to the resumption of the march north in the 10-year Bund yields, which once again flirted with multi-week tops near 2.40%.
In the calendar, the Current Account surplus widened to €24.3B in December (from €17.5B).
Despite the lacklustre weekly performance, the outlook for the DAX40 remains constructive for the time being. Against that, the 2023 peak at 15658 (February 2) emerges as the big magnet for bulls ahead of the February 2022 high at 15736 (February 2 2022) and the round level at 16000. The surpass of this level should pave the way for a move to the 2022 top at 16285 (January 5). In the opposite direction, the weekly low at 15246 (February 10) emerges as a minor contention level seconded by the weekly low at 14906 (January 19) and the temporary 55-day SMA at 14654. A deeper drop could put the December 2022 low at 13791 (December 20) to the test before the key 200-day SMA at 13681 and the November 2022 low at 13022 (November 3). The daily RSI deflated to the sub-60 region.
Best Performers: Fresenius Medical Care KGAA ST , Merck, E.ON SE
Worst Performers: Adidas, Zalando SE, Continental AG
Resistance levels: 15658 15736 15912 (4H chart)
Support levels: 15246 14969 14906 (4H chart)
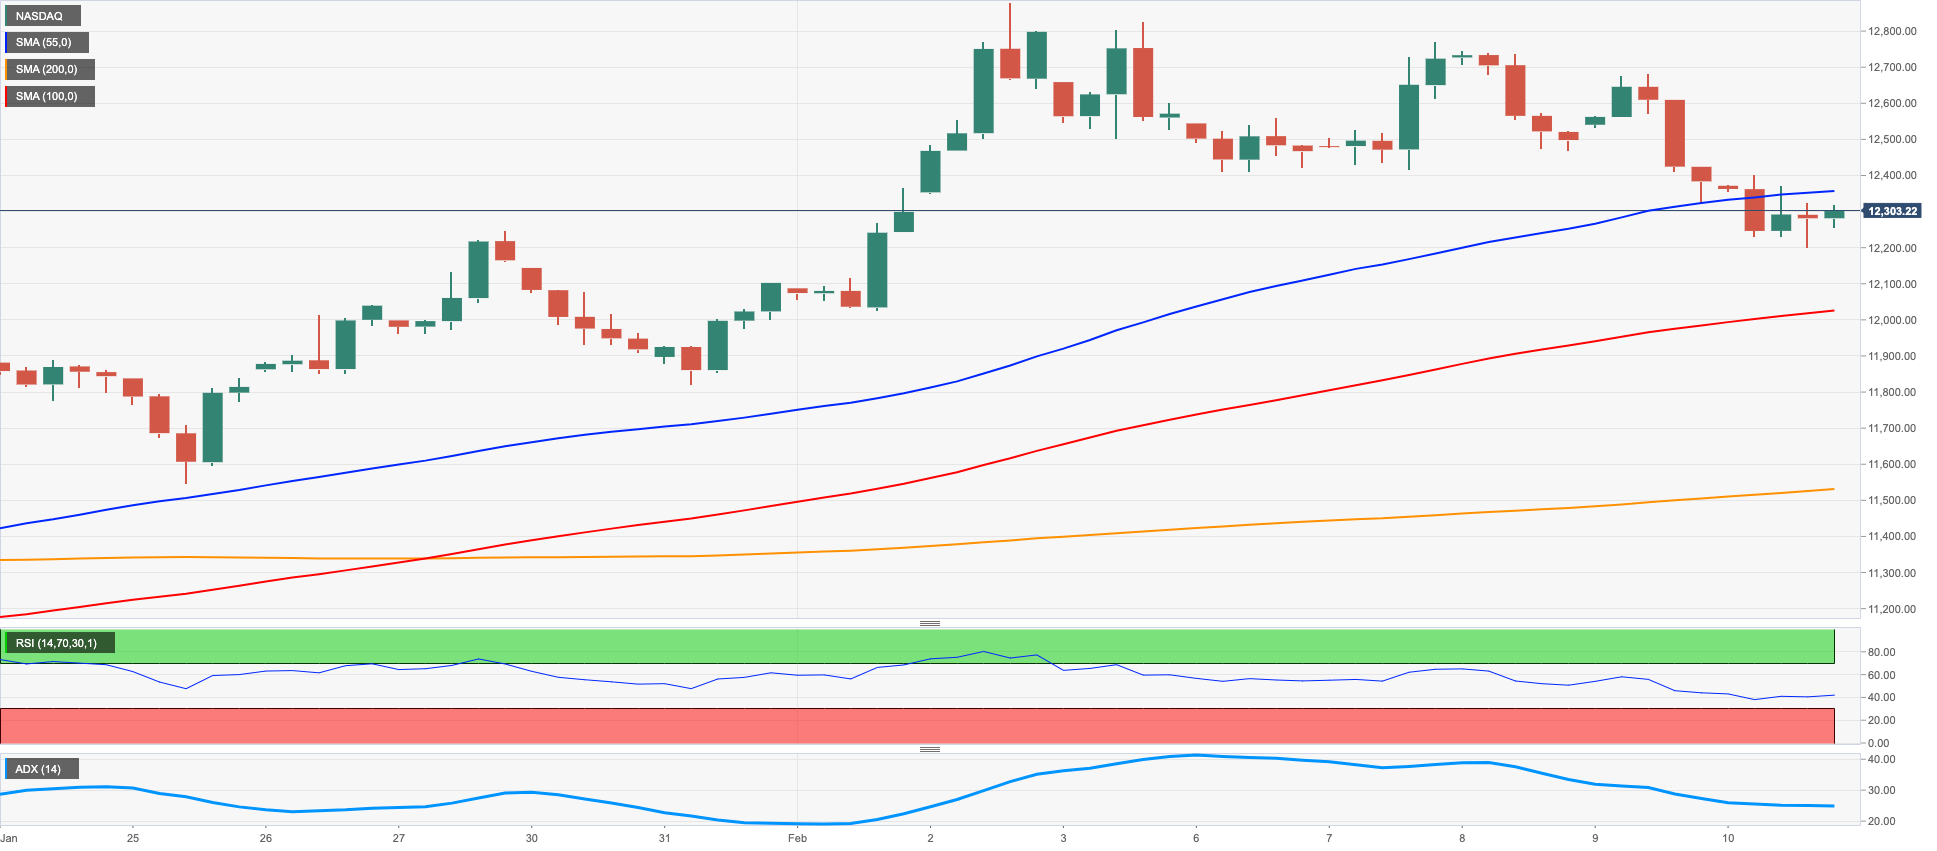
NASDAQ
Equities measured by the Nasdaq 100 added to the weekly decline and ended Friday’s session with modest losses (-0.62% to 12304). Looking at the weekly chart, the index recorded the first negative performance after five consecutive advances.
Indeed, recession fears in combination with the marked rebound in the greenback and further upside traction in US yields across the curve undermined the sentiment among market participants and maintained the offered stance unchanged in the second half of the week.
Further correction in the Nasdaq 100 is seen revisiting the key 200-day SMA at 11934 prior to weekly lows at 11550 (January 25) and 11251 (January 19). The continuation of the downtrend could see the January low at 10696 (January 6) revisited before the December 2022 low at 10671 (December 22) and the November 2022 low at 10632 (November 4). By contrast, the index needs to clear the 2023 peak at 12880 (February 2) to prompt the round level at 13000 to emerge on the horizon ahead of the weekly peak at 13175 (August 26 2022). The daily RSI eased further and flirted with the 57 level.
Top Gainers: DexCom, Diamondback, Fortinet
Top Losers: JD.com Inc Adr, Airbnb, Tesla
Resistance levels: 12771 12880 13175 (4H chart)
Support levels: 12204 11906 11550 (4H chart)
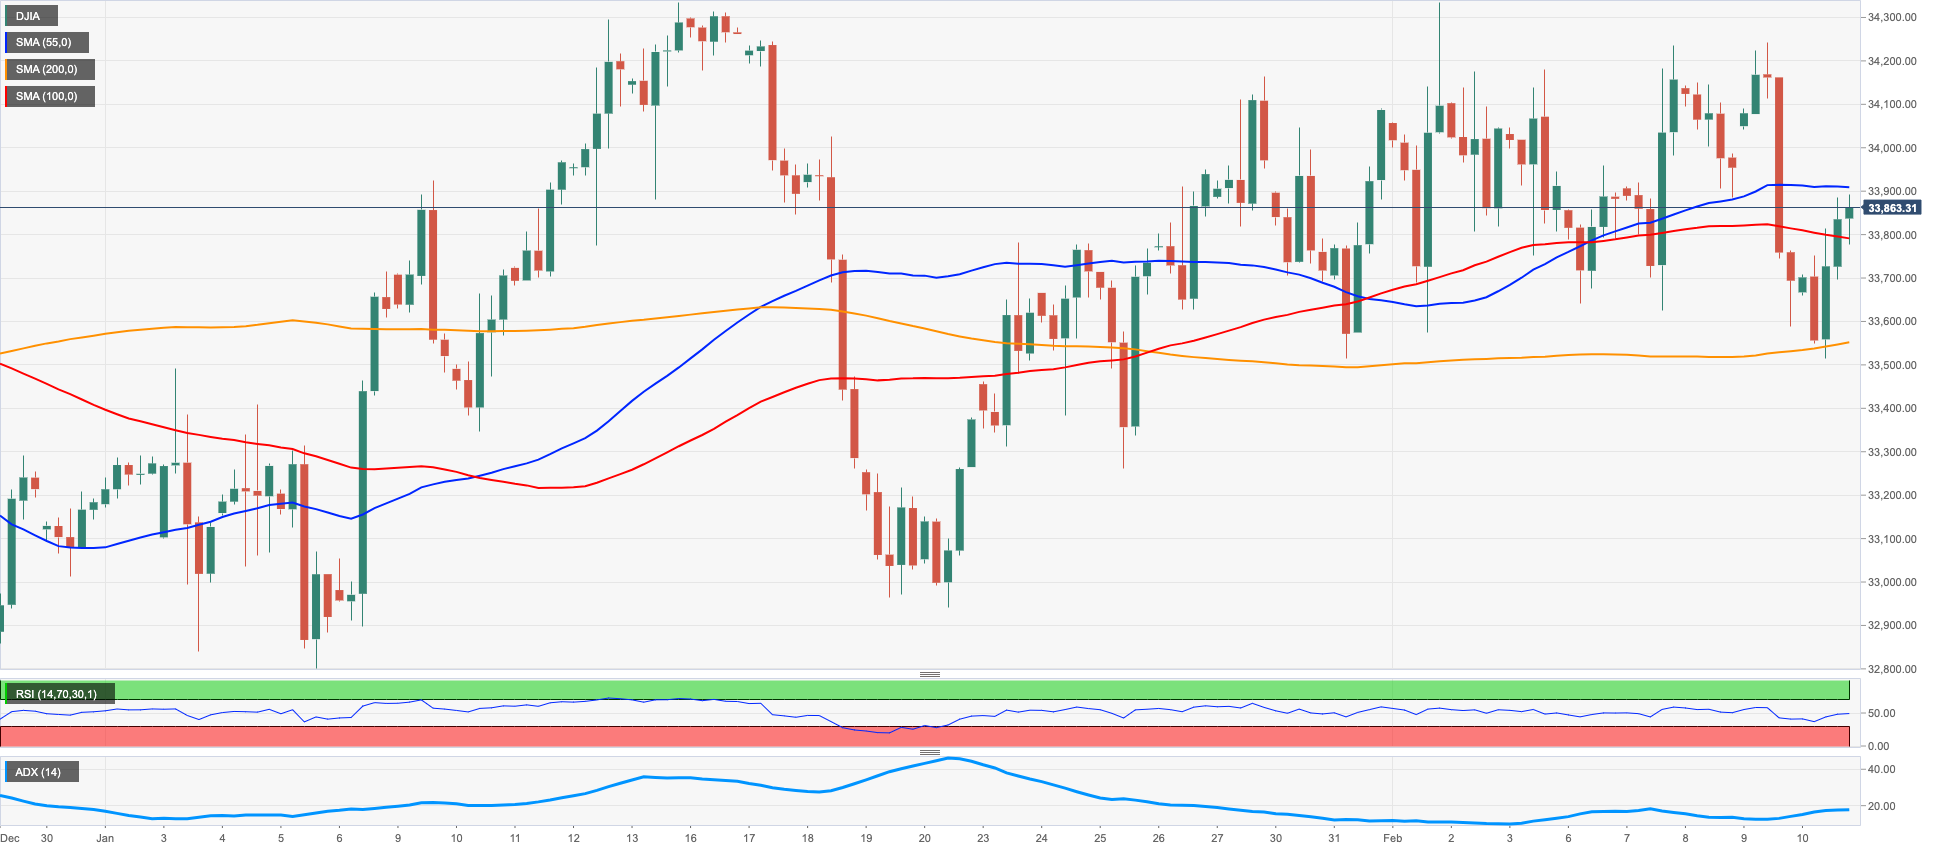
DOW JONES
The US stock benchmark Dow Jones ended Friday’s session with decent gains and added to the previous day’s advance mainly in response to the firm performance of the energy sector in light of the sharp uptick in crude oil prices.
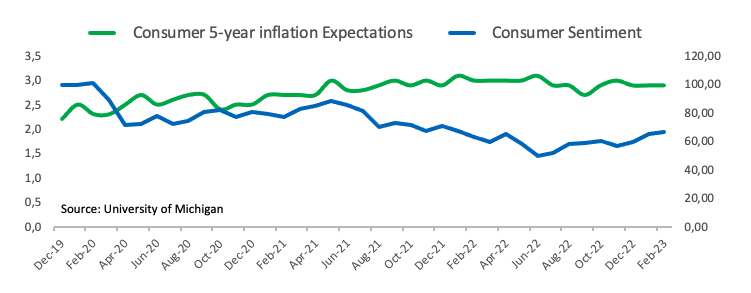
In the meantime, investors’ concerns over a longer-than-expected tightening cycle by the Federal Reserve remained all but abated for yet another week, keeping the upside potential for stocks and the risk complex in general subdued.
Somewhat supporting the above, advanced prints showed an improvement in the consumer sentiment for the current month, while inflation expectations remained unchanged in the 5-years’ time horizon.
All in all, the Dow Jones gained 0.50% to 33869, the S&P500 rose 0.22% to 4090 and the tech-heavy Nasdaq Composite dropped 0.61% to 11718.
The Dow Jones prolonged the consolidation theme on Friday. Against that, there is an initial hurdle at the weekly peak at 34334 (February 1), which appears closely followed by the 2023 high at 34342 (January 13) and the December 2022 top at 34712 (December 13). If the Dow clears this region, it could then set sail to the April 2022 peak at 35492 before the February 2022 high at 35824 (February 9). On the other hand, the next contention of relevance turns up at the weekly low at 32948 (January 20) prior to the December 2022 low at 32573 (December 22) and the key 200-day SMA at 32328.
Top Performers: Chevron, Walgreen Boots, UnitedHealth
Worst Performers: Salesforce Inc, Walt Disney, Visa A
Resistance levels: 34334 34712 35492 (4H chart)
Support levels: 33581 33273 32948 (4H chart)
MACROECONOMIC EVENTS

All Information & Updates provided by:

All information relating to the financial markets available on this page has been prepared and issued by FXStreet (Forexstreet SL, Spain, Reg: B62498233) on the basis of publicly available information and all information believed to be reliable and does not conflict with Kuwaiti local laws, and all necessary care has been taken to before the company to ensure that the facts mentioned are correct from the source.
NCM Investment nor any of its directors or employees shall in any way be held responsible for the contents of this news, and the information contained on this page is intended only to provide clients with publicly available information and should not be construed as investment advice, report or analysis and/or constitute an offer or invitation to buy or sell financial instruments of any kind.
RISK WARNING: Forex and CFDs are highly risky leveraged products, as losses can exceed deposits. Please ensure you understand all the risks and take independent advice if necessary. NCM will segregate the clients based on the criteria of the regulator and its bylaws. NCM does not provide any advisory service; the material published does not constitute advice or a recommendation for a transaction in any financial instrument. NCM accepts no responsibility for any use of the content presented and any consequences of that use. Anyone acting on the information provided does so at their own risk.