
- Contact Us:
-

-

-

-


Daily Market Updates
14 Feb 2023
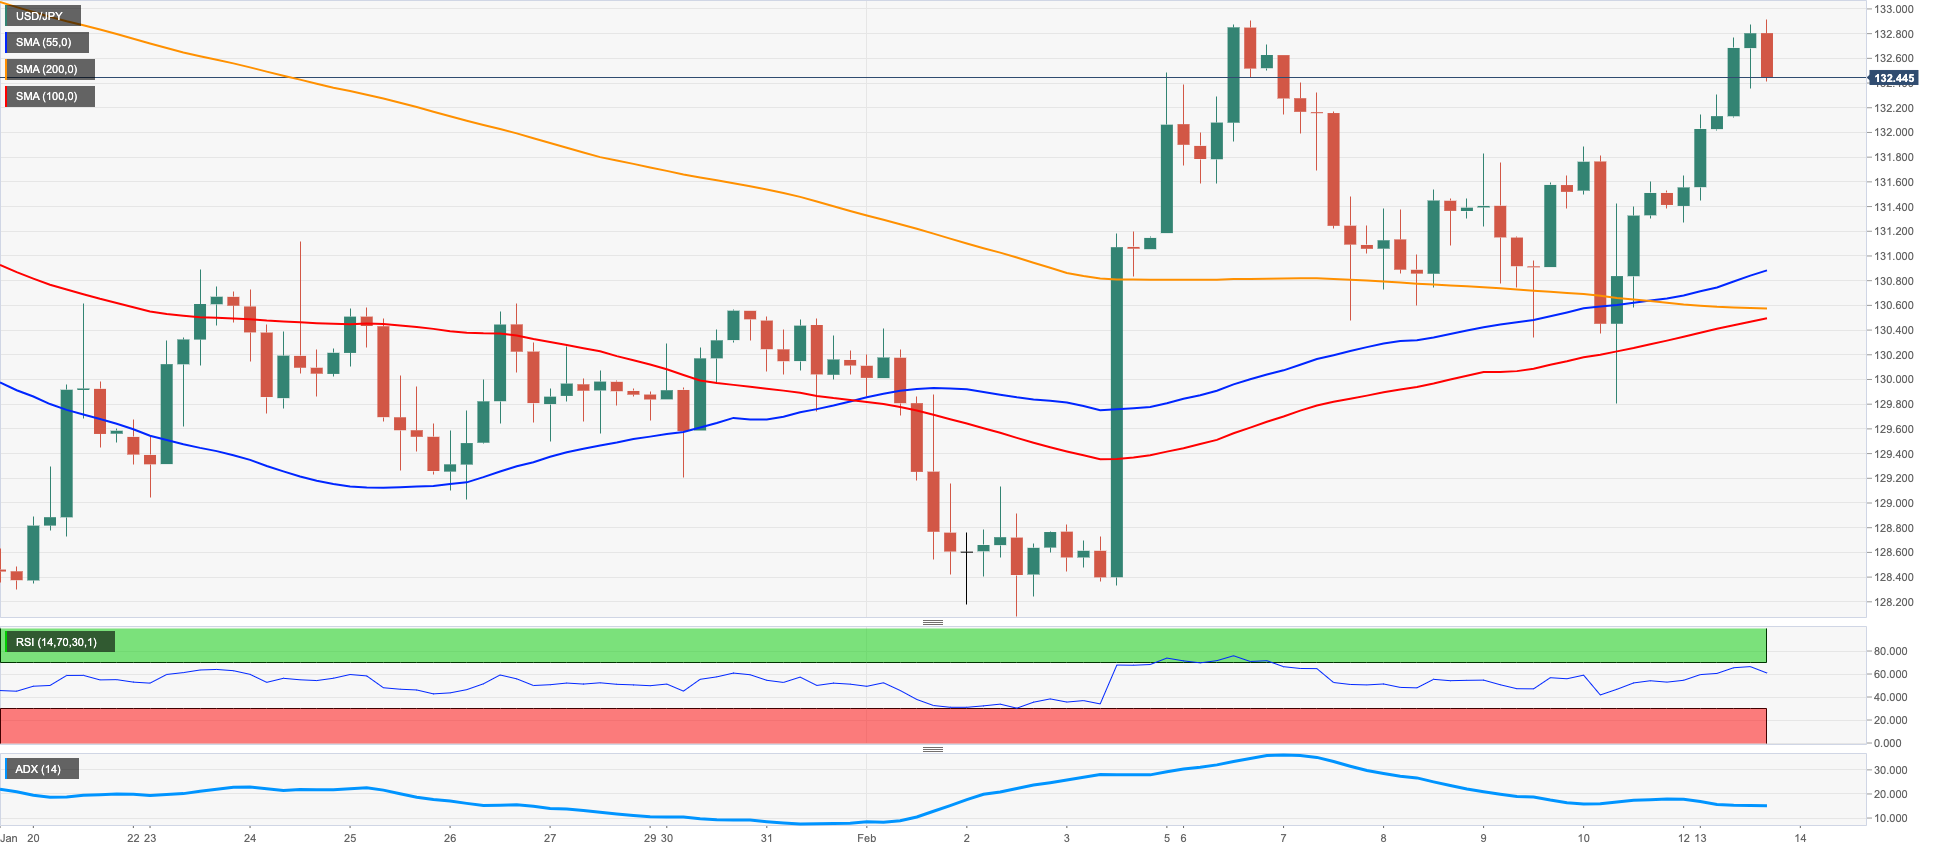
USDJPY
USD/JPY confronted monthly highs around 132.90 despite the corrective decline in the greenback and amidst the mixed performance in US yields.
On the latter, the short end of the curve extended the upside momentum to levels last seen back in late November 2022 past the 4.55% level, while the belly and the long end receded modestly.
In Japan, the JGB 10-year yields advanced past the key 0.50% YCC ceiling.
The absence of releases in the Japanese docket on Monday left all the attention to the advanced GDP figures and Industrial Production readings due on Tuesday.
The continuation of the uptrend could see USD/JPY revisit the February peak at 132.90 (February 6) ahead of the 2023 high at 134.77 (January 6). Further up comes the key 200-day SMA at 136.81 ahead of weekly tops at 138.17 (December 15 2022) and 139.89 (November 30 2022), all ahead of the key round level at 140.00. In the opposite direction, there is initial support at the weekly low at 129.79 (February 10) before the February low at 128.08 (February 2) and the 2023 low at 127.21 (January 16). The loss of the latter could put the May 2022 low at 126.36 (May 24) back on the radar ahead of the weekly low at 121.27 (March 31 2022). The daily RSI improved to the vicinity of the 56 yardstick.
Resistance levels: 132.90 134.77 137.47 (4H chart)
Support levels: 130.69 129.79 128.08 (4H chart)
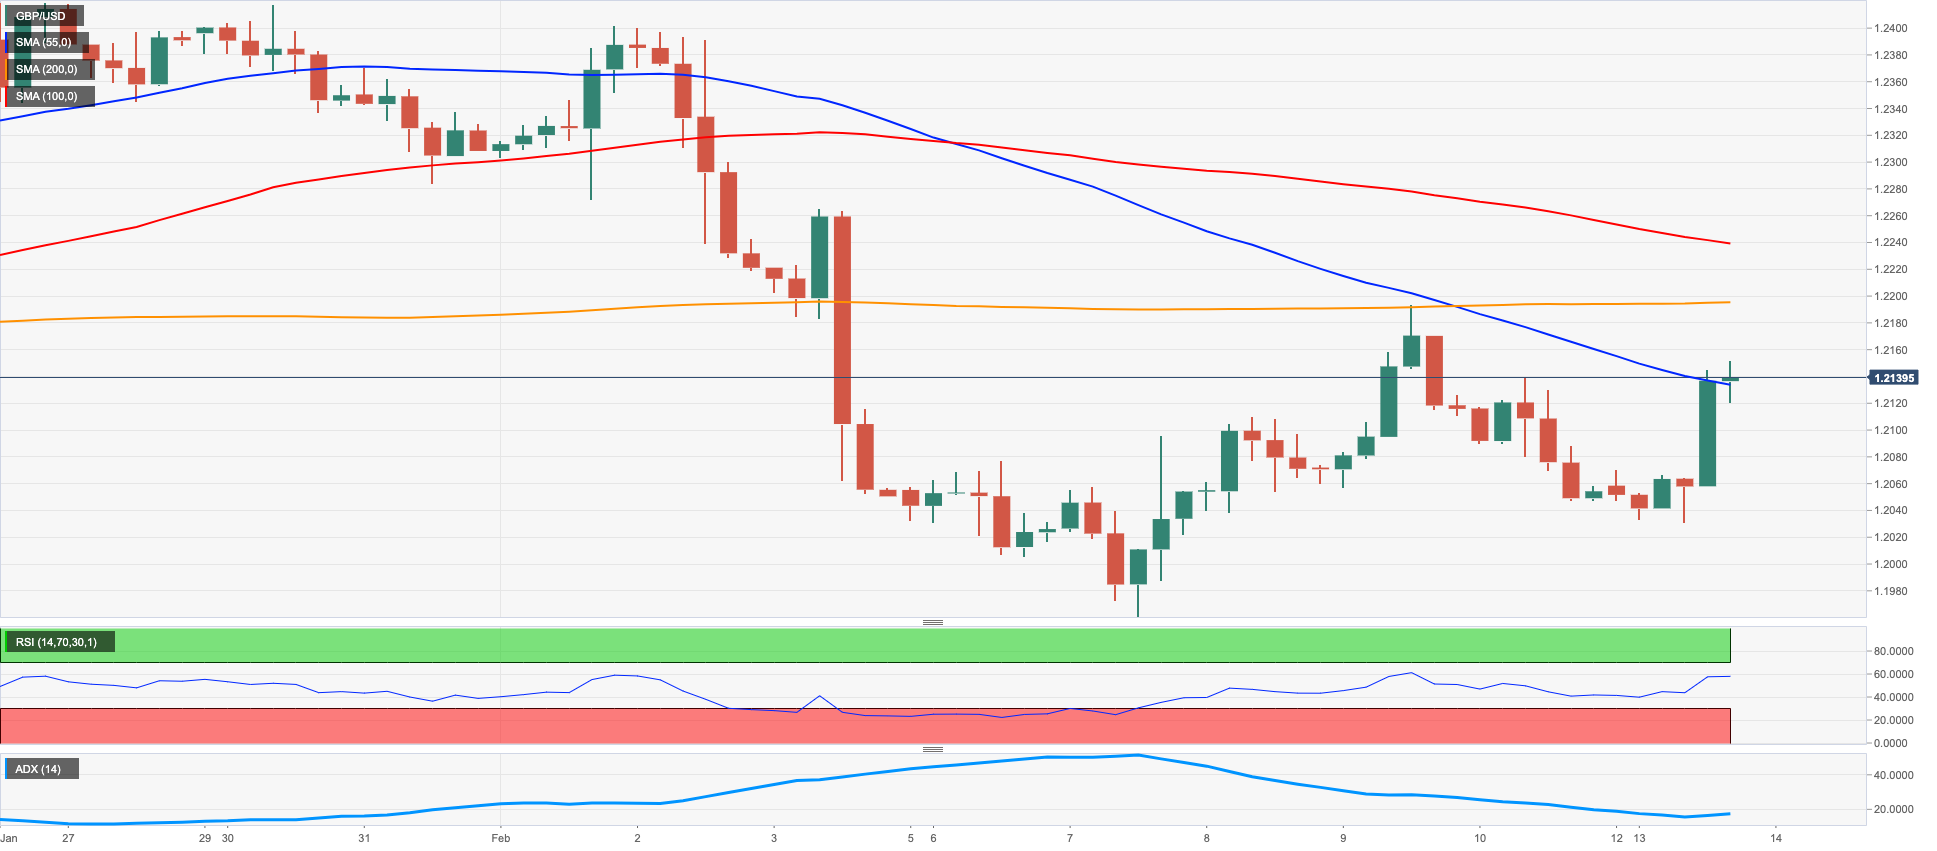
GBPUSD
GBP/USD started the week in an upbeat tone and reversed to Friday’s pullback, this time revisiting the 1.2150 region, just below last week’s tops and the 55-day SMA.
The renewed offered stance in the US dollar lent further legs to the Sterling and sponsored an auspicious Monday in Cable at the beginning of the week, while a move to multi-week highs in the UK 10-year Gilt yields also bolstered the mood around the quid.
From the BoE, MPC member J.Haskel noted that the UK inflation outlook remains unusually uncertain.
There were no data releases in the UK calendar on Monday.
If GBP/USD leaves behind the weekly high at 1.2193 (February 9) it could then challenge the 2023 top at 1.2447 (January 23) ahead of the May 2022 peak at 1.2666 (May 27). North from here emerges the key 200-week SMA at 1.2892 prior to the psychological 1.3000 yardstick. On the flip side, immediate contention turns up at the February low at 1.1960 (February 7) just before the key 200-day SMA at 1.1941. A deeper drop exposes the 100-day SMA at 1.1856 just ahead of the 2023 low at 1.1841 (January 6). The daily RSI reclaimed the area above 47.
Resistance levels: 1.2151 1.2188 1.2265 (4H chart)
Support levels: 1.2030 1.1960 1.1841 (4H chart)
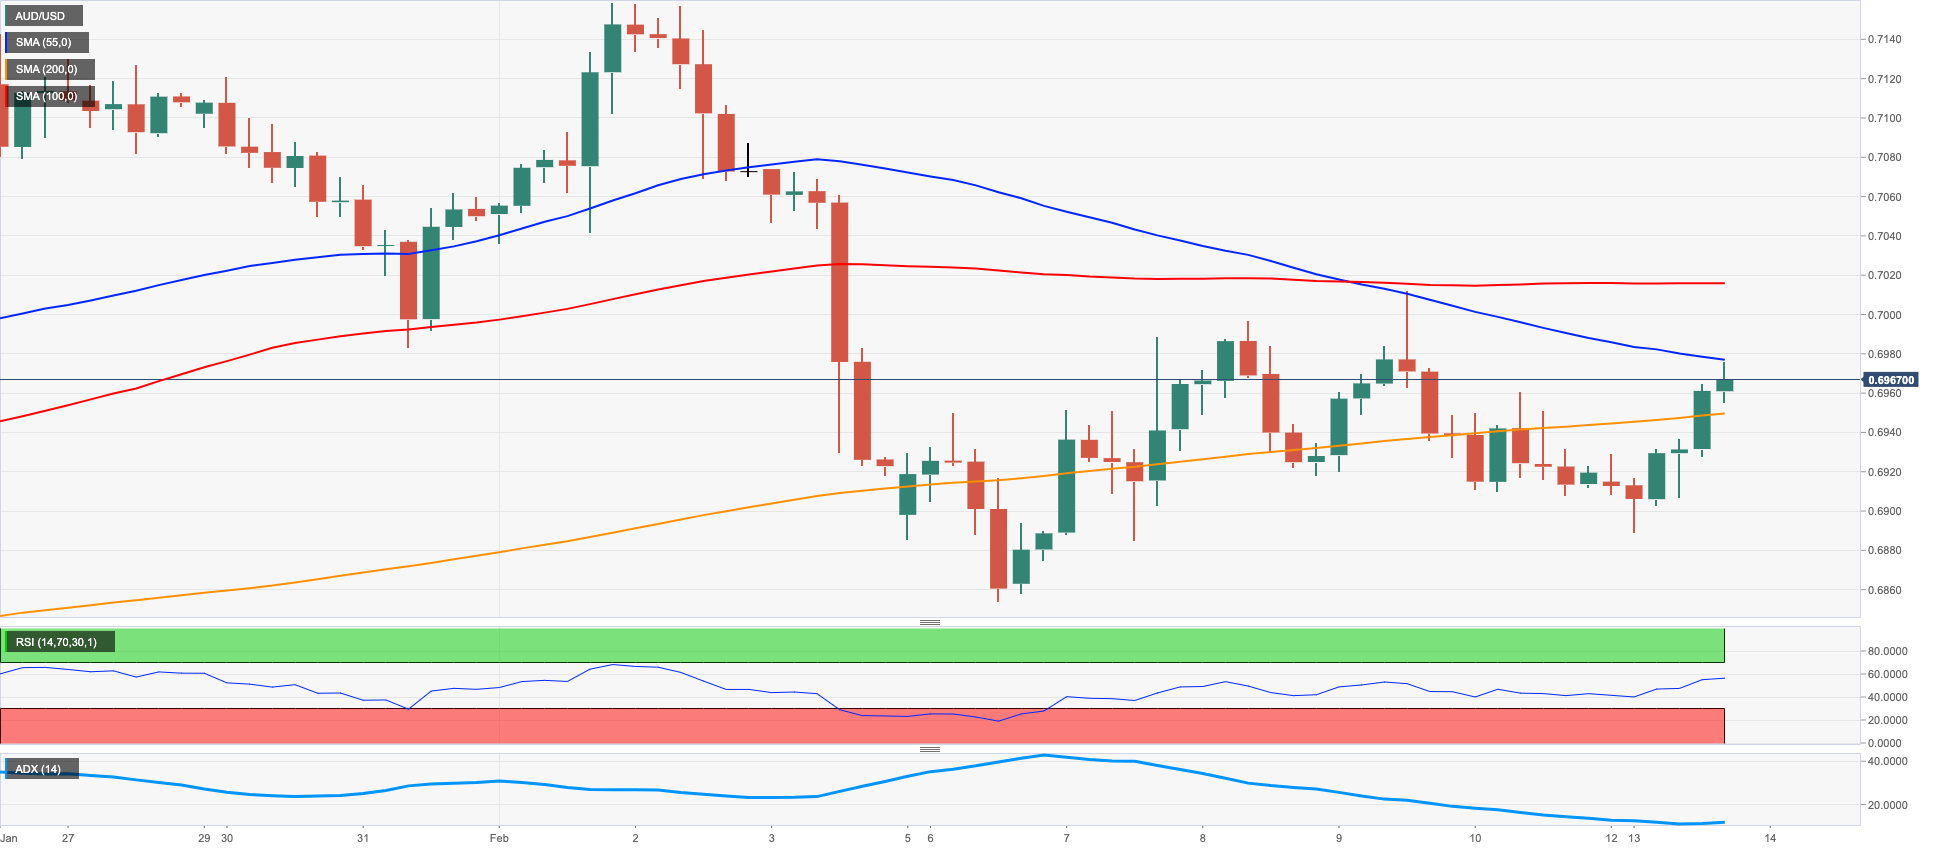
AUDUSD
Following an ephemeral drop to the sub-0.6900 region during early trade, AUD/USD managed to regain some composure and advanced to the 0.6970/75 band on Monday.
The selling pressure weighed on the greenback and this lent support to the risk-linked galaxy and the commodities in general, where both copper prices and the iron ore set aside part of the recent decline.
Nothing scheduled data wise Down Under on Monday, whereas the always relevant Consumer Confidence gauge tracked by the Westpac will take centre stage on Tuesday.
Once AUD/USD clears the weekly high at 0.7011 (February 9) it could then challenge the 2023 top at 0.7157 (February 2) ahead of the round level at 0.7200 and the June 2022 peak at 0.7282 (June 3). Having said that, the February low at 0.6855 (February 6) still appears propped up by the proximity of the temporary 55-day SMA, today at 0.6857. A deeper decline could retest the key 200-day SMA at 0.6803 ahead of the 2023 low at 0.6688 (January 3) and the December 2022 low at 0.6629 (December 20). The daily RSI bounced modestly beyond the 51 hurdle.
Resistance levels: 0.6973 0.7011 0.7072 (4H chart)
Support levels: 0.6890 0.6855 0.6722 (4H chart)
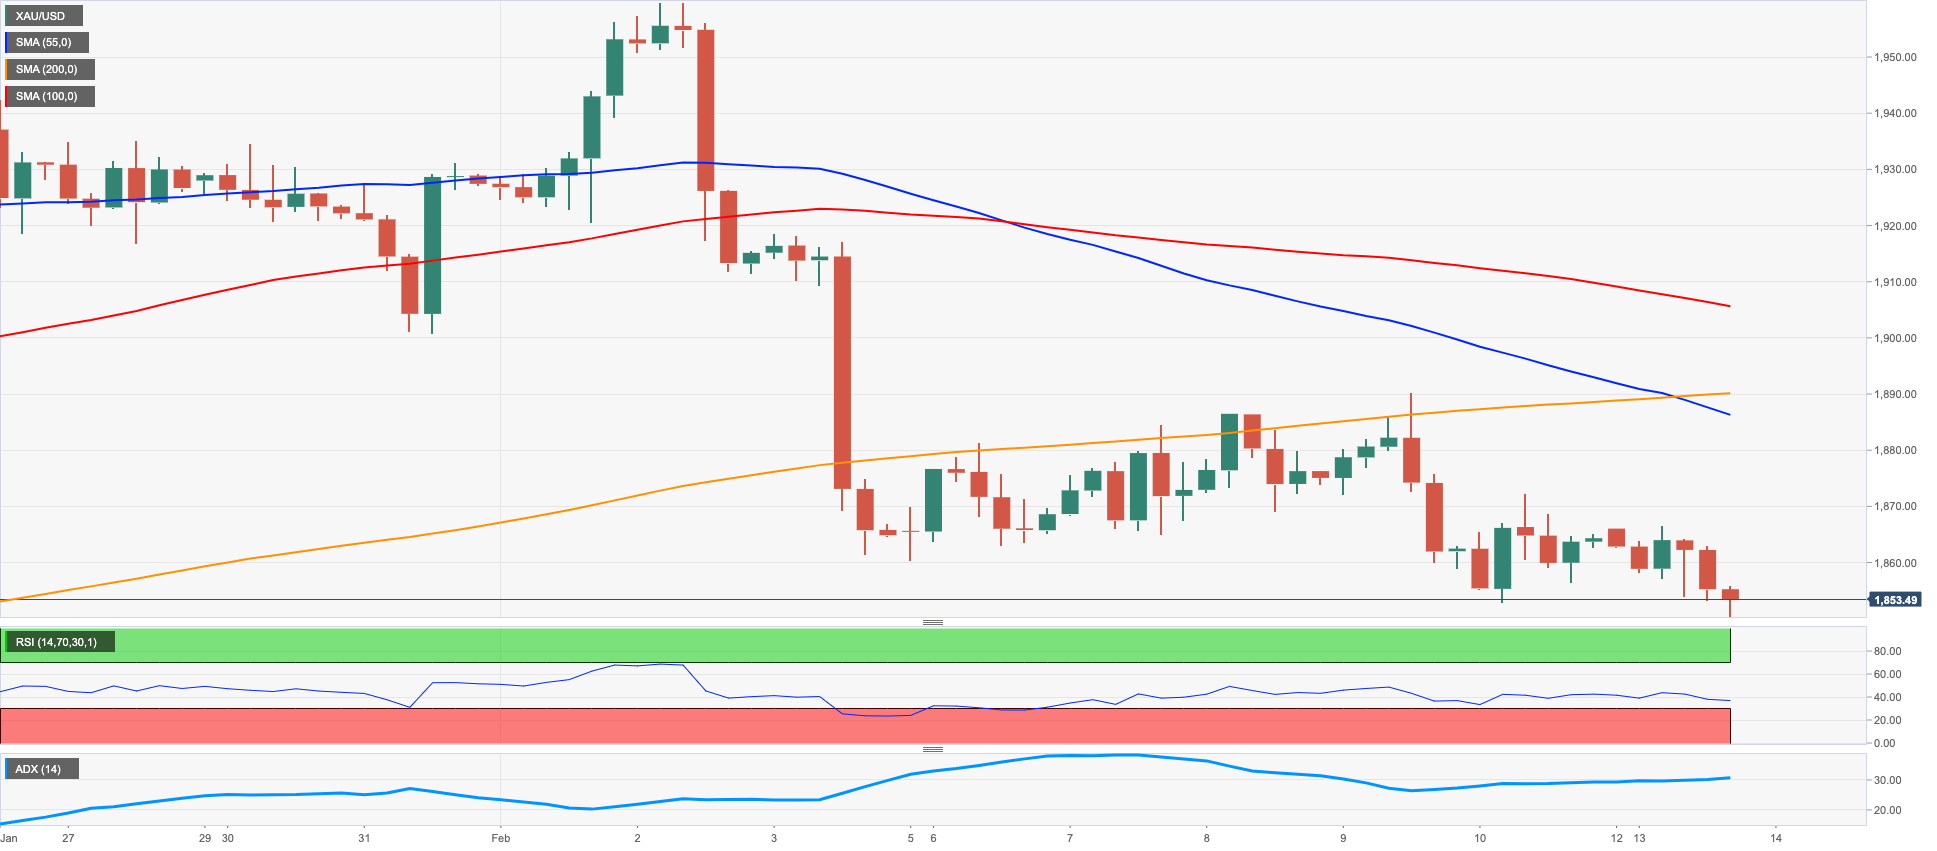
GOLD
Gold prices surrendered further ground and slipped back to the $1850 region per ounce troy, or new 6-week lows.
The resumption of the downtrend in the precious metal came despite the renewed downside pressure hurting the US dollar, although the continuation of the monthly rally in the US 2-year yields kept the price action in the yellow metal subdued at the beginning of the week.
Bullion, in the meantime, risks bouts of volatility in the next hours in light of the release of the US inflation figures tracked by the CPI on Tuesday.
Extra losses in gold could retest the temporary 55-day SMA at $1847 ahead of the key $1800 zone. Further down comes the key 200-day SMA at $1776 which looks underpinned by the interim 100-day SMA at $1775. The loss of the latter should open the door to the weekly low at $1727 (November 23). The other way around, the weekly peak at $1890 (February 9) is expected to emerge as the initial hurdle for bulls. North from here, there are no resistance levels of note until the 2023 high at $1959 (February 2) followed by the April 2022 top at $1998 (April 18), which is closely followed by the psychological $2000 level and the 2022 peak at $2070 (March 8).
Resistance levels: $1872 $1887 $1910 (4H chart)
Support levels: $1850 $1825 $1797 (4H chart)
CRUDE WTI
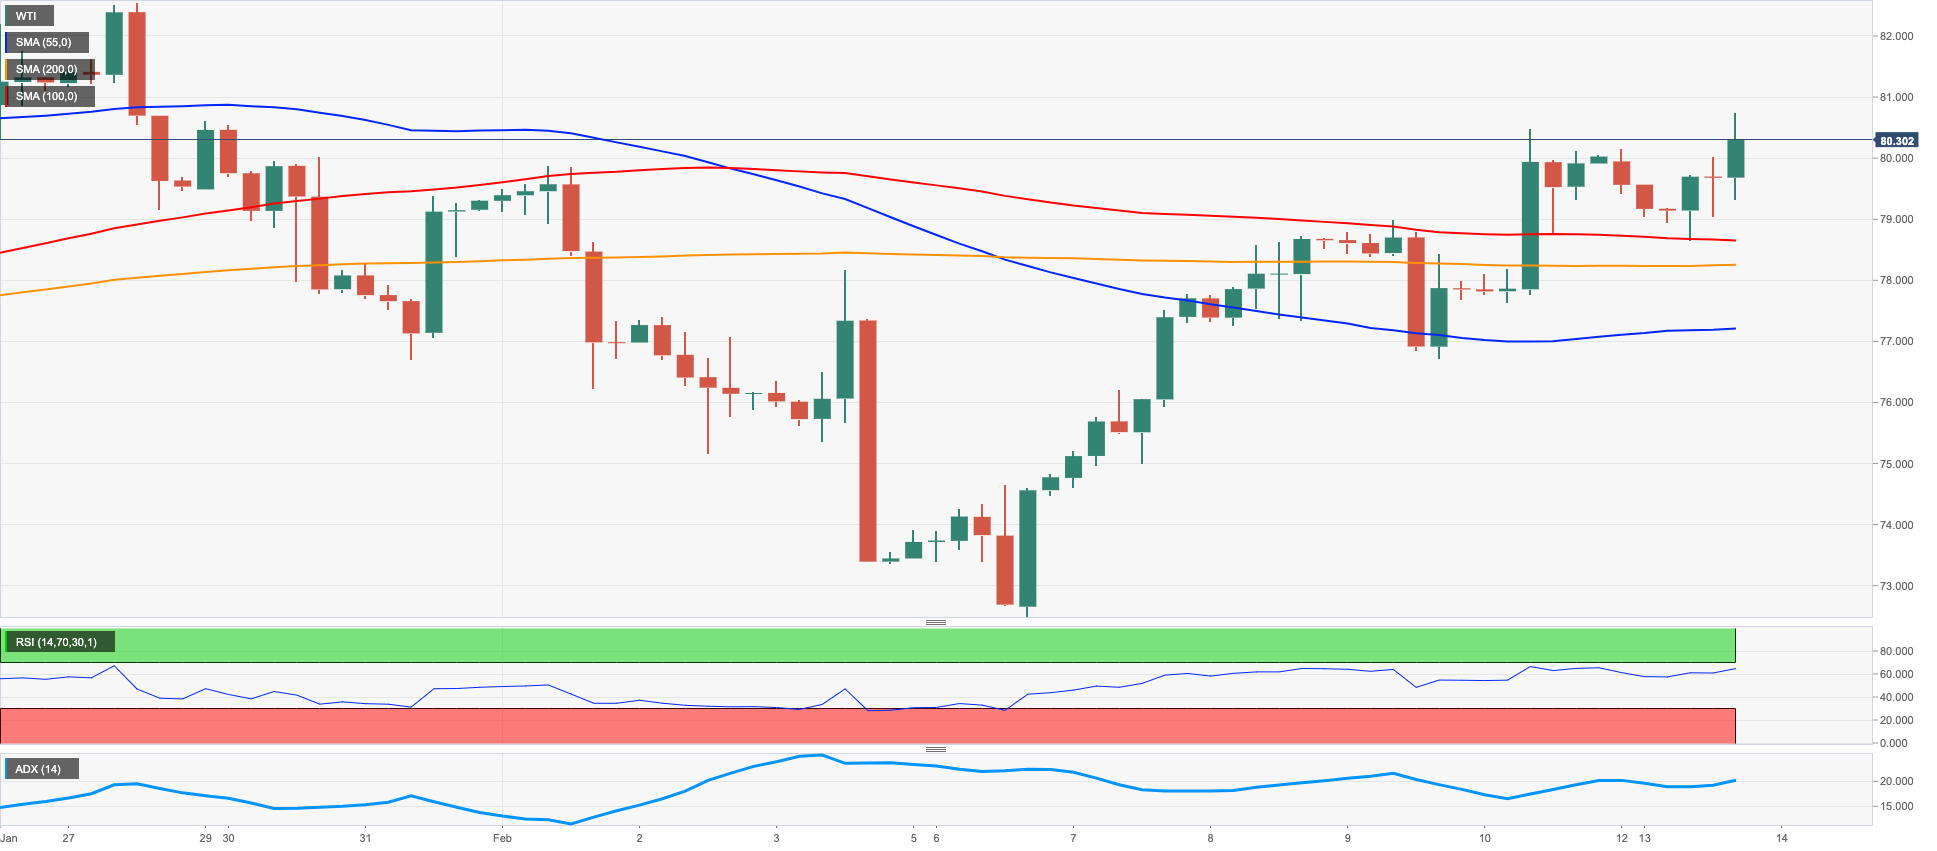
Prices of the barrel of the WTI printed fresh monthly highs past the key $80.00 mark on Monday on the back of the bearish sentiment around the greenback and rising bets on the continuation of the disinflationary trend in the US CPI, to be released on Tuesday.
In addition, the recent announcement that Russia could reduce its oil output by 500 kbpd (Friday) has been also lending some support to WTI prices.
Limiting the upside in the commodity, however, appeared some recession concerns and the gradual resumption of the activity in the port of Ceyhan in the aftermath of the earthquake.
The continuation of the upside momentum should put WTI en route to test the temporary 100-day SMA at $81.02 ahead of the 2023 peak at $82.60 (January 23) and the December 2022 high at $83.32 (December 1). The surpass of the latter exposes the $90.08 level (November 11 2022) prior to the 200-day SMA at $90.84. For all that, the interim 55-day SMA offers initial contention ahead of the 2023 low at $72.30 (February 6) and the 2022 low at $70.10 (December 9). Just above the latter comes the key round level at $70.00 followed by the weekly low at $66.15 (December 20 2021).
Resistance levels: $80.57 $82.44 $83.32 (4H chart)
Support levels: $78.41 $76.50 $74.72 (4H chart)
GER40
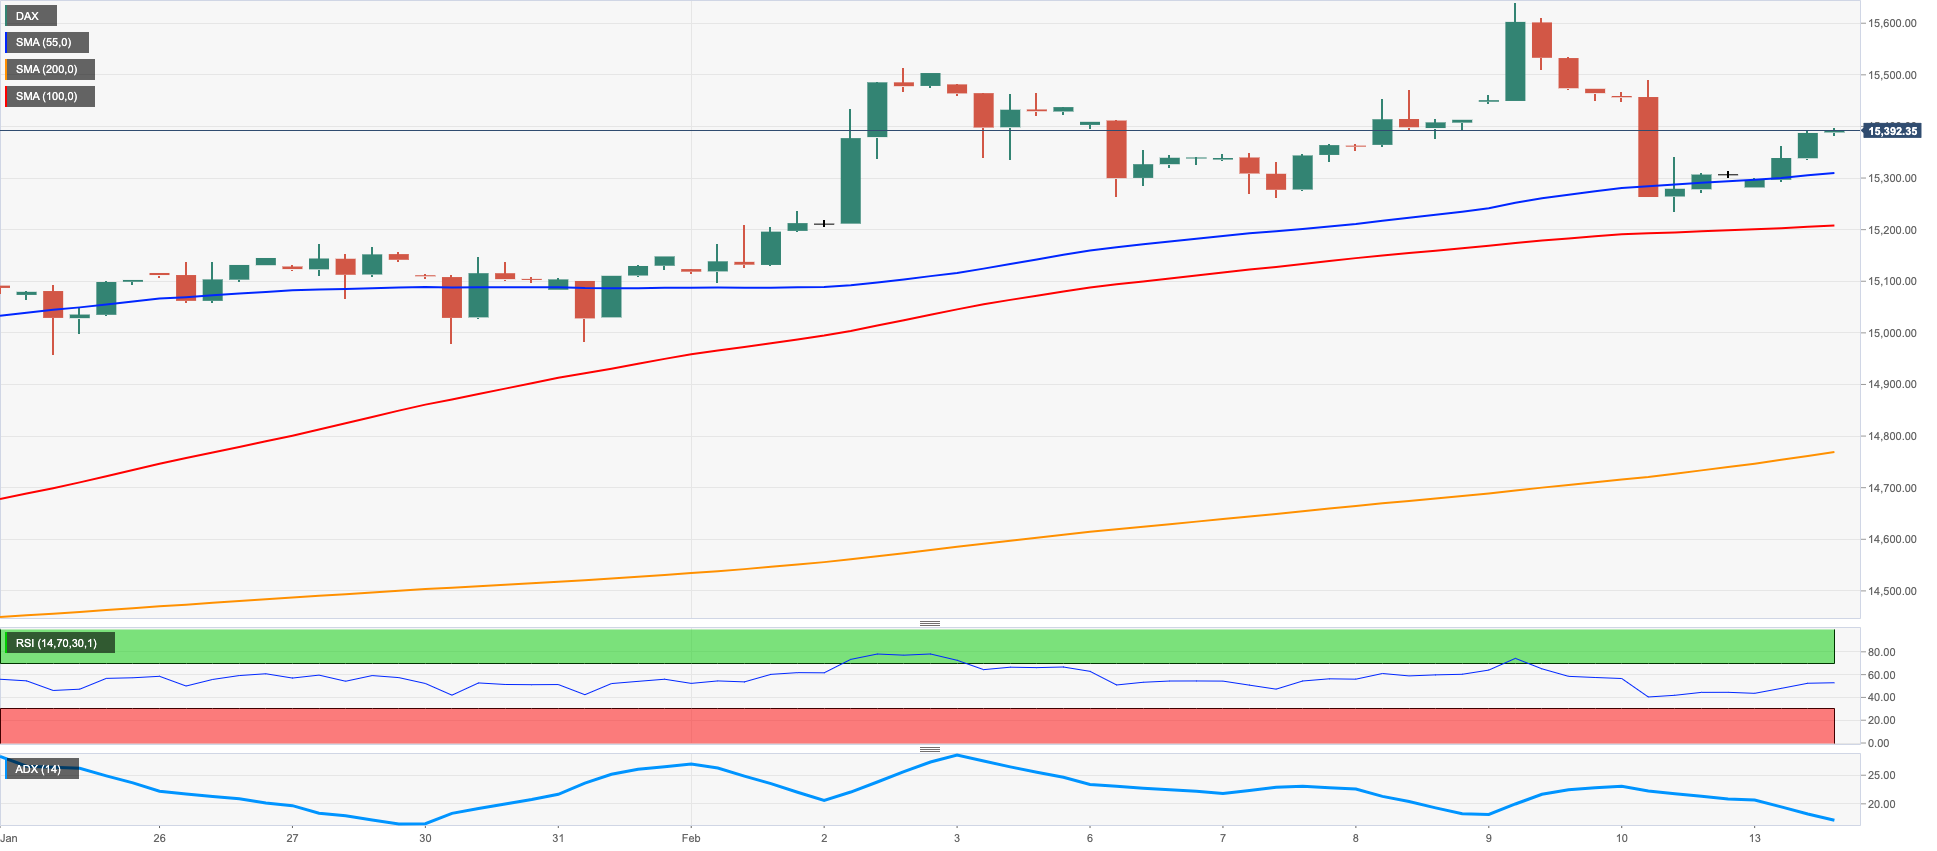
German equities gauged by the DAX40 started the week in an auspicious fashion following Friday’s retracement.
In fact, the DAX40 traded in line with the broad-based upbeat sentiment in the European markets on Monday ahead of key US data releases on Tuesday (CPI).
In addition, the recent hawkish tone from ECB speakers appeared somewhat mitigated following comments from Board members de Guindos and Centeno, which ultimately underpinned the bid bias in stocks.
The daily uptick in the index came amidst a vacillating session in the German 10-year Bund yields, which remained below the 2.40% level.
The DAX40 continues to face the next up barrier at the 2023 high at 15658 (February 9) ahead of the February 2022 top at 15736 (February 2 2022) and the round level at 16000. North from here comes the 2022 peak at 16285 (January 5). On the other hand, there is a decent support at the weekly low at 15246 (February 10) before the weekly low at 14906 (January 19) and the provisional 55-day SMA at 14670. Down from here emerges the December 2022 low at 13791 (December 20) seconded by the key 200-day SMA at 13690 and the November 2022 low at 13022 (November 3). The daily RSI edged higher to the boundaries of 62.
Best Performers: Beiersdorf AG, Sartorius AG VZO, Fresenius Medical Care KGAA ST
Worst Performers: Covestro, Siemens Healthineers, Continental AG
Resistance levels: 15658 15736 15912 (4H chart)
Support levels: 15246 14969 14906 (4H chart)
NASDAQ
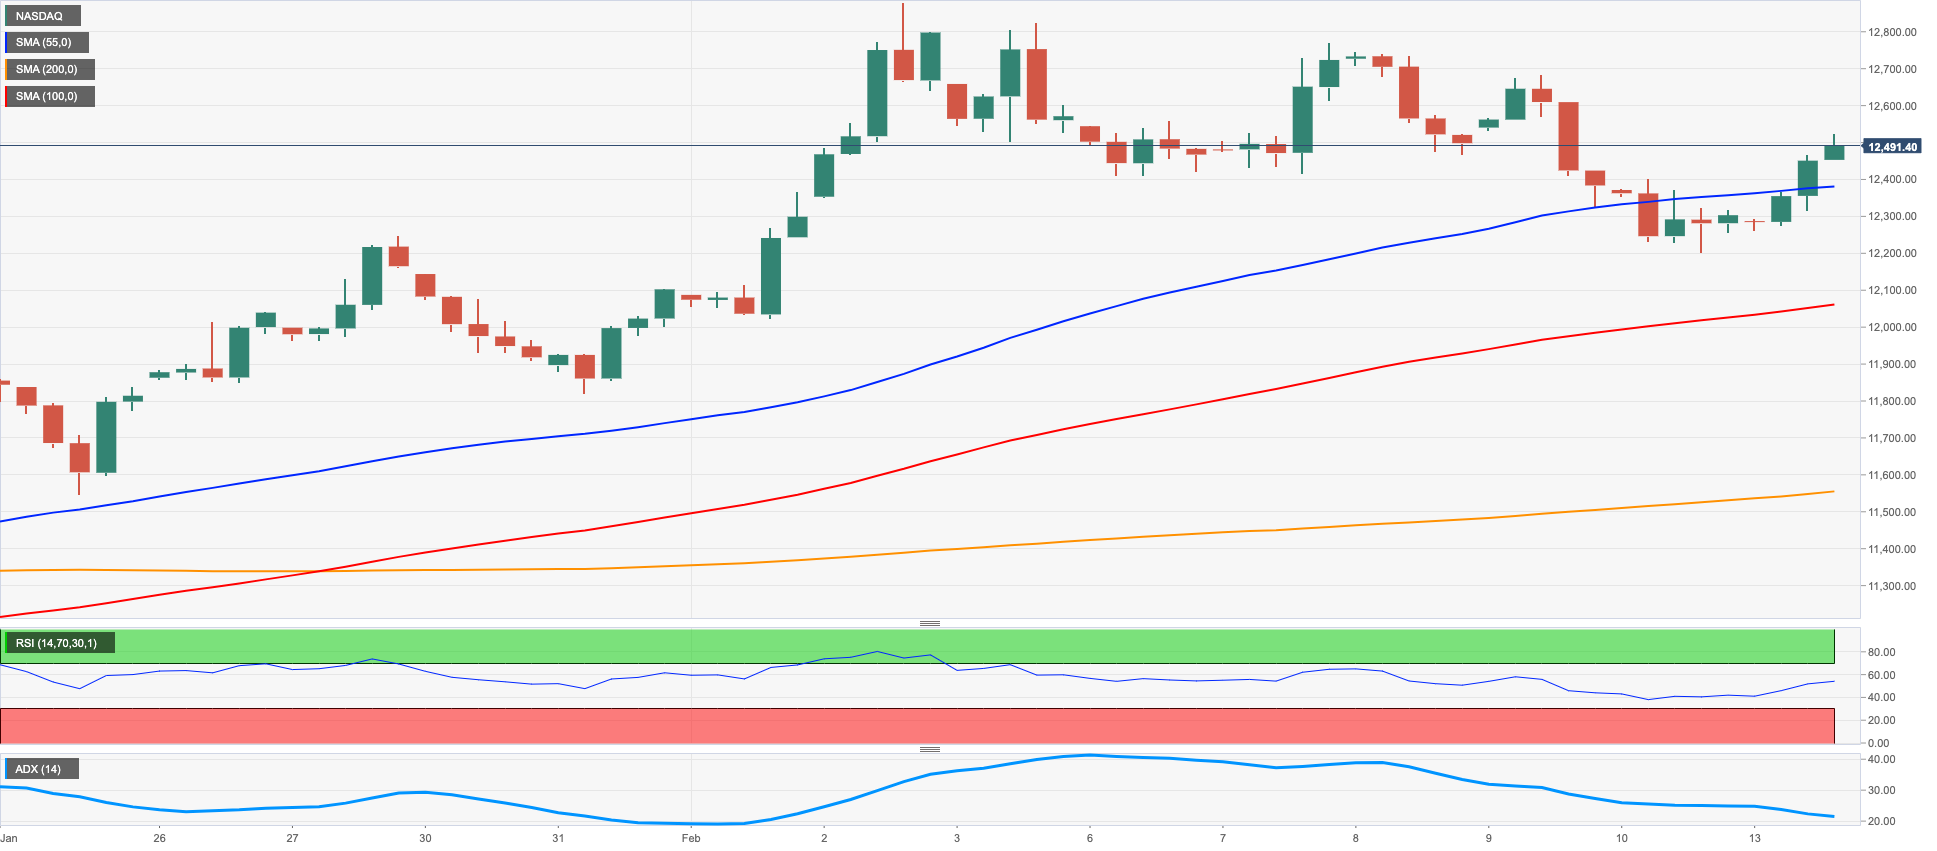
The weaker dollar in combination with declining US yields – particularly the 10-year bond - lent renewed oxygen to the tech sector and motivated the Nasdaq 100 to snap a 3-session negative streak and clock strong gains on Monday.
Furthermore, positive news from Meta Platforms and decent performances from megacaps Amazon, Microsoft and Apple among others also helped boost the traders’’ sentiment at the beginning of the week, all ahead of the release of key US CPI for the month of January (Tuesday).
Extra gains in the Nasdaq 100 are expected to retarget the 2023 high at 12880 (February 2) ahead of the round level at 13000 and the weekly peak at 13175 (August 26 2022). In the opposite direction, the weekly low at 12375 (February 10) emerges as the immediate support prior to the key 200-day SMA at 11931 and weekly lows at 11550 (January 25) and 11251 (January 19). A deeper retracement could put a test of the January low at 10696 (January 6) back on the investors’ radar ahead of the December 2022 low at 10671 (December 22) and the November 2022 low at 10632 (November 4). The daily RSI rebounded and trespassed the 60 mark.
Top Gainers: Illumina, Warner Bros Discovery Inc, Airbnb
Top Losers: Tesla, Sirius XM, PayPal Holdings Inc
Resistance levels: 12771 12880 13175 (4H chart)
Support levels: 12204 11906 11550 (4H chart)
DOW JONES
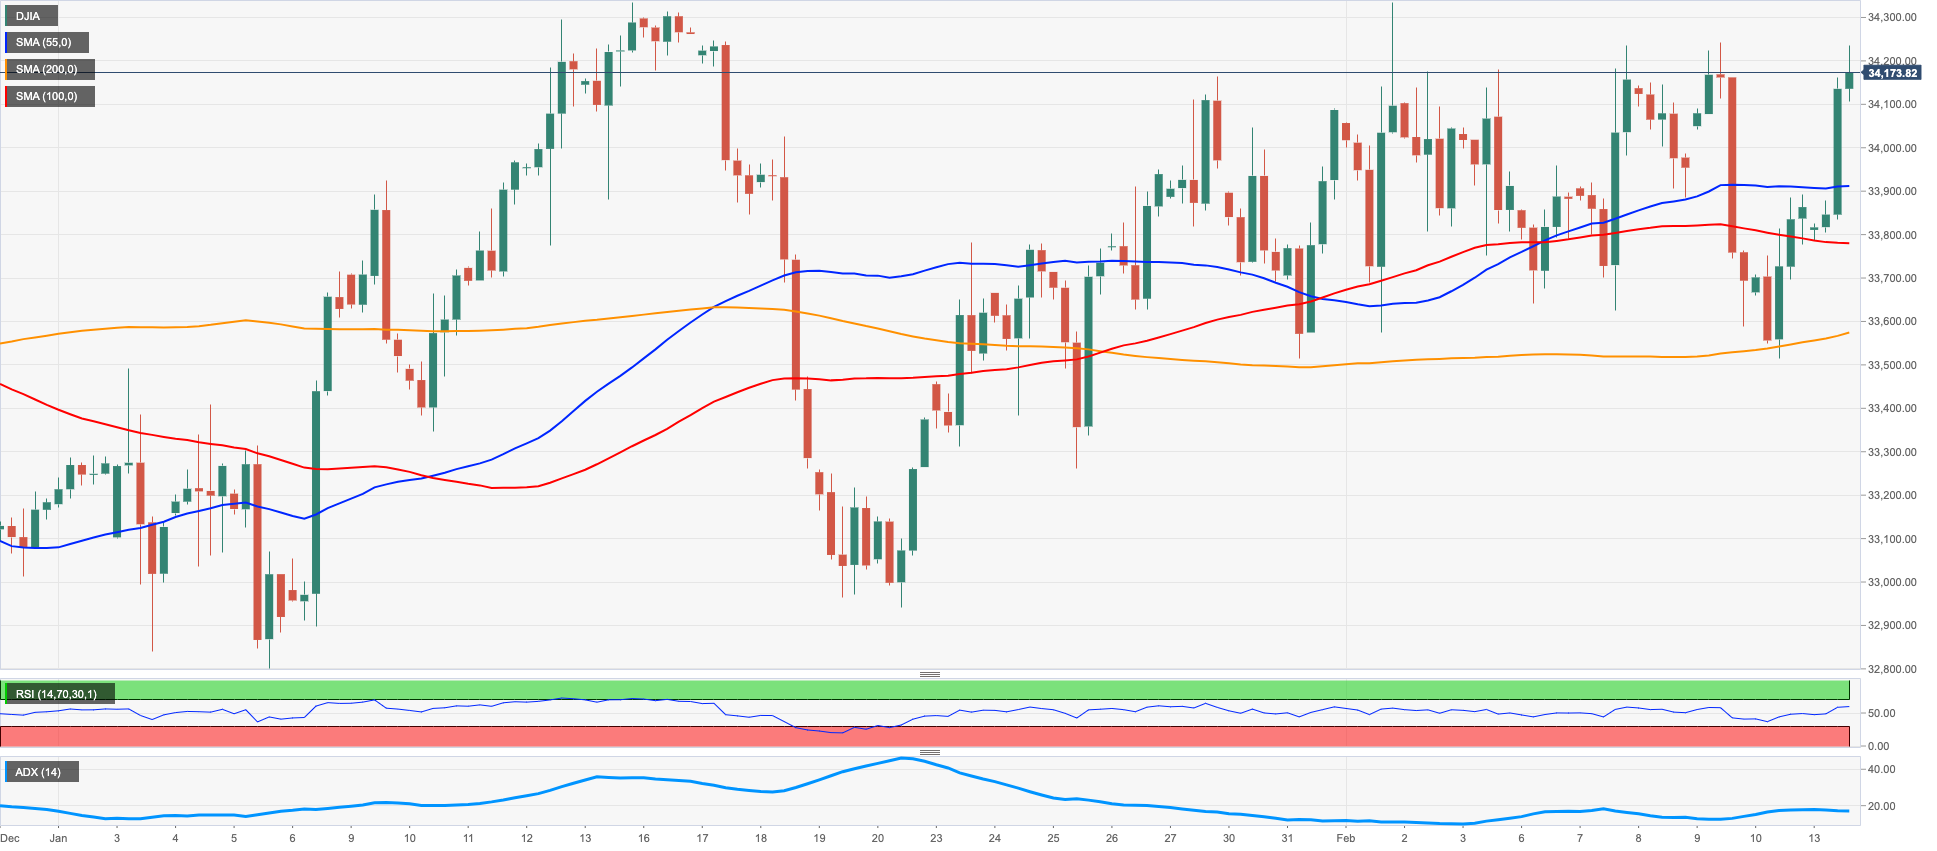
Fresh buying interest lifted spirits among market participants and encouraged US equities to extend further Friday’s rebound.
In addition, expectations of further evidence of the loss of upside traction in US consumer prices underpinned the firm performance of US stocks measured by the three major stock indices, all ahead of the publication of US inflation figures on Tuesday.
Additionally, the soft tone in the greenback coupled with declining US yields in the 10-year and 30-year benchmarks also collaborated with the upbeat mood at the beginning of the week.
On the whole, the Dow Jones gained 1.02% to 34217, the S&P500 advanced 1.12% to 4136 and the tech-reference Nasdaq Composite rose 1.51% to 11895.
Immediately to the upside for the Dow Jones now aligns the 2023 top at 34342 (January 13) followed by the December 2022 peak at 34712 (December 13). Beyond this level, the index could confront the April 2022 high at 35492 ahead of the February 2022 top at 35824 (February 9). Just the opposite, there is no contention zone of note before the weekly low at 32948 (January 20) seconded by the December 2022 low at 32573 (December 22) and ahead of the key 200-day SMA at 32333. The daily RSI edged higher and approached the 58 level.
Top Performers: Microsoft, Nike, Intel
Worst Performers: Chevron, UnitedHealth, J&J
Resistance levels: 34334 34712 35492 (4H chart)
Support levels: 33581 33273 32948 (4H chart)
MACROECONOMIC EVENTS

All Information & Updates provided by:

All information relating to the financial markets available on this page has been prepared and issued by FXStreet (Forexstreet SL, Spain, Reg: B62498233) on the basis of publicly available information and all information believed to be reliable and does not conflict with Kuwaiti local laws, and all necessary care has been taken to before the company to ensure that the facts mentioned are correct from the source.
NCM Investment nor any of its directors or employees shall in any way be held responsible for the contents of this news, and the information contained on this page is intended only to provide clients with publicly available information and should not be construed as investment advice, report or analysis and/or constitute an offer or invitation to buy or sell financial instruments of any kind.
RISK WARNING: Forex and CFDs are highly risky leveraged products, as losses can exceed deposits. Please ensure you understand all the risks and take independent advice if necessary. NCM will segregate the clients based on the criteria of the regulator and its bylaws. NCM does not provide any advisory service; the material published does not constitute advice or a recommendation for a transaction in any financial instrument. NCM accepts no responsibility for any use of the content presented and any consequences of that use. Anyone acting on the information provided does so at their own risk.