
- Contact Us:
-

-

-

-


Daily Market Updates
15 Feb 2023
USDJPY
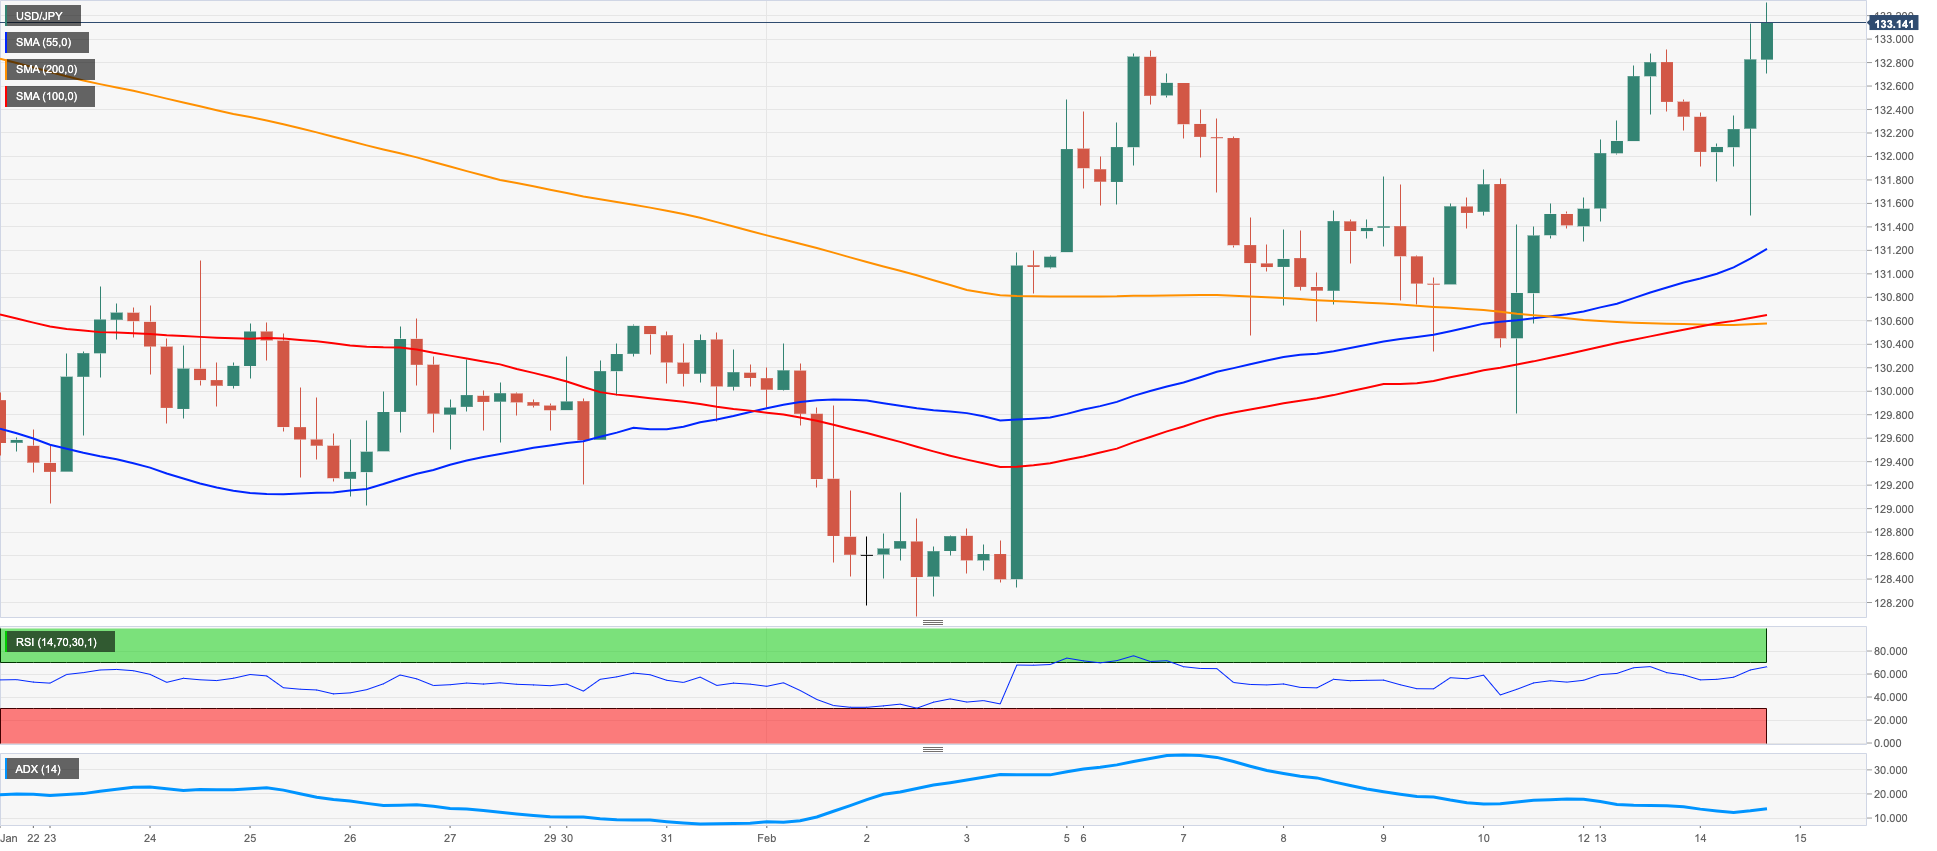
USD/JPY added to Monday’s uptick and advanced to new monthly highs in the area beyond the 133.00 barrier on Tuesday.
In fact, the post-CPI recovery in the greenback and the resumption of the move higher in US yields across the curve also contributed to the extra upside momentum in the pair. The bounce in the pair, in the meantime, came in tandem with the publication of higher-than-expected US inflation figures for the month of January.
In addition, disappointing results from the Japanese docket put the yen under pressure after the flash Q4 GDP Growth now sees the economy expanding 0.6% YoY and 0.2% QoQ. In addition, final readings showed the Industrial Production contracted 2.4% in the year to December.
On a separate note, Japan’s government announced Kazuo Ueda to succeed Hirohito Kuroda at the BoJ from April 9.
The way appears clear for USD/JPY to extend the upside to the 2023 top at 134.77 (January 6). Beyond this level the pair could retest the key 200-day SMA at 136.83 prior to weekly peaks at 138.17 (December 15 2022) and 139.89 (November 30 2022), just before the key round level at 140.00. On the flip side, the weekly low at 129.79 (February 10) is expected to turn up as a minor contention ahead of the February low at 128.08 (February 2) and the 2023 low at 127.21 (January 16). Extra losses from here should target the May 2022 low at 126.36 (May 24) prior to the weekly low at 121.27 (March 31 2022). The daily RSI climbed further and poked with the 58 region.
Resistance levels: 133.31 134.77 137.47 (4H chart)
Support levels: 131.78 130.64 129.79 (4H chart)
GBPUSD
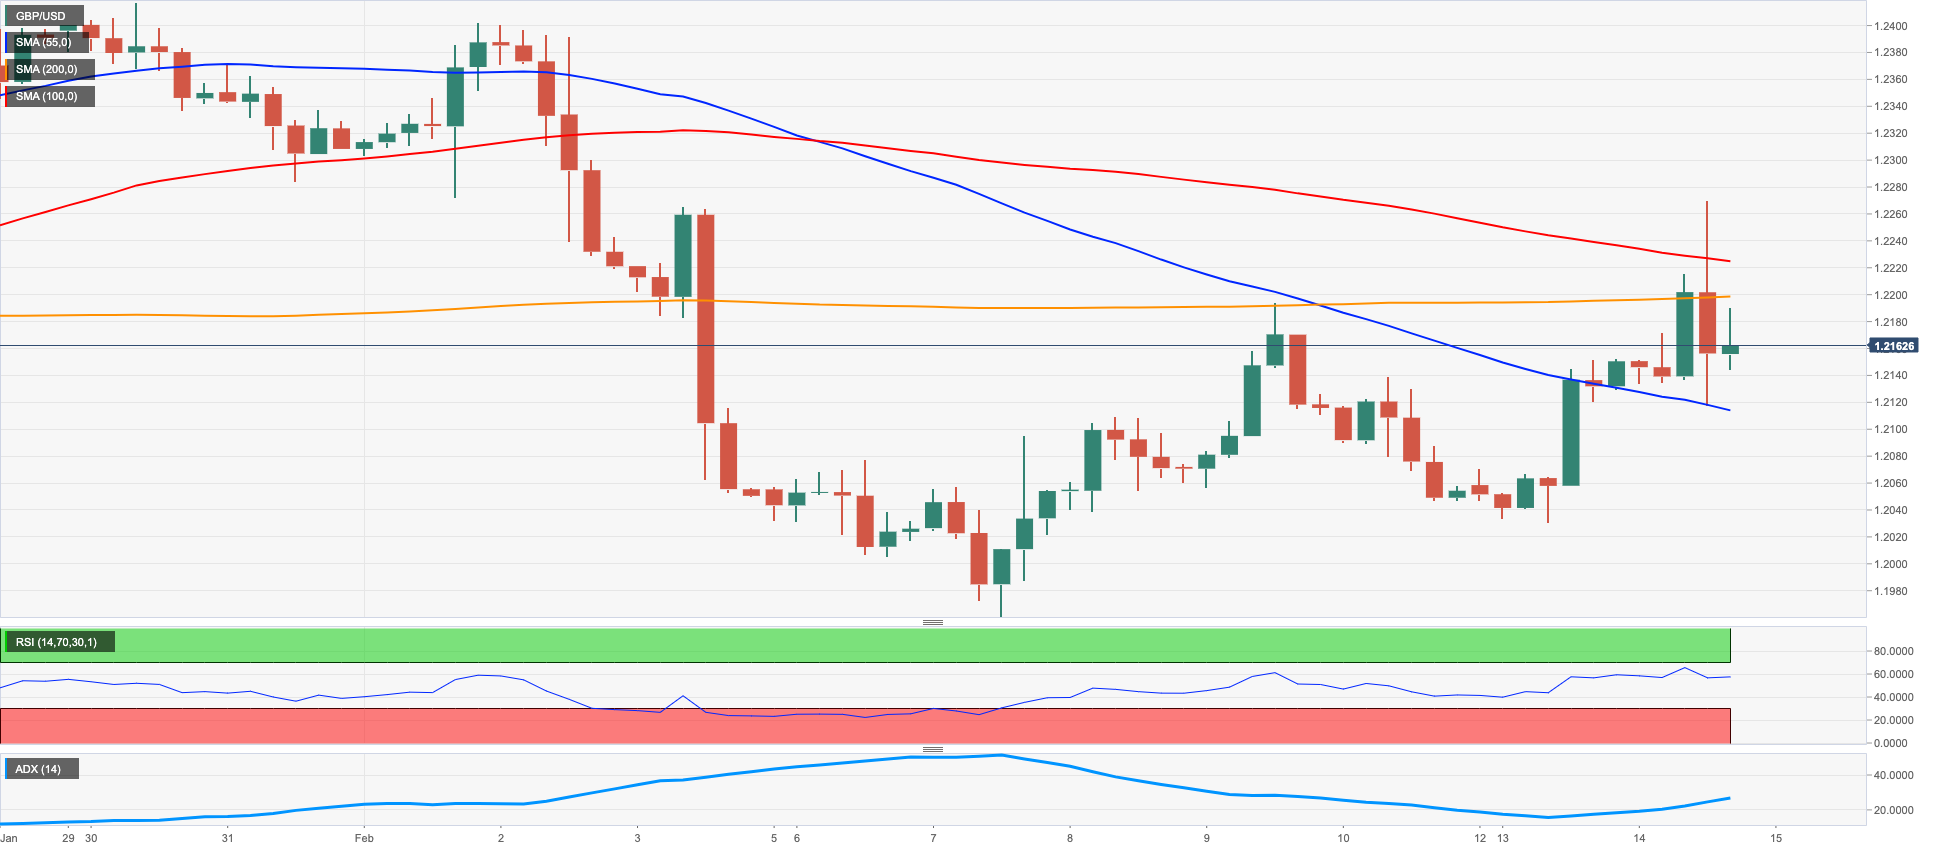
GBP/USD climbed to fresh multi-session highs well past the key 1.2200 the figure on Tuesday, reaching the second daily gain in a row and extending at the same time the positive start of the week.
Extra upside in Cable came once again on the back of the increasing vacillating mood in the greenback, which traded in a volatile way following another monthly deceleration of US inflation figures.
In the UK calendar, the focus of attention was on the release of the labour market report, which saw the Employment Change increase by 74K people in November, while the Unemployment Rate held steady at 3.7% in December. In addition, Average Earnings inc. Bonus rose 5.9% in the 3-month to December and the Claimant Count Change shrank by 12.9K persons in January.
The continuation of the upside momentum in GBP/USD should now target the 2023 peak at 1.2447 (January 23) prior to the May 2022 high at 1.2666 (May 27). The breakout of this level could prompt the key 200-week SMA at 1.2892 to emerge on the horizon ahead of the psychological 1.3000 mark. By contrast, the next support appears at the February low at 1.1960 (February 7) closely followed by the key 200-day SMA at 1.1941. Down from here appears the temporary 100-day SMA at 1.1871 seconded by the 2023 low at 1.1841 (January 6). The daily RSI moved north of the 49 yardstick.
Resistance levels: 1.2269 1.2401 1.2417 (4H chart)
Support levels: 1.2116 1.2030 1.1960 (4H chart)
AUDUSD
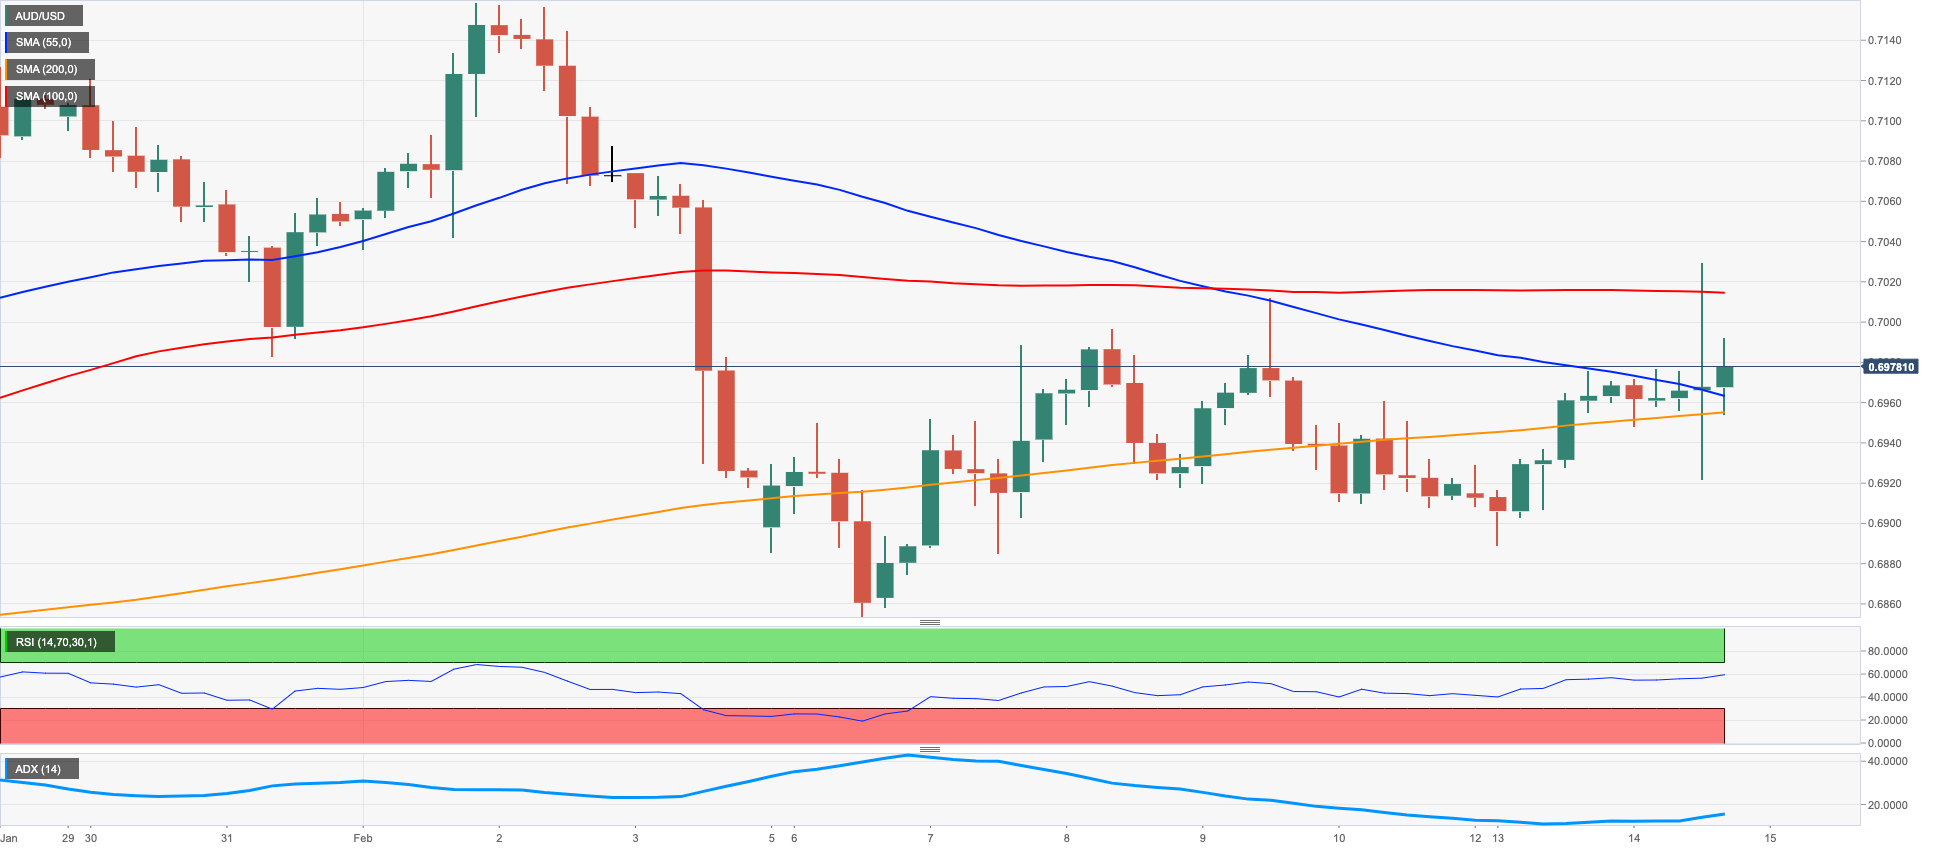
AUD/USD added to the firm start of the week and charted decent gains on Tuesday. A sustained breakout of the key 0.7000 mark, however, remained elusive for yet another session.
The pair’s upside gathered extra pace in response to another poor session in the greenback, which failed to ignite a more lasting bounce after US inflation figures surprised to the upside in January, although they showed a small downtick from the December’s readings.
The mixed tone in the commodity complex also appears to have underpinned the bid bias in the Aussie dollar after copper prices extended the rebound and iron ore edged a tad lower.
In Oz, the always relevant Consumer Confidence Index tracked by Westpac worsened to 78.5 in February (from 84.3) and the Business Confidence measured by NAB improved to 6 (from 0).
If AUD/USD surpasses the weekly top at 0.7029 (February 14) it could open the door to further recovery to the 2023 peak at 0.7157 (February 2) prior to the round level at 0.7200 and the June 2022 high at 0.7282 (June 3). In the opposite direction, there is a provisional support at the 55-day SMA at 0.6868 ahead of the February low at 0.6855 (February 6). South from here emerges the key 200-day SMA at 0.6804 before the 2023 low at 0.6688 (January 3) and the December 2022 low at 0.6629 (December 20). The daily RSI went further up and trespassed the 52 hurdle.
Resistance levels: 0.7029 0.7072 0.7157 (4H chart)
Support levels: 0.6921 0.6890 0.6855 (4H chart)
GOLD
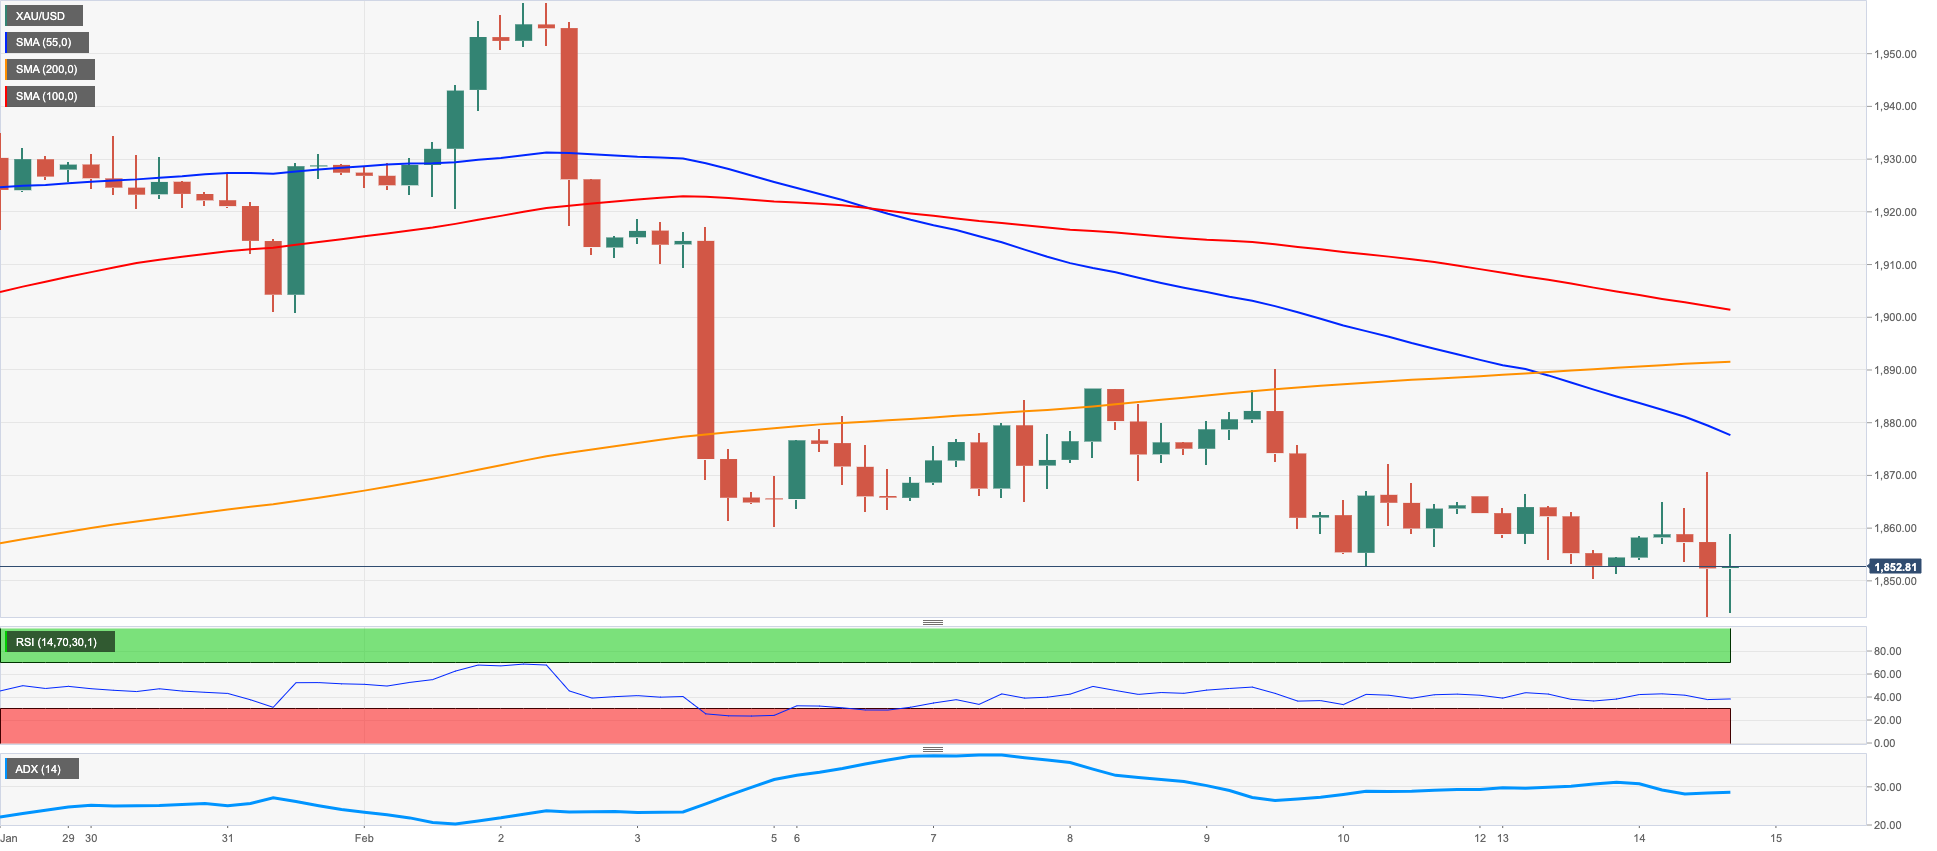
Gold prices rebounded and charted modest gains after hitting fresh 6-week lows near the $1840 level per ounce troy on Tuesday.
In fact, the yellow metal managed to stay in the positive territory despite the late rebound in the greenback and the resumption of the march north in US yields across the curve.
The USD Index (DXY) pared its earlier losses and gathered fresh momentum as investors digested the US inflation figures for the month of January, always amidst expectations of a still tighter-for-longer stance from the Federal Reserve.
By the same token, US yields on the short end of the curve climbed to levels last seen back in early November 2022 around 4.65%, while the 10-year benchmark rose to multi-week highs just below 3.80%.
A deeper retracement in gold could see the key $1800 zone revisited ahead of the key 200-day SMA at $1776 - an area also coincident with the temporary 100-day SMA – prior to the weekly low at $1727 (November 23). Having said that, occasional bullish attempts should meet the next hurdle at the weekly high at $1890 (February 9) ahead of the 2023 top at $1959 (February 2) and the April 2022 peak at $1998 (April 18). Just before this level appears the psychological $2000 mark followed by the 2022 high at $2070 (March 8).
Resistance levels: $1870 $1888 $1910 (4H chart)
Support levels: $1843 $1825 $1797 (4H chart)
CRUDE WTI
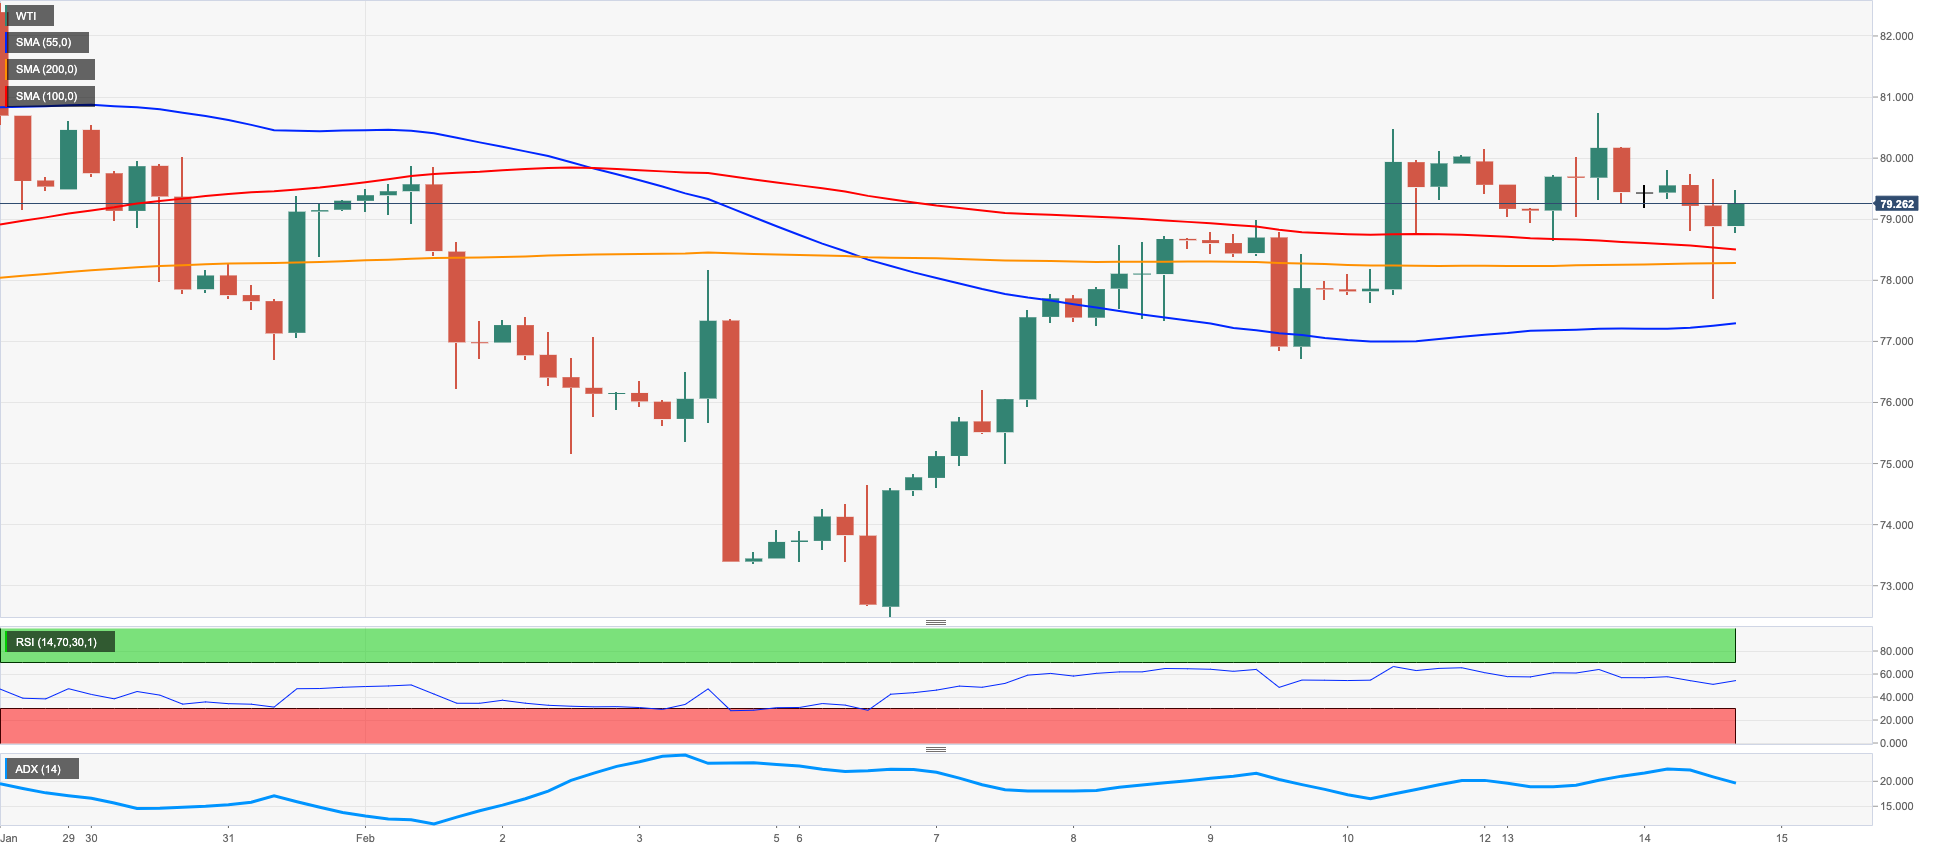
Tuesday's vacillating session saw WTI prices hover around the $79.00 mark per barrel, coming under some pressure following Monday’s monthly peaks past the key $80.00 mark per barrel.
The lack of direction in prices of the commodity followed the announcement of the US government that it will sell more crude oil from the SPR, while the resumption of the normal activity in the port of Ceyhan and the EIA’s report mentioning it expects a production record in March also weighed on traders’ sentiment.
Supporting prices, however, emerged hopes of a potential pivot in the Fed’s normalization process after US consumer prices extended the loss of upside traction in January and prospects for the rebound in the demand for crude in response to the Chinese reopening.
Later on Tuesday, the API will report on US crude oil supplies in the week to February 10.
WTI faces the next up barrier at the February peak at $80.57 (February 13) closely followed by the interim 100-day SMA at $81.00. The breakout of this level exposes a potential move to the 2023 high at $82.60 (January 23) seconded by the December 2022 top at $83.32 (December 1). Once cleared, the commodity could attempt a visit of to the $90.08 level (November 11 2022) ahead of the 200-day SMA at $90.67. On the contrary, there is no support level of note before the 2023 low at $72.30 (February 6). The breach of this level could put the 2022 low at $70.10 (December 9) to the test just before the key round level at $70.00 and the weekly low at $66.15 (December 20 2021).
Resistance levels: $80.57 $82.44 $83.32 (4H chart)
Support levels: $77.44 $76.50 $74.72 (4H chart)
GER40
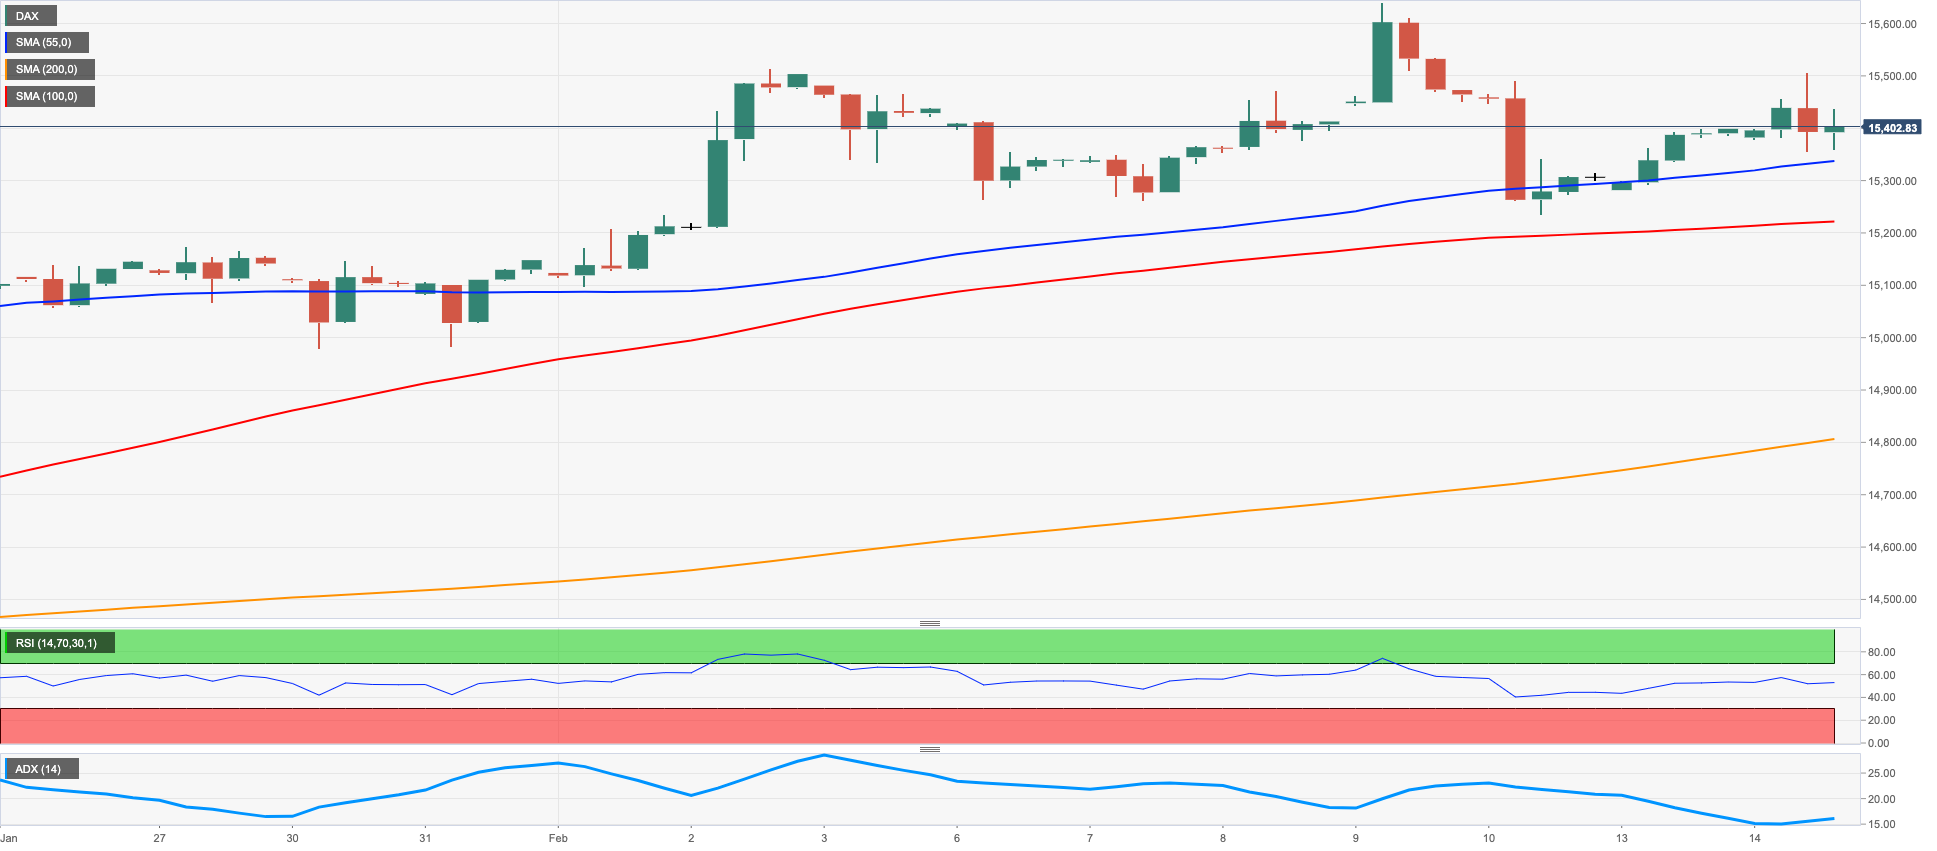
The German reference index DAX40 was the sole underperformer among its European peers after it retreated marginally to the sub-15400 region on Tuesday.
Indeed, investors continued to see the Federal Reserve extending its hiking cycle after US inflation figures remained elevated and rose more than estimated in January.
Same concerns appear to hover around the ECB despite the central bank already announcing its will assess its stance after the already anticipated 50 bps rate hike at the upcoming March gathering.
In the German debt market, in the meantime, the 10-year Bund yields climbed to fresh tops near 2.45%, an area last visited back in early January.
In Germany, Wholesale Prices rose 0.2% MoM in January and 10.6% from a year earlier.
The resumption of the bullish bias in the DAX40 is expected to meet the next resistance level at the 2023 top at 15658 (February 9) prior to the February 2022 peak at 15736 (February 2 2022) and the round level at 16000. If the index breaks above this level it could then challenge the 2022 high at 16285 (January 5). Just the opposite, the weekly low at 15246 (February 10) is seen offering initial contention before the weekly low at 14906 (January 19) and the temporary 55-day SMA at 14688. Extra downside could revisit the December 2022 low at 13791 (December 20) ahead of the key 200-day SMA at 13700 and the November 2022 low at 13022 (November 3). The daily RSI deflated marginally to the vicinity of 61.
Best Performers: Deutsche Bank AG, Bayer, Volkswagen VZO
Worst Performers: MTU Aero, Sartorius AG VZO, Linde PLC
Resistance levels: 15526 15658 15736 (4H chart)
Support levels: 15246 14995 14906 (4H chart)
NASDAQ
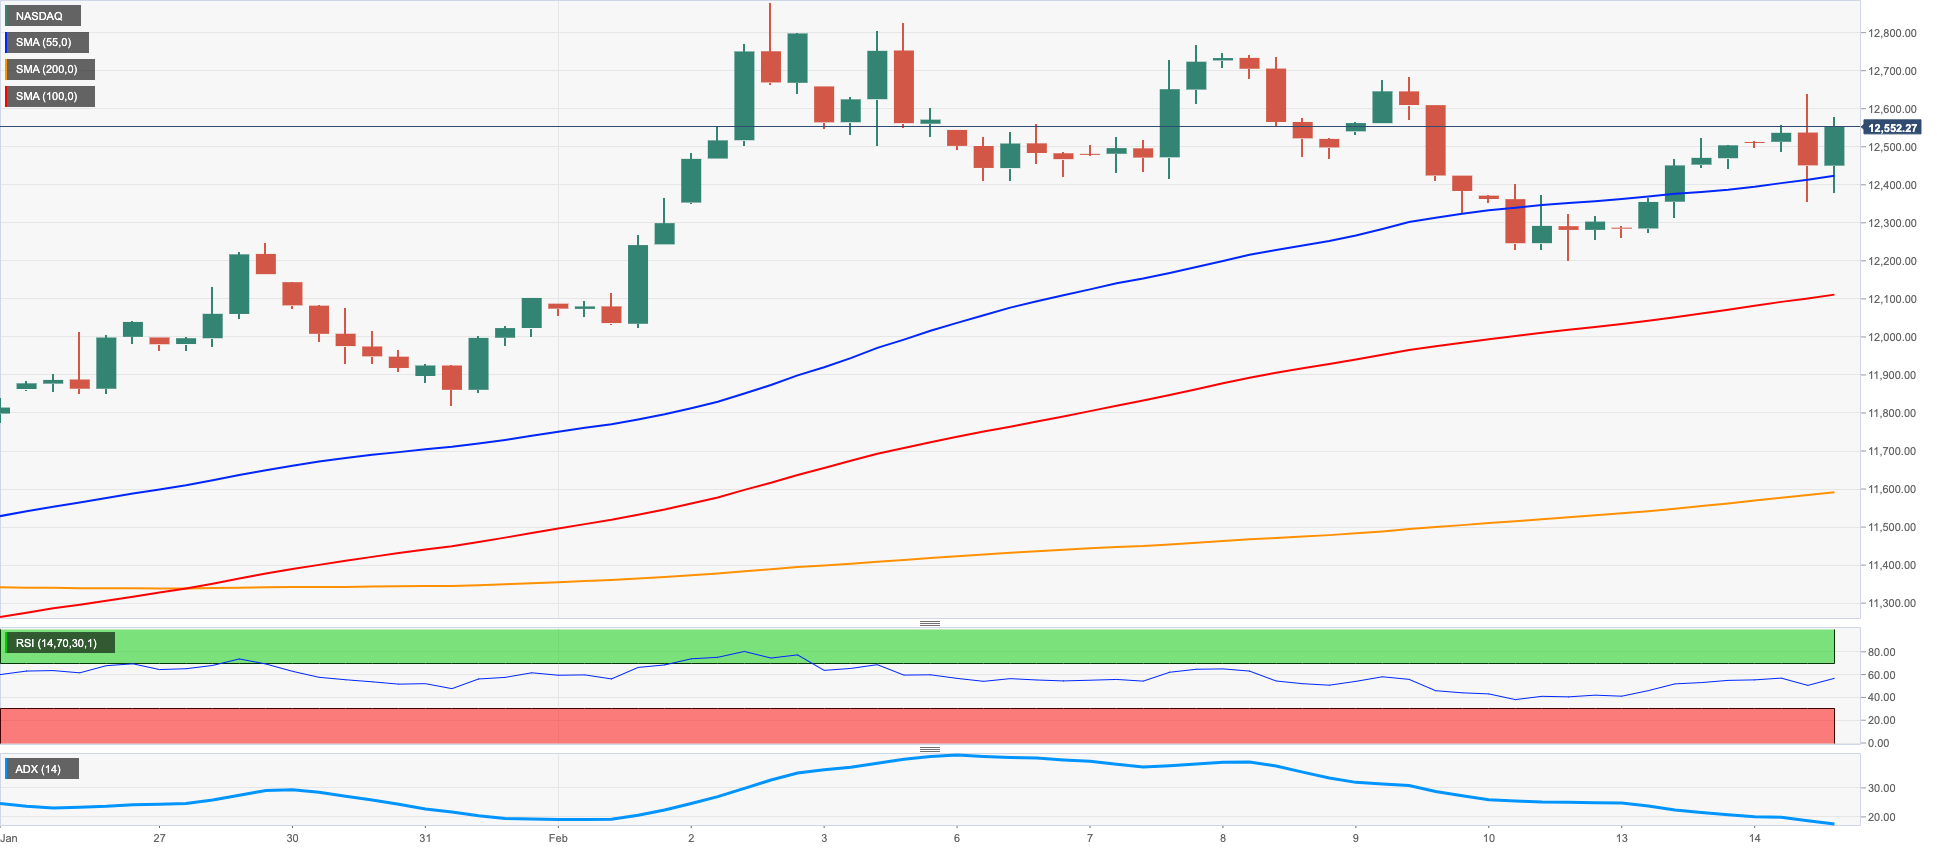
The Nasdaq 100 added to the optimism seen at the beginning of the week and briefly climbed to fresh 3-day highs past the 12600 level on Tuesday, just to surrender part of those gains afterwards.
In fact, the tech sector gave away some ground on the back of the late U-turn in the dollar and the march further north in US yields, particularly in the short end and the belly of the curve, as January US inflation readings came in higher than expected, tilting the debate towards a hawkish Fed for longer.
The continuation of the uptrend in the Nasdaq 100 should meet the next barrier at the 2023 top at 12880 (February 2) prior to the round level at 13000 and the weekly high at 13175 (August 26 2022). On the other hand, immediate contention appears at the weekly low at 12375 (February 10) followed by the key 200-day SMA at 11926 and weekly lows at 11550 (January 25) and 11251 (January 19). A drop below the latter exposes the January low at 10696 (January 6) before the December 2022 low at 10671 (December 22) and the November 2022 low at 10632 (November 4). The daily RSI bounced to the proximity of the 61 mark.
Top Gainers: Globalfoundries, Cadence Design, Tesla
Top Losers: PayPal Holdings Inc, Enphase, Dollar Tree
Resistance levels: 12627 12771 12880 (4H chart)
Support levels: 12204 11906 11550 (4H chart)
DOW JONES
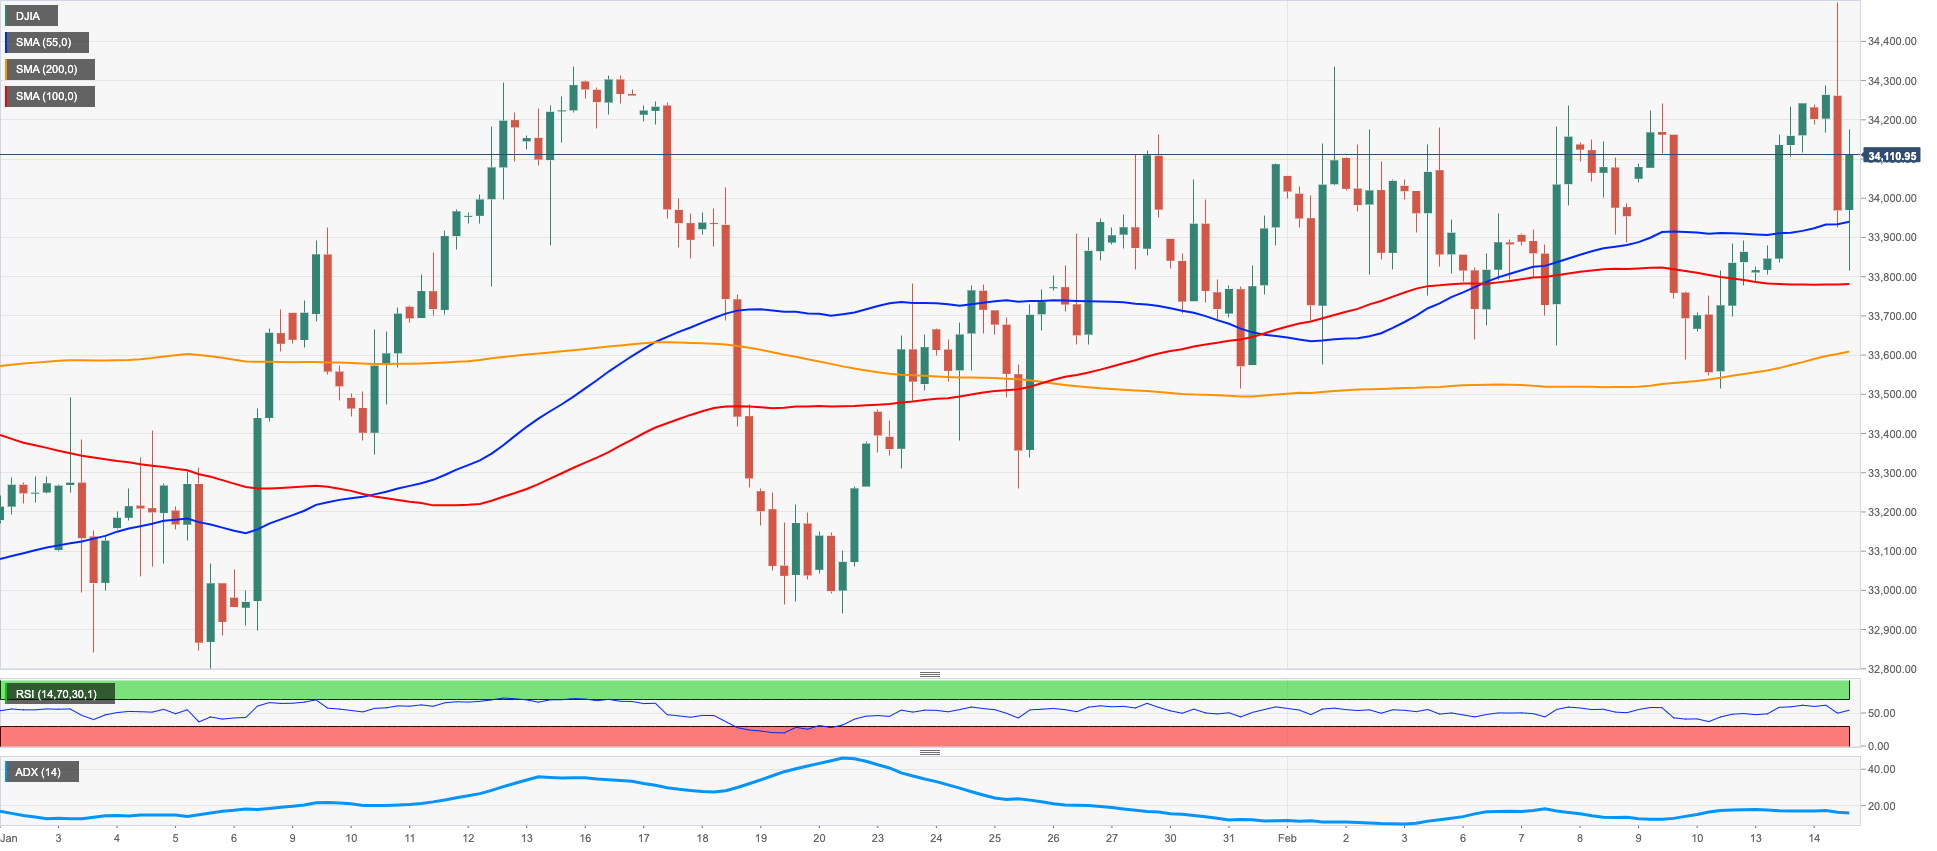
US equities tracked by the Dow Jones reversed two consecutive daily advances and left behind the promising start of the week after retreating moderately on Tuesday.
Indeed, investors’ sentiment suffered once again the hawkish narrative from Fed’s rate setters soon after US inflation figures surprised to the upside during January.
Furthermore, and despite consumer prices lacking upside traction when compared with the previous month, they still showed elevated levels of inflation, which morphed into further speculation that the Fed might keep rising rates in the next months.
In addition, the rebound in the greenback and higher US yields also kept the mood depressed on Tuesday.
All in all, the Dow Jones dropped 0.44% to 34097, the S&P500 retreated 0.18% to 4129 and the tech-heavy Nasdaq Composite advanced 0.21% to 11915.
The Dow Jones extended further the consolidative mood. Against that, the initial up barrier remains at the 2023 peak at 34342 (January 13) prior to the December 2022 high at 34712 (December 13). The surpass of the latter could put a test of the April 2022 top at 35492 on the investors’ radar prior to the February 2022 peak at 35824 (February 9). For all that, the February low at 33581 (February 1) should offer initial contention ahead of the weekly low at 32948 (January 20) and the December 2022 low at 32573 (December 22). A deeper drop could see the key 200-day SMA at 32334 revisited. The daily RSI ticked lower to the sub-56 area.
Top Performers: Boeing, Chevron, Microsoft
Worst Performers: Home Depot, Travelers, Coca-Cola
Resistance levels: 34334 34712 35492 (4H chart)
Support levels: 33581 33273 32948 (4H chart)
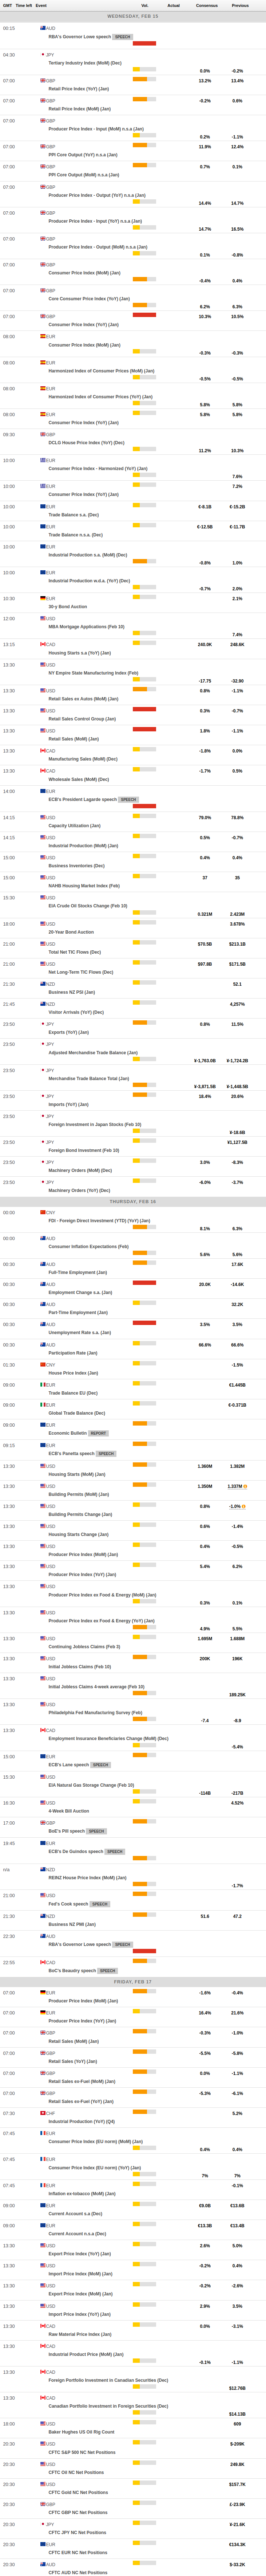
MACROECONOMIC EVENTS
All Information & Updates provided by:

All information relating to the financial markets available on this page has been prepared and issued by FXStreet (Forexstreet SL, Spain, Reg: B62498233) on the basis of publicly available information and all information believed to be reliable and does not conflict with Kuwaiti local laws, and all necessary care has been taken to before the company to ensure that the facts mentioned are correct from the source.
NCM Investment nor any of its directors or employees shall in any way be held responsible for the contents of this news, and the information contained on this page is intended only to provide clients with publicly available information and should not be construed as investment advice, report or analysis and/or constitute an offer or invitation to buy or sell financial instruments of any kind.
RISK WARNING: Forex and CFDs are highly risky leveraged products, as losses can exceed deposits. Please ensure you understand all the risks and take independent advice if necessary. NCM will segregate the clients based on the criteria of the regulator and its bylaws. NCM does not provide any advisory service; the material published does not constitute advice or a recommendation for a transaction in any financial instrument. NCM accepts no responsibility for any use of the content presented and any consequences of that use. Anyone acting on the information provided does so at their own risk.