
- Contact Us:
-

-

-

-


Daily Market Updates
16 Feb 2023
USDJPY
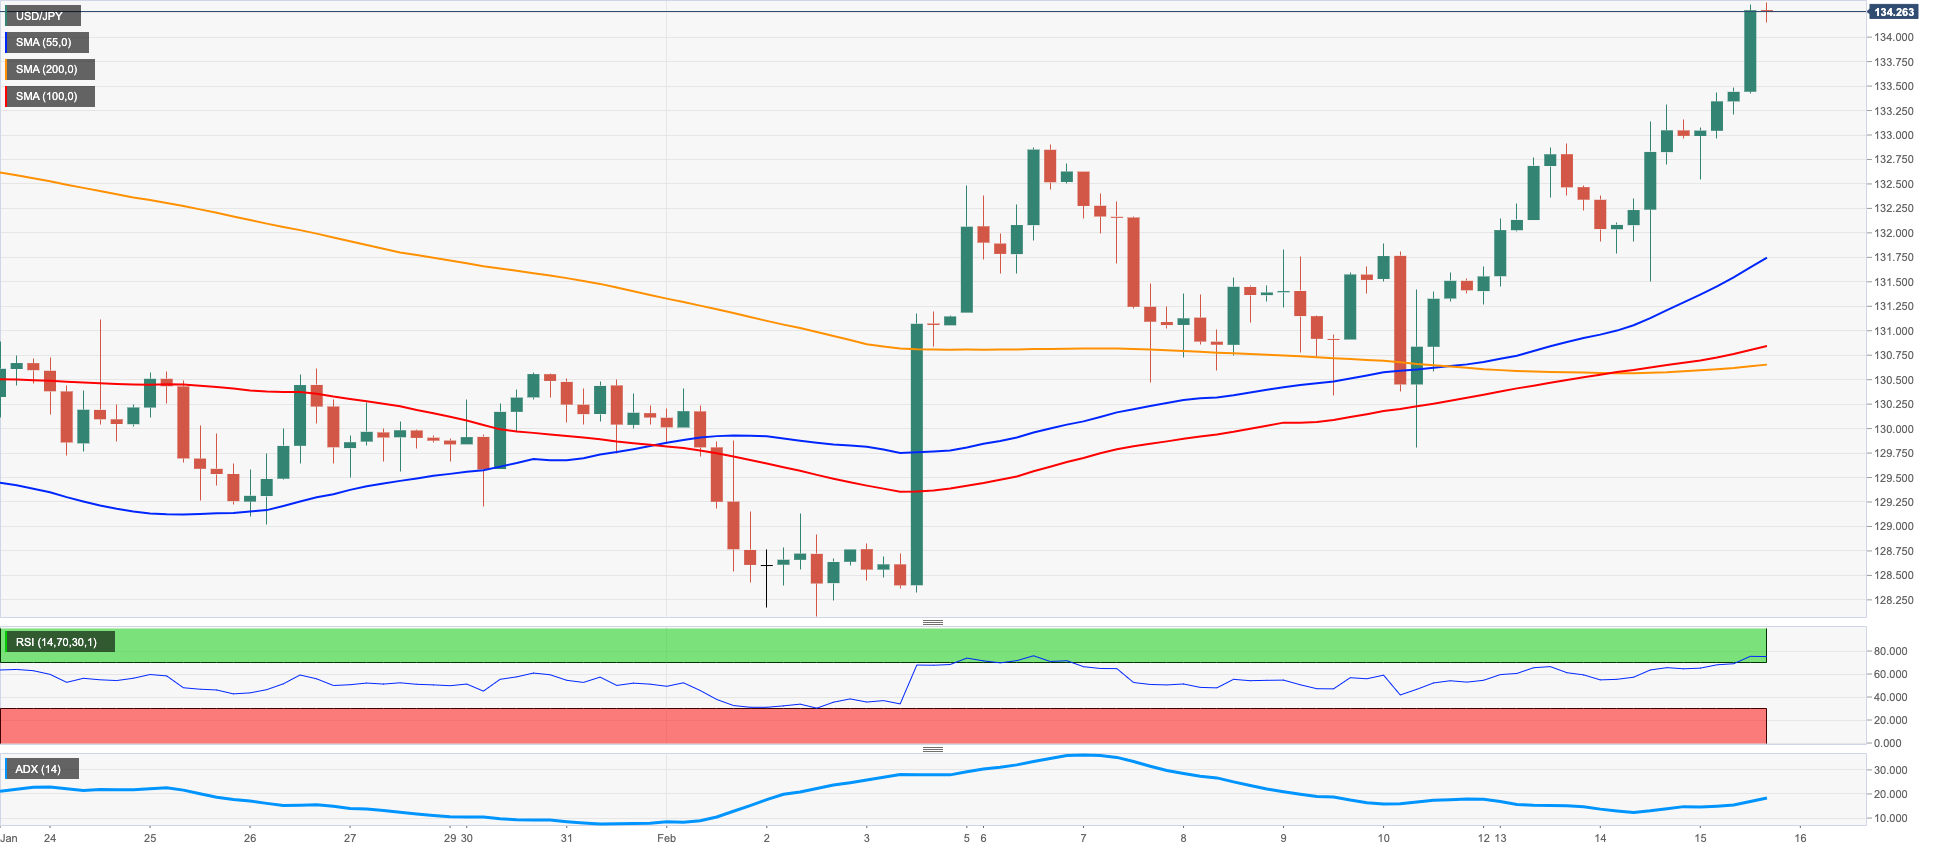
USD/JPY added to the weekly recovery and advanced for the third session in a row on Wednesday.
Indeed, the sharp rebound in the greenback coupled with further upside in US yields across the curve sponsored new 6-week highs in the pair in the 134.30 region midweek.
The pair’s upside bias picked up extra impulse soon after US Retail Sales came in well above expectations, which in turn reinforced speculation of a Fed’s tighter-for-longer stance.
In Japan, the Tertiary Industry Index contracted at a monthly 0.4% in December.
In light of the ongoing price action, USD/JPY is now expected to challenge the 2023 peak at 134.77 (January 6) sooner rather than later. Once this level is cleared, the pair could move to the key 200-day SMA at 136.85 ahead of the interim 100-day SMA at 137.84 and weekly highs at 138.17 (December 15 2022) and 139.89 (November 30 2022), all ahead of the key round level at 140.00. By contrast, there is a minor support at the weekly low at 129.79 (February 10) prior to the February low at 128.08 (February 2) and the 2023 low at 127.21 (January 16). South from here comes the May 2022 low at 126.36 (May 24) seconded by the weekly low at 121.27 (March 31 2022). The daily RSI improved further and trespassed the 62 level.
Resistance levels: 134.35 134.77 137.47 (4H chart)
Support levels: 131.83 130.65 129.79 (4H chart)
GBPUSD
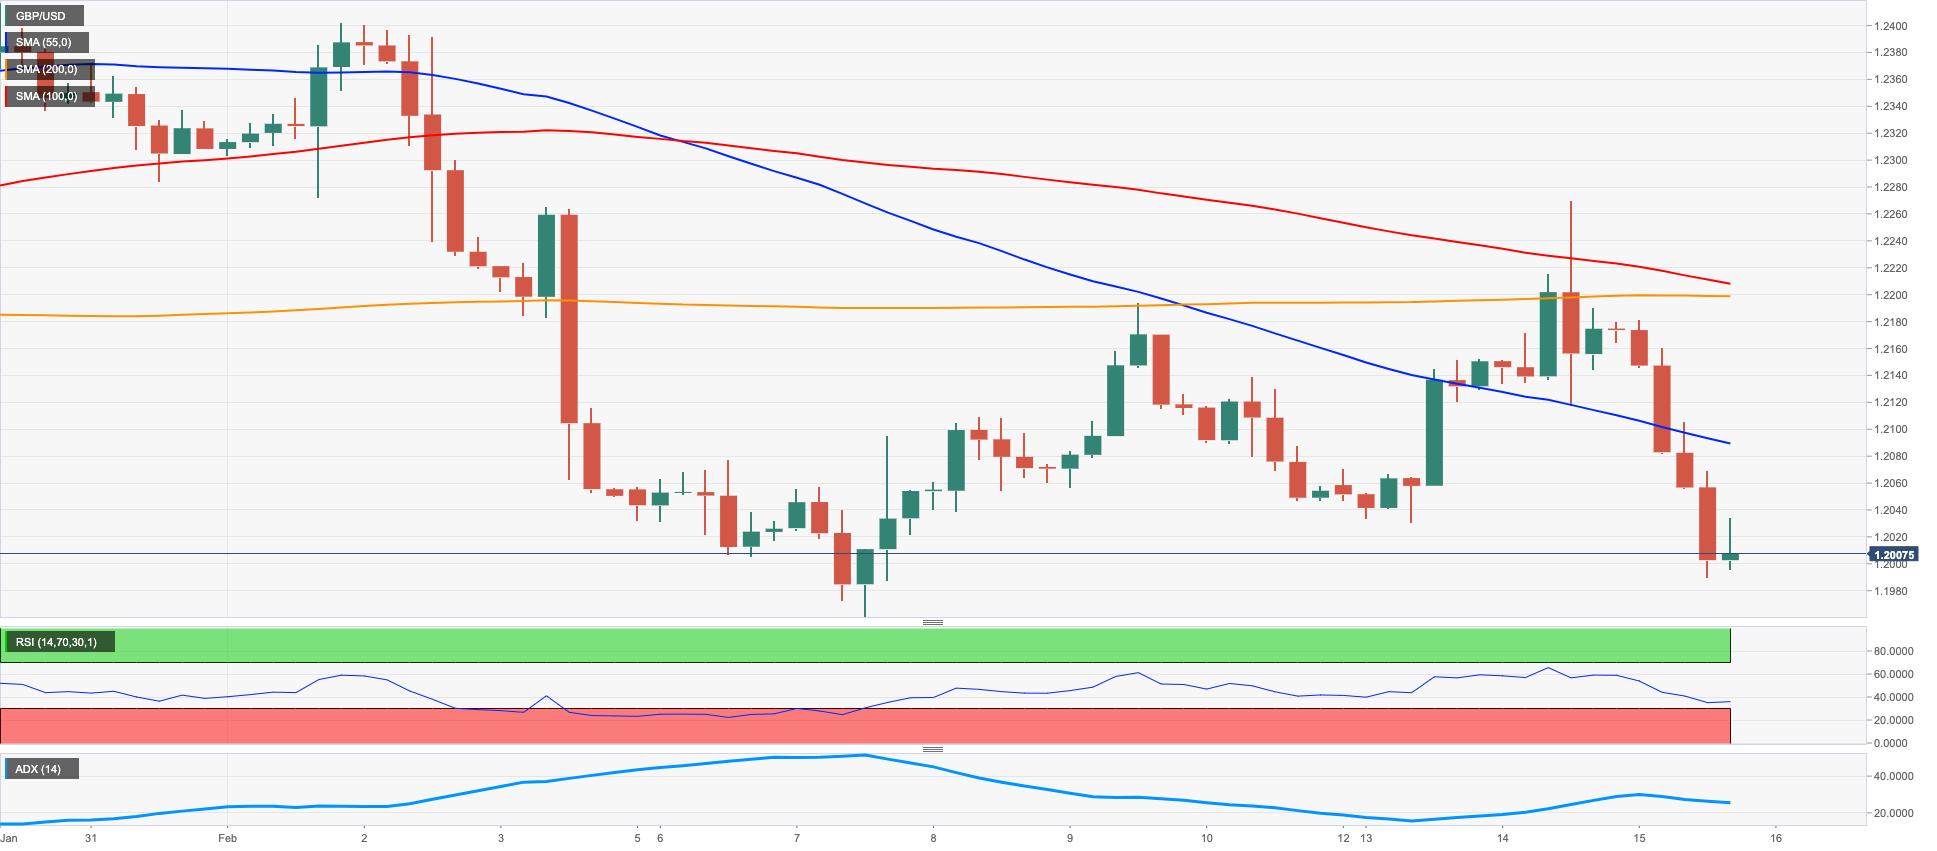
The resumption of the buying interest around the dollar weighed on the British pound and the risk complex in general, forcing GBP/USD to change course and leave behind two straight sessions with gains, including Tuesday’s uptick to multi-day highs near 1.2270.
The Sterling derived further weakness after UK inflation figures came in well below expectations in January, which are eventually seen undermining the hawkish message from some BoE policy makers and pouring cold water over further tightening by the “Old Lady”.
Indeed, it was an interesting day in the UK docket after the Inflation Rate rose 10.1% in the year to January and 5.8% when it came to the Core Inflation Rate. On a monthly basis, the headline Inflation Rate contracted 0.6%.
Further losses now expose GBP/USD to revisit the February low at 1.1960 (February 7) prior to the key 200-day SMA at 1.1939. The loss of this level could put the provisional 100-day SMA at 1.1882 to the test ahead of the 2023 low at 1.1841 (January 6). In the opposite direction, there is an immediate hurdle at the 2023 high at 1.2447 (January 23) seconded by the May 2022 top at 1.2666 (May 27). Once this region is cleared, then Cable could challenge the key 200-week SMA at 1.2891 prior to the psychological 1.3000 yardstick. The daily RSI lost further ground and approached the 40 zone.
Resistance levels: 1.2193 1.2269 1.2401 (4H chart)
Support levels: 1.1989 1.1960 1.1841 (4H chart)
AUDUSD
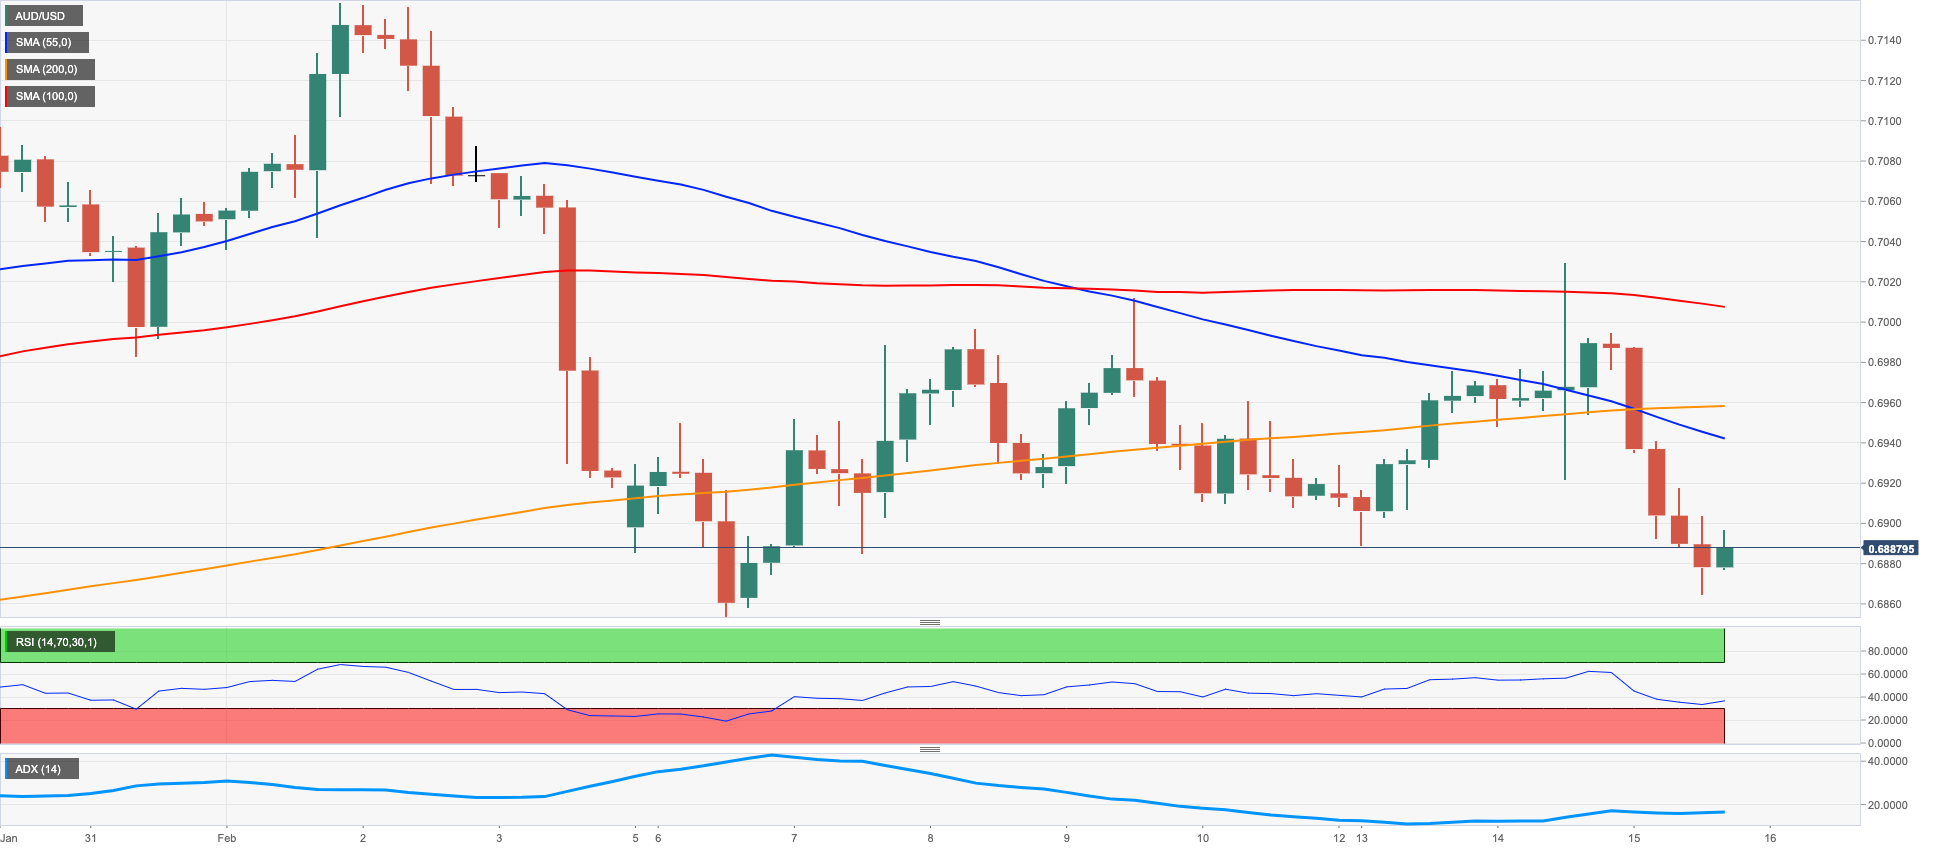
AUD/USD abruptly reversed the insofar firm weekly recovery and retreated to multi-session lows well south of 0.6900 the figure on Wednesday.
Indeed, the resumption of the strong bid bias in the greenback put the Aussie dollar and the rest of the risk-linked assets on the defensive, while the broad-based negative performance of the commodity complex also added to the strong decline in the pair.
In the docket, the speech by RBA Governor P.Lowe was the sole event on Wednesday. Lowe stressed that the current monetary policy stance is restrictive, although he suggested that the central bank might have not done enough with rates and that the peak is yet to be seen. Lowe said that how far rates can go up still remains uncertain, adding that it is not the RBA’s intention to send the economy into recession.
Following the sharp pullback on Wednesday, AUD/USD could now extend the drop to the February low at 0.6855 (February 6) prior to the key 200-day SMA at 0.6803. The loss of the latter exposes a deeper retracement to the 2023 low at 0.6688 (January 3) ahead of the December 2022 low at 0.6629 (December 20). On the flip side, the immediate hurdle appears at the weekly peak at 0.7029 (February 14) before the 2023 high at 0.7157 (February 2). Further up aligns the round level at 0.7200 and the June 2022 top at 0.7282 (June 3). The daily RSI sunk to the 45 region.
Resistance levels: 0.6953 0.7029 0.7072 (4H chart)
Support levels: 0.6864 0.6855 0.6722 (4H chart)
GOLD
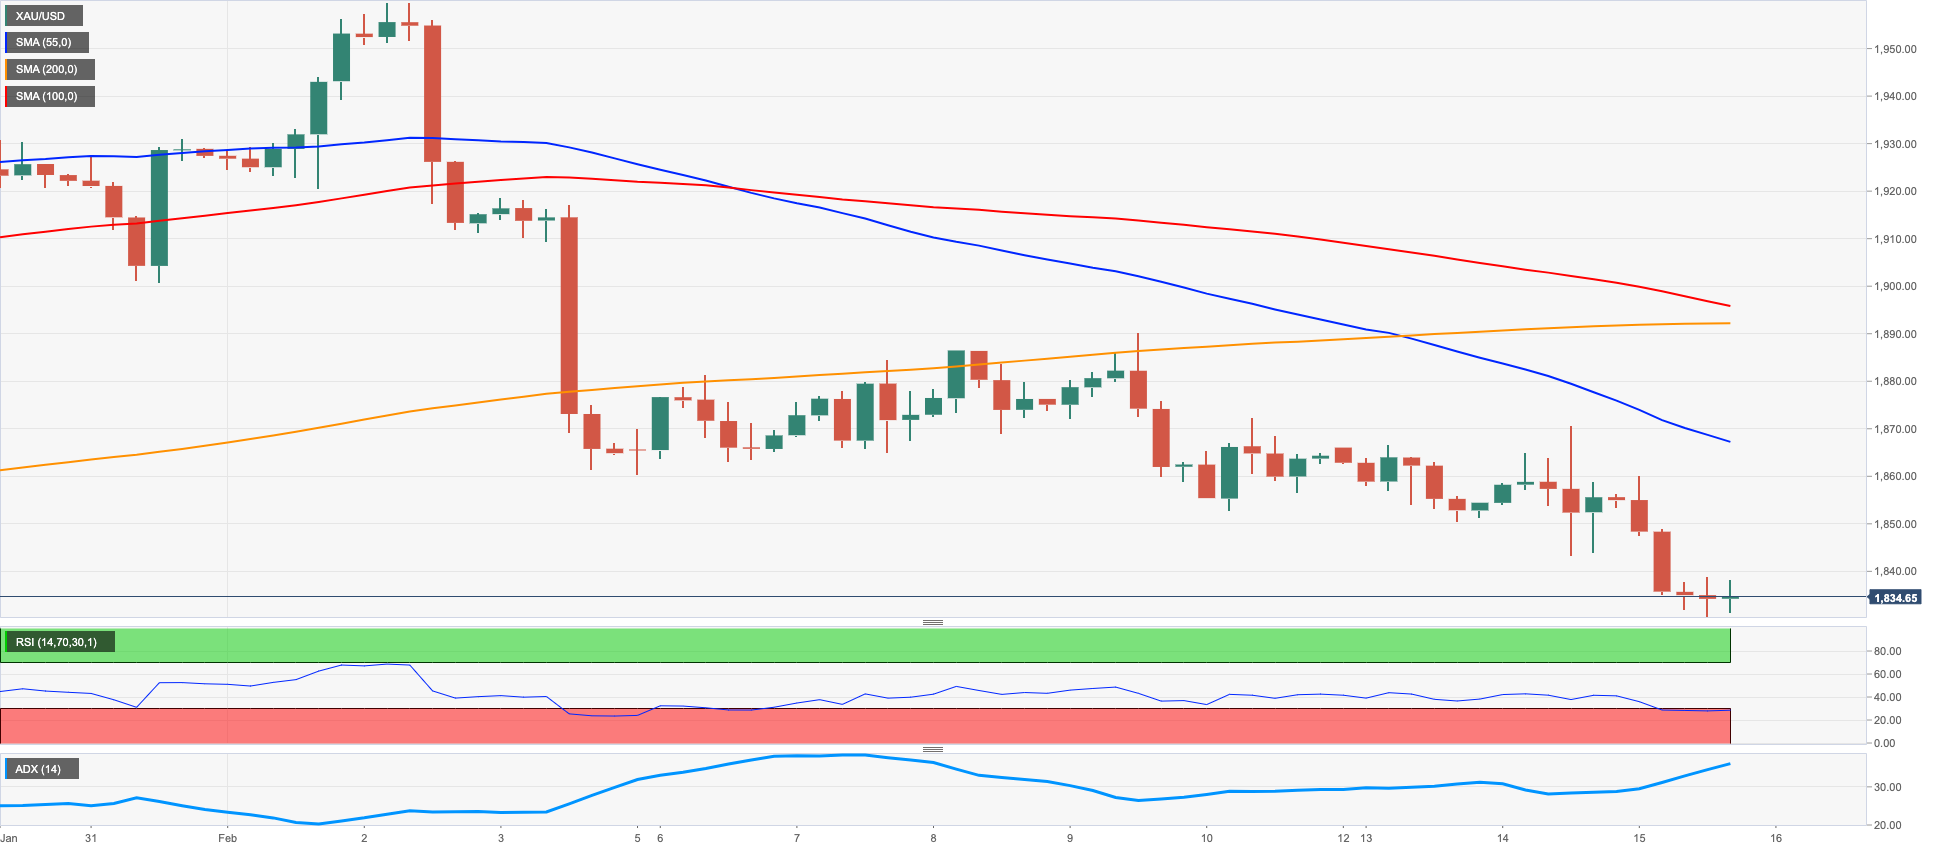
Prices of the ounce troy of the precious metal dropped further and revisited the $1830 region, or 6-week lows, on Wednesday.
Once again, solid prints from the US docket fed into speculations that the Fed might remain in the restrictive territory for longer, while expectations for a raise of the terminal rate to the 5% threshold and beyond gathered renewed impulse.
By the same token, the pronounced rebound in the greenback lifted the USD Index (DXY) past the 104.00 mark for the first time since early January, while further upside in US yields across the curve also weighed on the sentiment around bullion.
In case the decline in gold gathers extra steam, the next contention of relevance is seen at the key $1800 region followed by the $1780 zone, where the key 200-day SMA and the provisional 100-day SMA also converge ahead of the weekly low at $1727 (November 23). In the opposite direction, the weekly top at $1890 (February 9) emerges as the next up barrier prior to the 2023 peak at $1959 (February 2) and seconded by the April 2022 high at $1998 (April 18). Beyond this level aligns the psychological $2000 mark prior to the 2022 top at $2070 (March 8).
Resistance levels: $1870 $1889 $1910 (4H chart)
Support levels: $1830 $1825 $1797 (4H chart)
CRUDE WTI
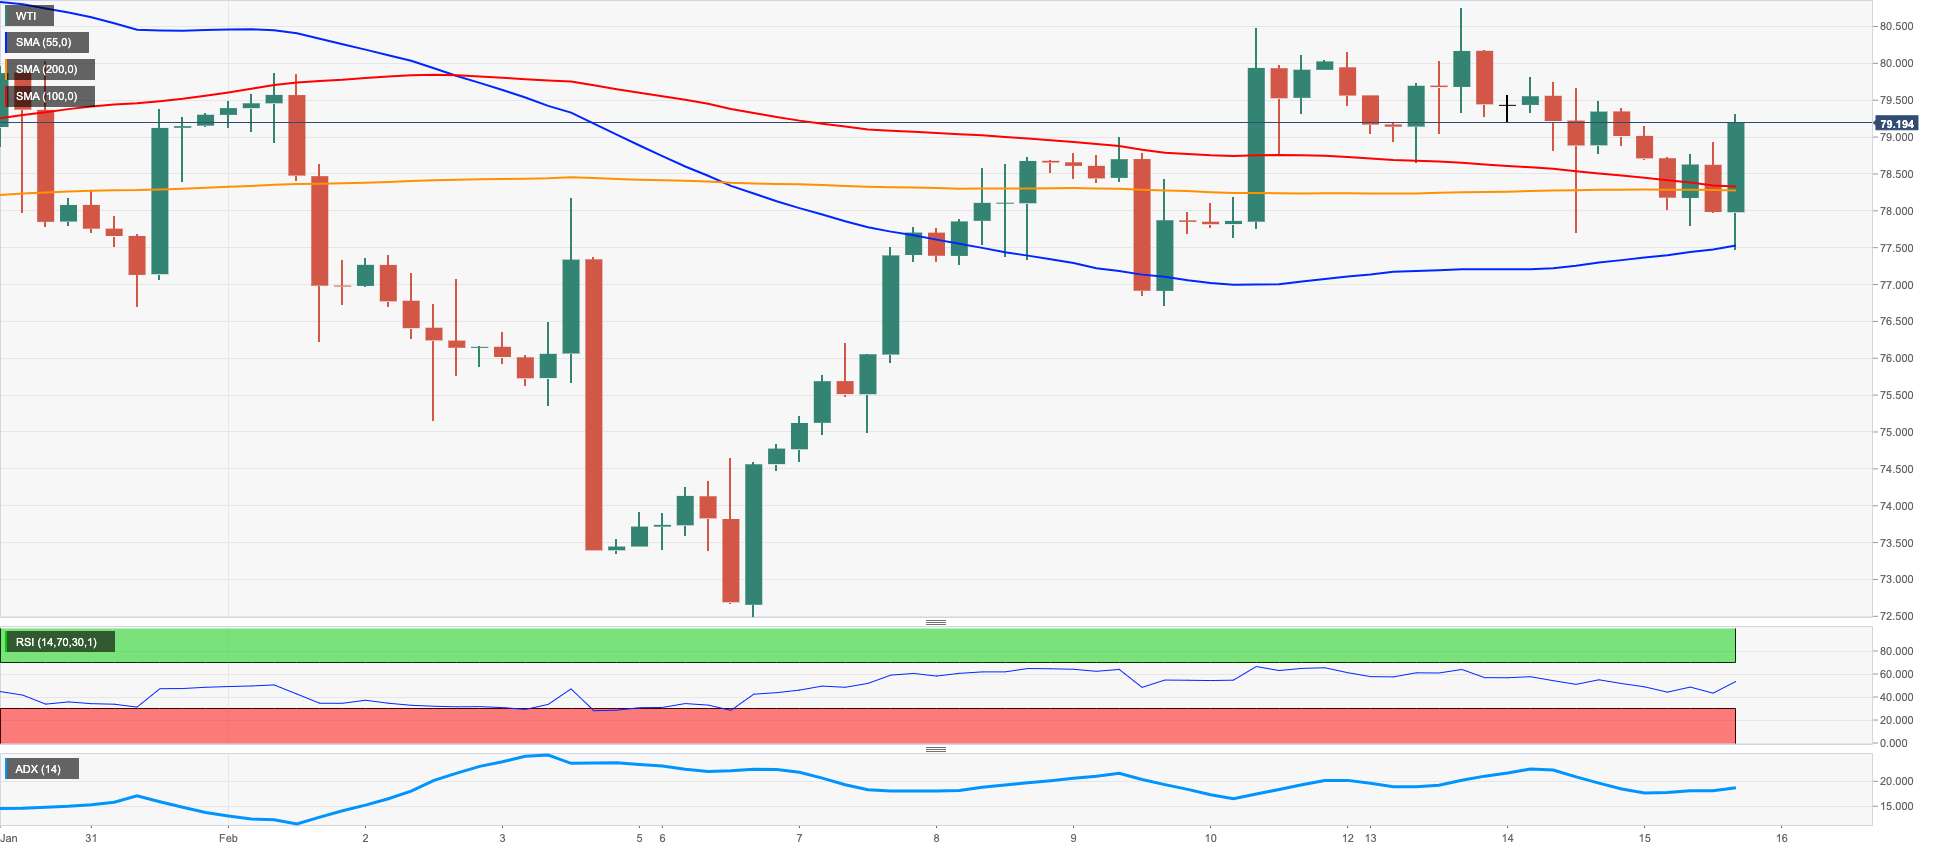
Prices of the American benchmark for the sweet light crude oil managed to reverse a drop to fresh multi-session lows near the $77.00 mark per barrel on Wednesday.
The combination of the strong rebound in the greenback, persevering recession concerns – especially after solid prints from US fundamentals and still elevated inflation – and the mammoth increase in weekly US crude oil supplies, all weighed on the commodity and kept the sentiment among traders subdued.
On the latter, the EIA, in the meantime, said that US crude oil inventories increased by 16.283M barrels in the week to February 10, while supplies at Cushing rose by 0.659M barrels, Distillate Stocks shrank by 1.285M barrels and Gasoline stockpiles surged by 2.317M barrels.
Somewhat limiting the downside, the IEA published its monthly report and now sees the global oil demand increasing by around 2 mbpd this year (to 101.9 mbpd), while it predicts the supply of crude oil will exceed the demand in the first half of the current year.
Next on the downside for the WTI now emerges the 2023 low at $72.30 (February 6) ahead of the 2022 low at $70.10 (December 9), which precedes the key round level at $70.00 and the weekly low at $66.15 (December 20 2021). The other way around, the February high at $80.57 (February 13) comes first and looks reinforced by the provisional 100-day SMA at $81.01. If the commodity breaks above the latter, it could then confront the 2023 top at $82.60 (January 23) ahead of the December 2022 peak at $83.32 (December 1) and the $90.08 level (November 11 2022).
Resistance levels: $80.57 $82.44 $83.32 (4H chart)
Support levels: $77.30 $76.50 $74.72 (4H chart)
GER40
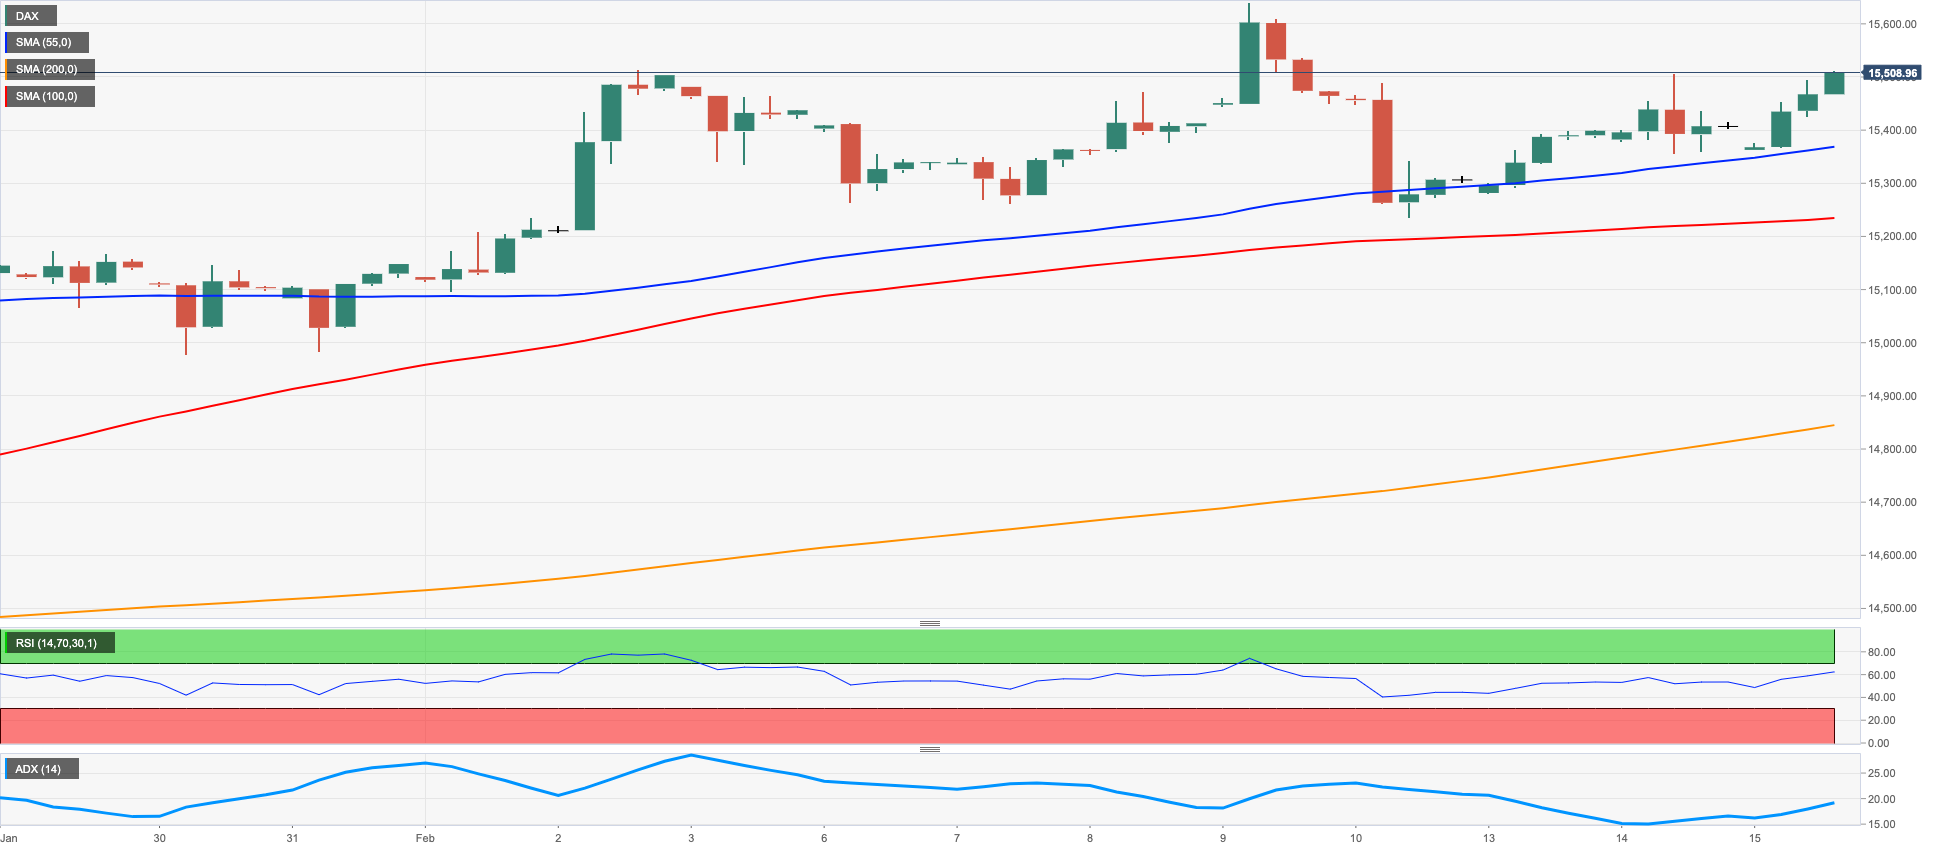
German equities quickly shrugged off Tuesday’s small decline and resumed the upside on Wednesday, this time revisiting the 15500 region, up 0.82% for the day.
The German index followed its European peers, as market participants were digesting the recent US and UK inflation figures, both showing lower prints in January vs. the previous month.
In addition, poor prints from the industrial sector in the broader Euroland seem to have underpinned expectations that the ECB could pause its tightening cycle in the next months. The central bank has largely anticipated another 50 bps rate hike at the March event, opening the door to an assessment of the monetary policy afterwards.
Daily gains in the DAX40 were also accompanied by another move higher in the German 10-year Bund yields, which approached the 2.50% for the first time since early in the new year.
The 2023 peak at 15658 (February 9) now emerges as the next target for bulls seconded by the February 2022 high at 15736 (February 2 2022) and the round level at 16000. Once the DAX40 leaves this level behind, it could pave the way for a move to the 2022 top at 16285 (January 5). For all that, the initial support emerges at the weekly low at 15246 (February 10) ahead of the weekly low at 14906 (January 19) and the interim 55-day SMA at 14709. A deeper decline could see the December 2022 low at 13791 (December 20) revisited before the key 200-day SMA at 13710 and the November 2022 low at 13022 (November 3). The daily RSI edged a tad higher to the proximity of 65.
Best Performers: MTU Aero Engines AG, Brenntag SE, Airbus SE
Worst Performers: Deutsche Bank AG, Fresenius Medical Care AG, Merck
Resistance levels: 15526 15658 15736 (4H chart)
Support levels: 15246 14995 14906 (4H chart)
NASDAQ
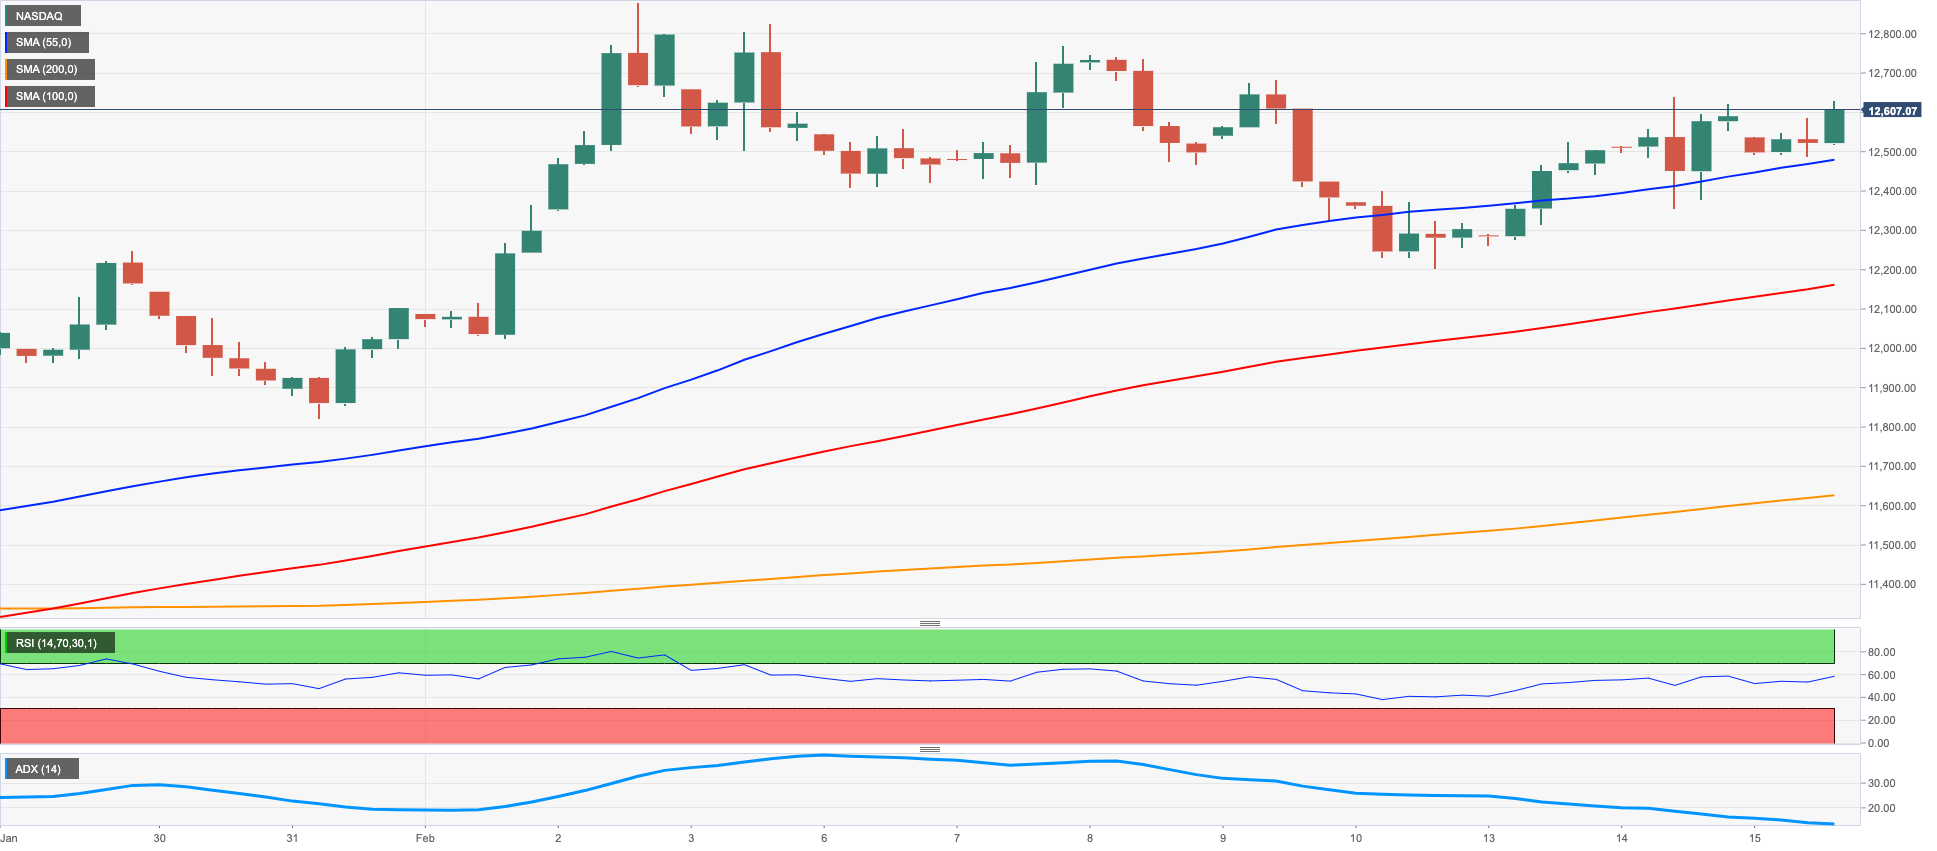
The Nasdaq 100 managed to reverse an initial pullback and advanced for the third session in a row to fresh weekly highs past the 12600 mark on Wednesday.
The sharp rebound in the greenback in combination with the unabated march north in US yields also undermined the investors’ sentiment along with fears of a tighter-for-longer stance from the Fed, particularly in light of the recent firm data from some US fundamentals and the excessively slow march south in the US inflation.
However, the solid performance from megacaps Tesla, Apple and Alphabet among others seem to have been enough to keep the tech benchmark in positive territory.
Despite the daily knee-jerk, the outlook for the Nasdaq 100 remains constructive. Indeed, the next up barrier is seen at the 2023 peak at 12880 (February 2) ahead of the round level at 13000 and the weekly top at 13175 (August 26 2022). Just the opposite, the weekly low at 12375 (February 10) is deemed as the next magnet for bears followed by the key 200-day SMA at 11925 and weekly lows at 11550 (January 25) and 11251 (January 19). The loss of the latter could put the January low at 10696 (January 6) back on the radar ahead of the December 2022 low at 10671 (December 22) and the November 2022 low at 10632 (November 4). The daily RSI eased marginally below the 62 level.
Top Gainers: Airbnb, Rivian Automotive, Analog Devices
Top Losers: Biogen, Diamondback, Globalfoundries
Resistance levels: 12627 12771 12880 (4H chart)
Support levels: 12204 11906 11550 (4H chart)
DOW JONES
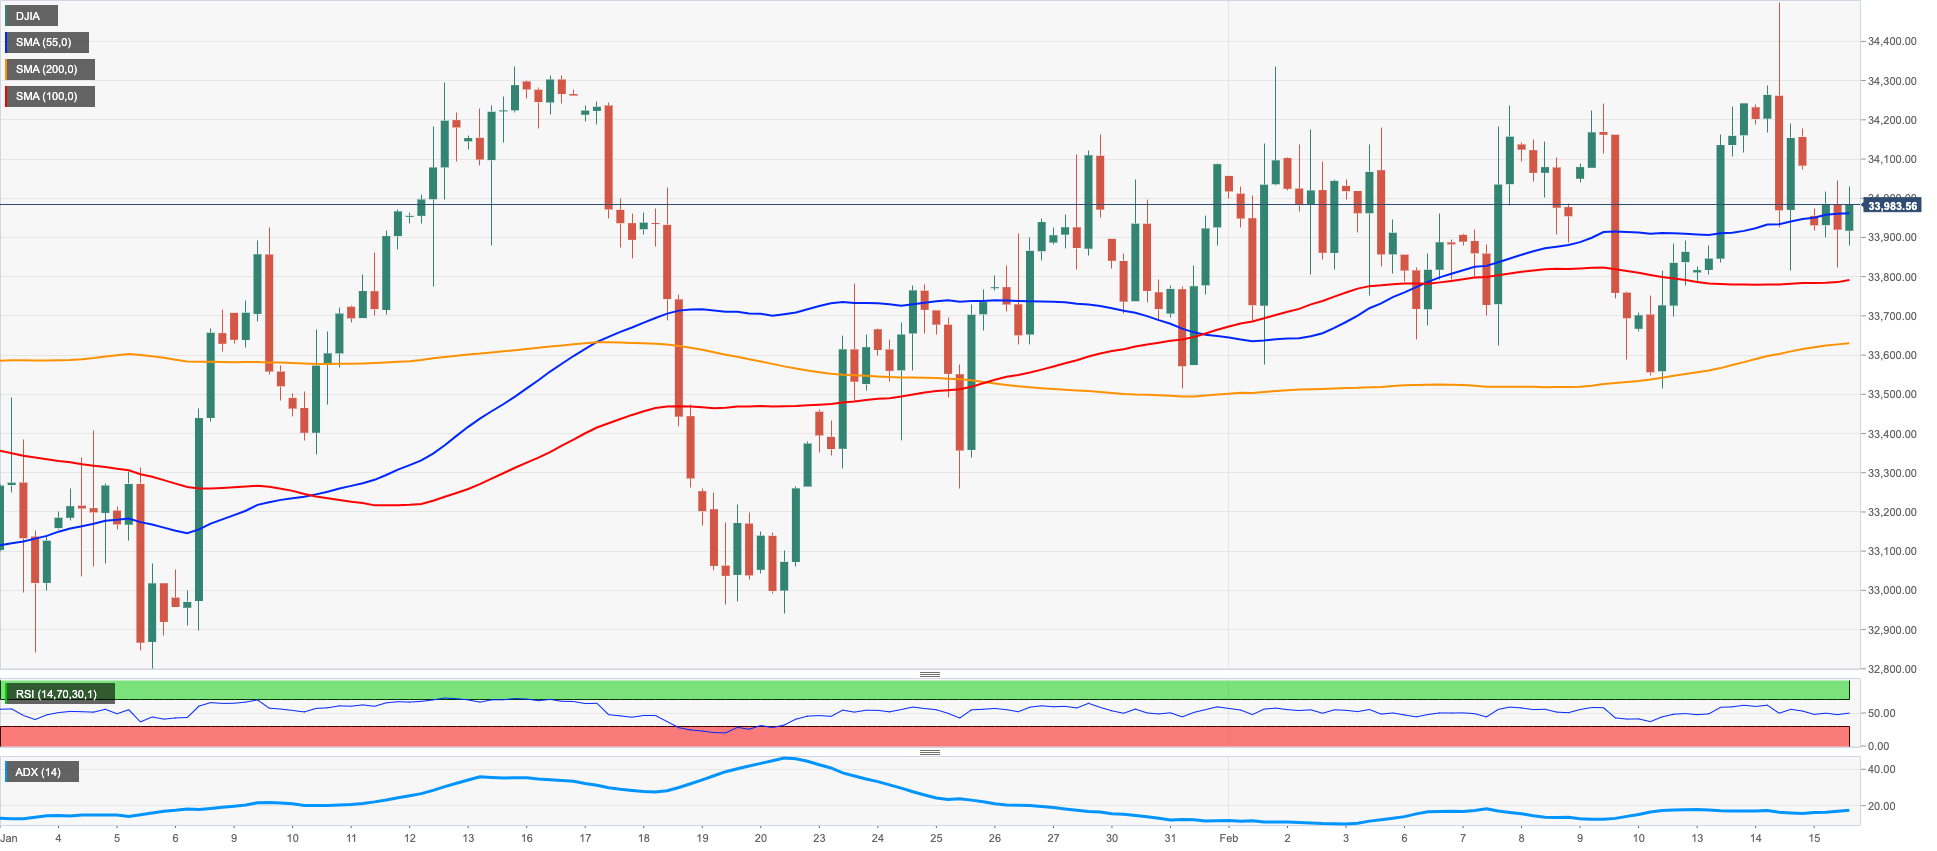
Renewed data-led recession concerns spooked investors and weighed on equities tracked by the Dow Jones for the second session in a row on Wednesday, forcing the index to drop below the 34000 mark, or 3-day lows, just to bounce afterwards.
Indeed, (much) firmer-than-expected US Retail Sales during the first month of the year reignited fears of the continuation of the tightening cycle by the Federal Reserve and underpinned speculation of a terminal rate well beyond the 5% mark.
On the whole, the Dow Jones retreated 0.16% to 34047, the S&P500 gained 0.02% to 4136 and the tech-reference Nasdaq Composite rose 0.50% to 12019.
Extra range bound appears the name of the game for the Dow Jones for the time being. That said, occasional bouts of strength could see the 2023 high at 34342 (January 13) retested ahead of the December 2022 top at 34712 (December 13). The breakout of this level could prompt the April 2022 peak at 35492 to re-emerge on the horizon before the February 2022 high at 35824 (February 9). On the opposite side, a drop below the February low at 33581 (February 1) could pave the way for a move to the weekly low at 32948 (January 20) ahead of the December 2022 low at 32573 (December 22) and the key 200-day SMA at 32338. The daily RSI deflated to the vicinity of the 51 region.
Top Performers: Caterpillar, Cisco, Apple
Worst Performers: J&J, Microsoft, Chevron
Resistance levels: 34334 34712 35492 (4H chart)
Support levels: 33581 33273 32948 (4H chart)
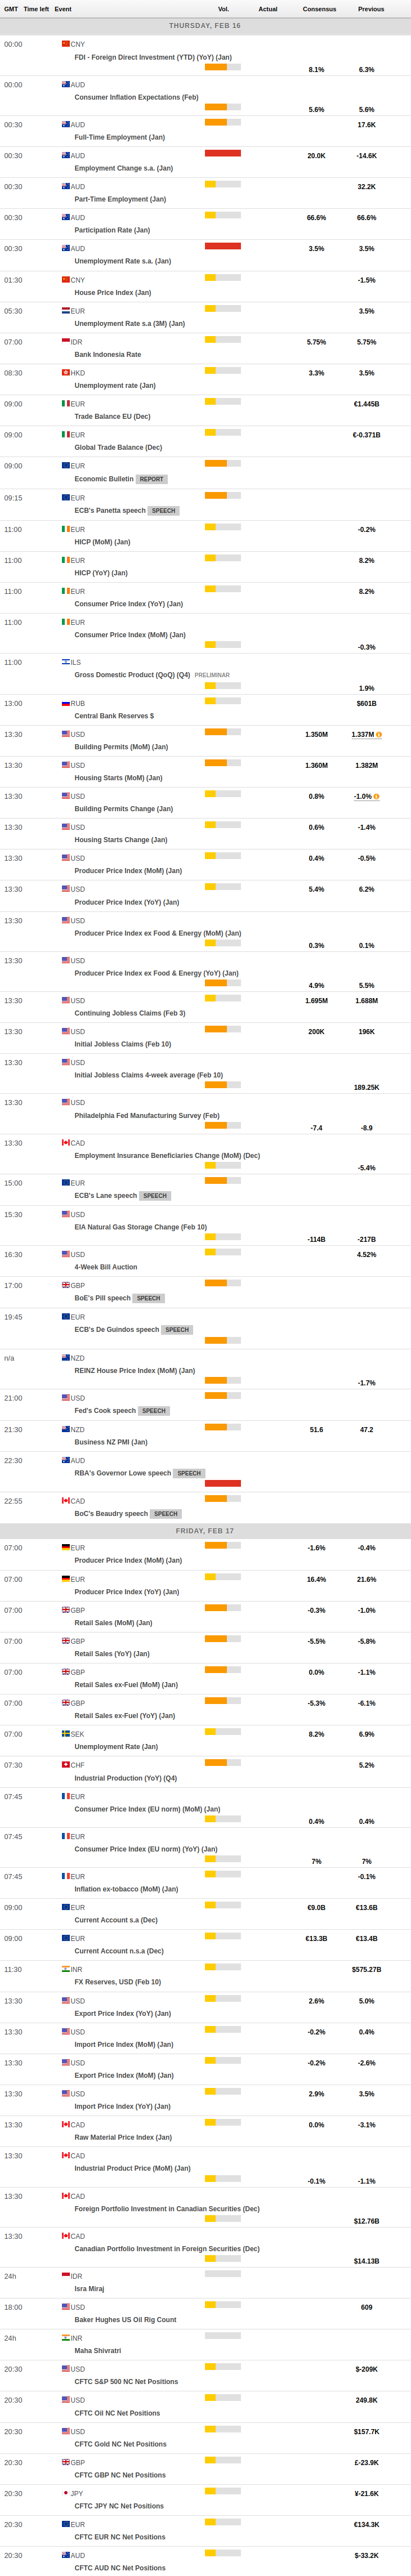
MACROECONOMIC EVENTS
All Information & Updates provided by:

All information relating to the financial markets available on this page has been prepared and issued by FXStreet (Forexstreet SL, Spain, Reg: B62498233) on the basis of publicly available information and all information believed to be reliable and does not conflict with Kuwaiti local laws, and all necessary care has been taken to before the company to ensure that the facts mentioned are correct from the source.
NCM Investment nor any of its directors or employees shall in any way be held responsible for the contents of this news, and the information contained on this page is intended only to provide clients with publicly available information and should not be construed as investment advice, report or analysis and/or constitute an offer or invitation to buy or sell financial instruments of any kind.
RISK WARNING: Forex and CFDs are highly risky leveraged products, as losses can exceed deposits. Please ensure you understand all the risks and take independent advice if necessary. NCM will segregate the clients based on the criteria of the regulator and its bylaws. NCM does not provide any advisory service; the material published does not constitute advice or a recommendation for a transaction in any financial instrument. NCM accepts no responsibility for any use of the content presented and any consequences of that use. Anyone acting on the information provided does so at their own risk.