
- Contact Us:
-

-

-

-


Daily Market Updates
17 Feb 2023
USDJPY
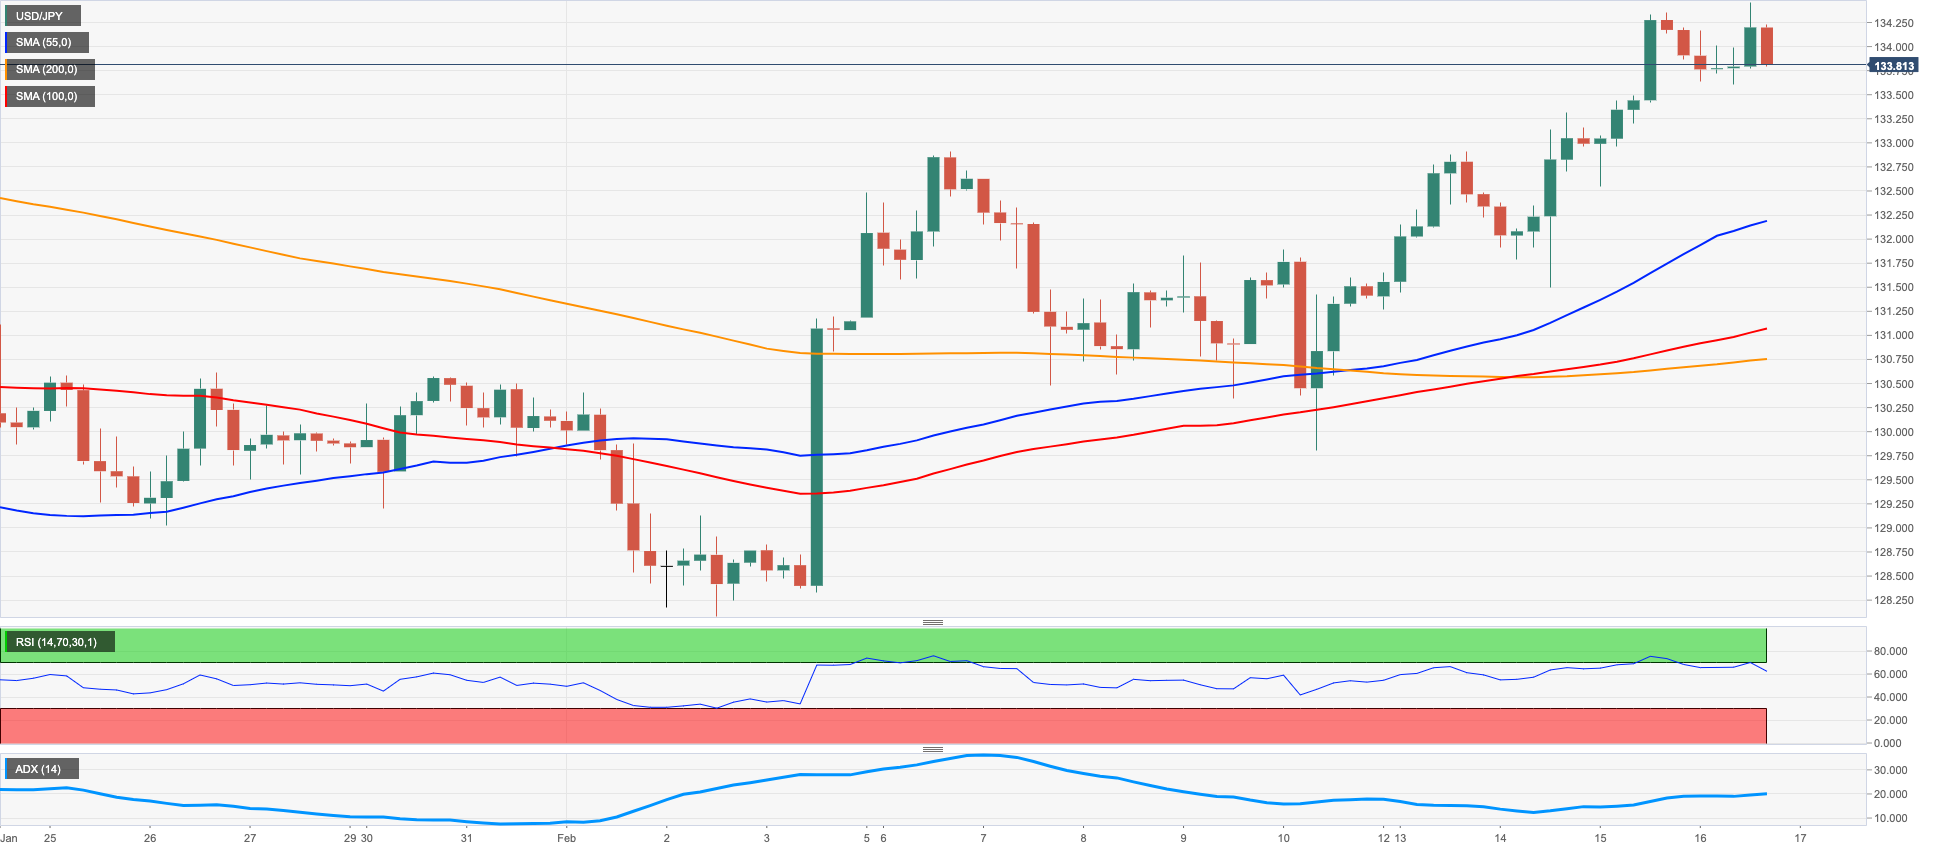
The strong weekly recovery in USD/JPY entered an impasse after the pair left behind three daily advances in a row and slipped back below the 134.00 mark on Thursday.
The corrective knee-jerk in spot was accompanied by lacklustre price action in the greenback, which was in turn reinforced by renewed weakness in US yields across the curve, while the JGB 10-year yields edged a tad higher past the 0.51% level.
In Japan, the trade deficit widened to ¥3496.6B during January, while Machinery Orders contracted at an annualized 6.6% in December. Additionally, Foreign Bond Investment rose to ¥716.5B in the week to February 11.
If USD/JPY clears the February peak at 134.35 (February 15), it could then put the 2023 high at 134.77 (January 6) to the test ahead of the key 200-day SMA at 136.87 and the temporary 100-day SMA at 137.74. North from here appears weekly tops at 138.17 (December 15 2022) and 139.89 (November 30 2022) prior to the key round level at 140.00. In the opposite direction, the breakdown of the provisional 55-day SMA at 132.35 could put a test of the weekly low at 129.79 (February 10) back to the investors’ radar before the February low at 128.08 (February 2) and the 2023 low at 127.21 (January 16). The loss of the latter could pave the way for a visit to the May 2022 low at 126.36 (May 24) ahead of the weekly low at 121.27 (March 31 2022). The daily RSI deflated to the sub-60 region.
Resistance levels: 134.35 134.77 137.47 (4H chart)
Support levels: 132.04 131.49 130.71 (4H chart)
GBPUSD
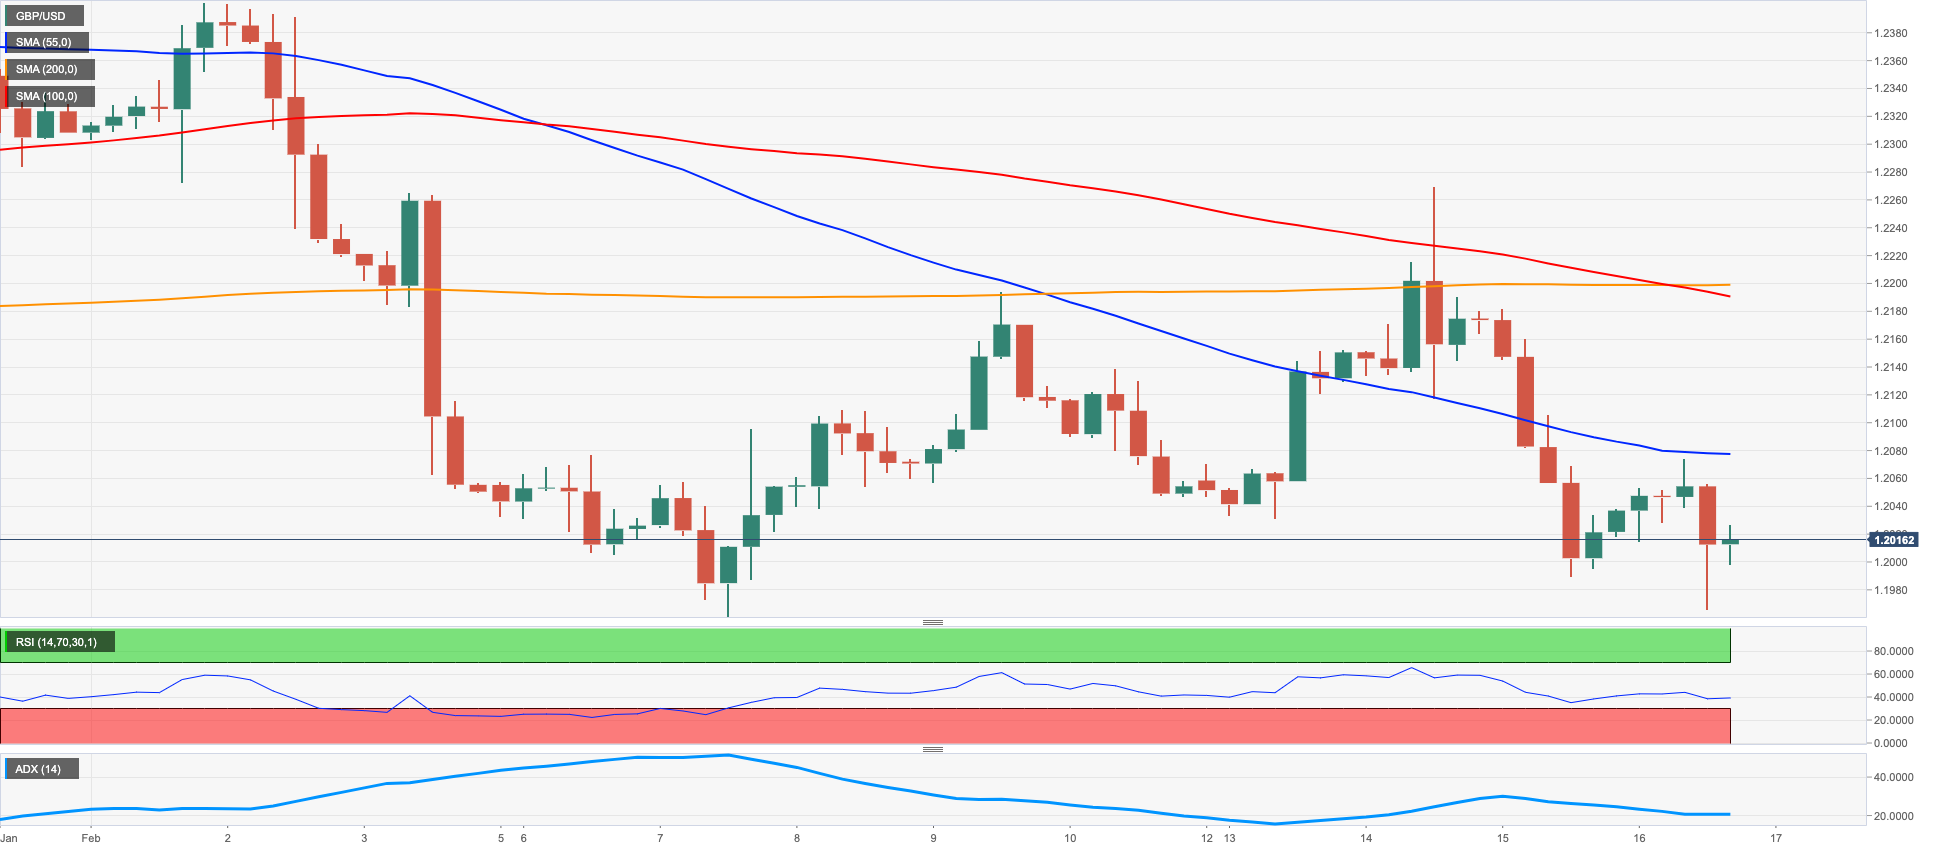
GBP/USD partially recovered some ground lost after Wednesday’s strong pullback and managed to regain the area well north of the key 1.2000 the figure on Thursday.
The tepid selling interest around the greenback was enough to spark a corrective upside in the risk complex and allowed the Sterling to retake the key 1.2000 mark, always amidst the broad-based consolidative fashion in place since early in the month.
From the BoE, H.Pill was on the wires earlier and he advocated for a slower pace of interest rate hikes and warned against risks of overtightening at the current pace. He also reiterated that the labour market remains tight.
In the UK money market, the 10-year Gilt yields followed the rest of their peers and retreated from recent multi-week tops near 3.54% (February 14).
The next data release of note in the UK calendar will be Friday’s release of Retail Sales for the month of January.
In case sellers regain control of the sentiment, they could drag GBP/USD to the February low at 1.1960 (February 7) just before the key 200-day SMA at 1.1939. Down from here emerges the temporary 100-day SMA at 1.1891 prior to the 2023 low at 1.1841 (January 6). On the other hand, the 55-day SMA at 1.2179 is expected to offer provisional resistance ahead of the weekly high at 1.2269 (February 14). The breakout of the latter could put a potential test of the 2023 top at 1.2447 (January 23) back on the radar ahead of the May 2022 peak at 1.2666 (May 27). North from here turns up the key 200-week SMA at 1.2891 ahead of the psychological 1.3000 mark. The daily RSI picked up some pace and approached 42.
Resistance levels: 1.2074 1.2193 1.2269 (4H chart)
Support levels: 1.1989 1.1960 1.1841 (4H chart)
AUDUSD
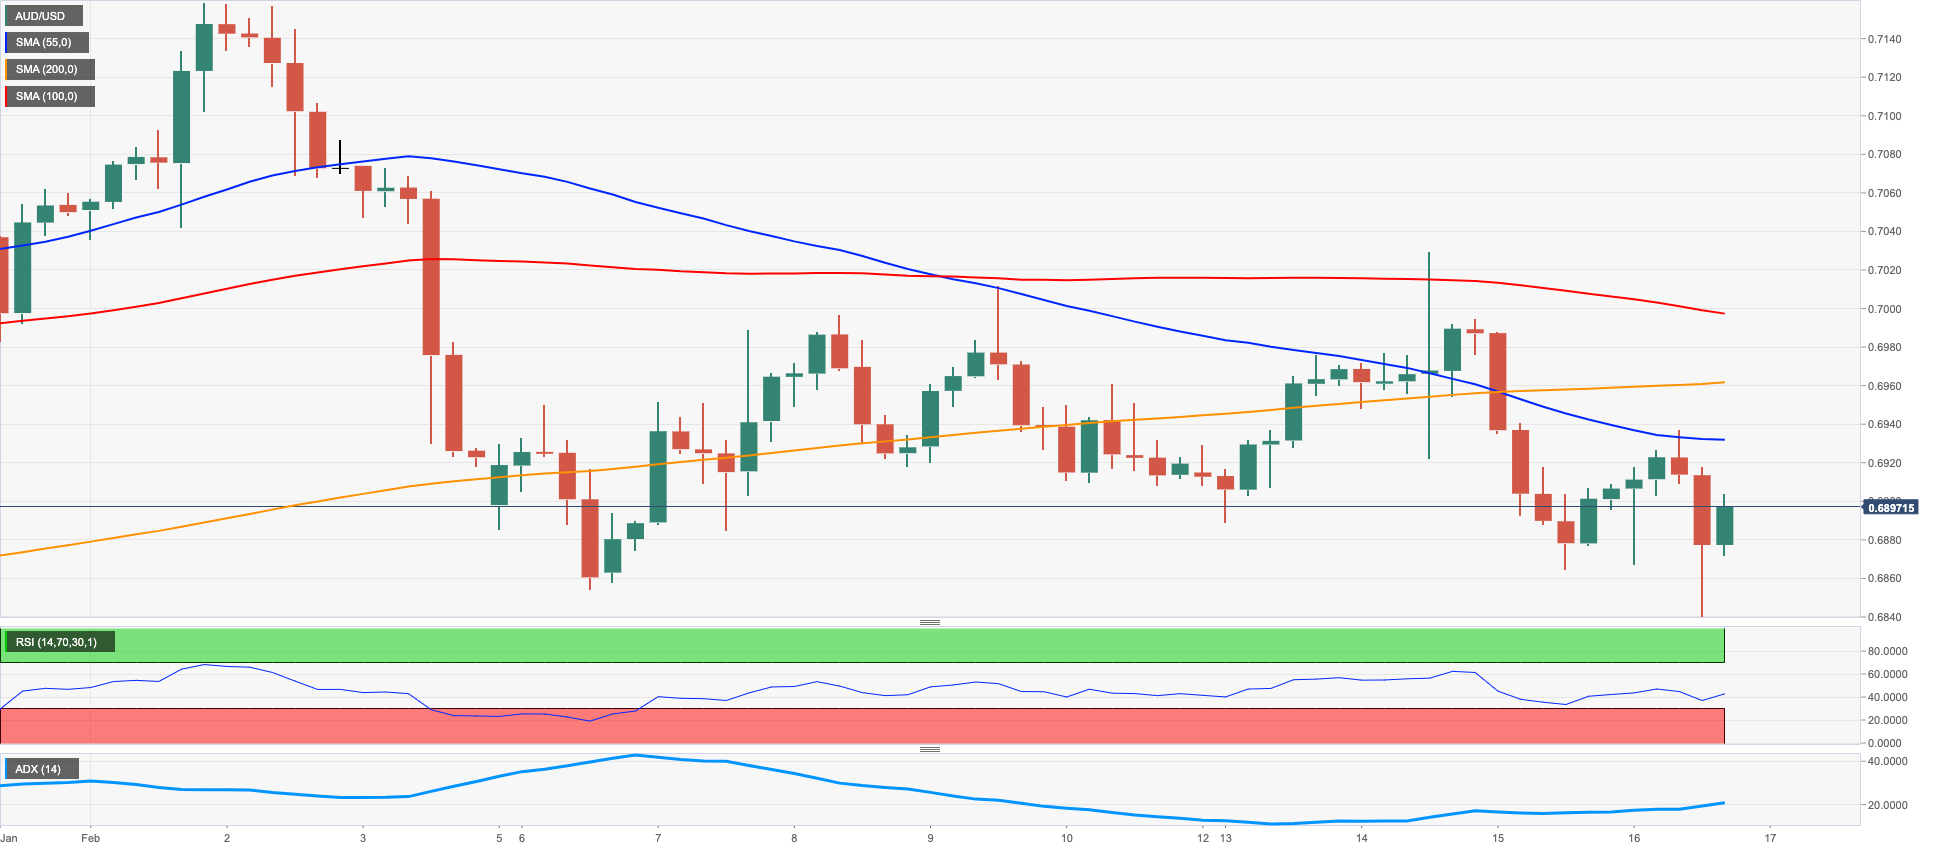
AUD/USD probed once again the area well south of the 0.6900 mark before staging a moderate comeback that left the pair around Wednesday’s closing levels on Thursday.
Fresh selling pressure hurt the greenback and opened the door to some recovery in the risk-associated assets in the second half of the week. The pair, however, kept the consolidative mood well in place and in line with the rest of its risky peers (and the greenback).
Another session of side-lined trade in the commodity complex did not offer much in terms of support to the Aussie dollar either, with copper prices regaining the smile after Wednesday’s decline and the iron ore treading water around the $125.00 region per tonne.
Also weighing on the AUD appeared the disheartening prints from the Australian jobs report, where the Employment Change shrank by 11.5K people and the Unemployment Rate ticked higher to 3.7%. Additional data saw February’s Consumer Inflation Expectations drop to 5.1% (from 5.6%).
Further weakness could force AUD/USD to revisit the February low at 0.6855 (February 6) ahead of the key 200-day SMA at 0.6804. If this region is cleared, then the pair could dispute the 2023 low at 0.6688 (January 3) prior to the December 2022 low at 0.6629 (December 20). By contrast, the next up barrier aligns at the weekly high at 0.7029 (February 14) seconded the 2023 top at 0.7157 (February 2). The surpass of this level could prompt a test of the round level at 0.7200 to emerge on the horizon before the June 2022 peak at 0.7282 (June 3). The daily RSI slipped back to the vicinity of 46.
Resistance levels: 0.6956 0.7029 0.7072 (4H chart)
Support levels: 0.6864 0.6855 0.6722 (4H chart)
GOLD
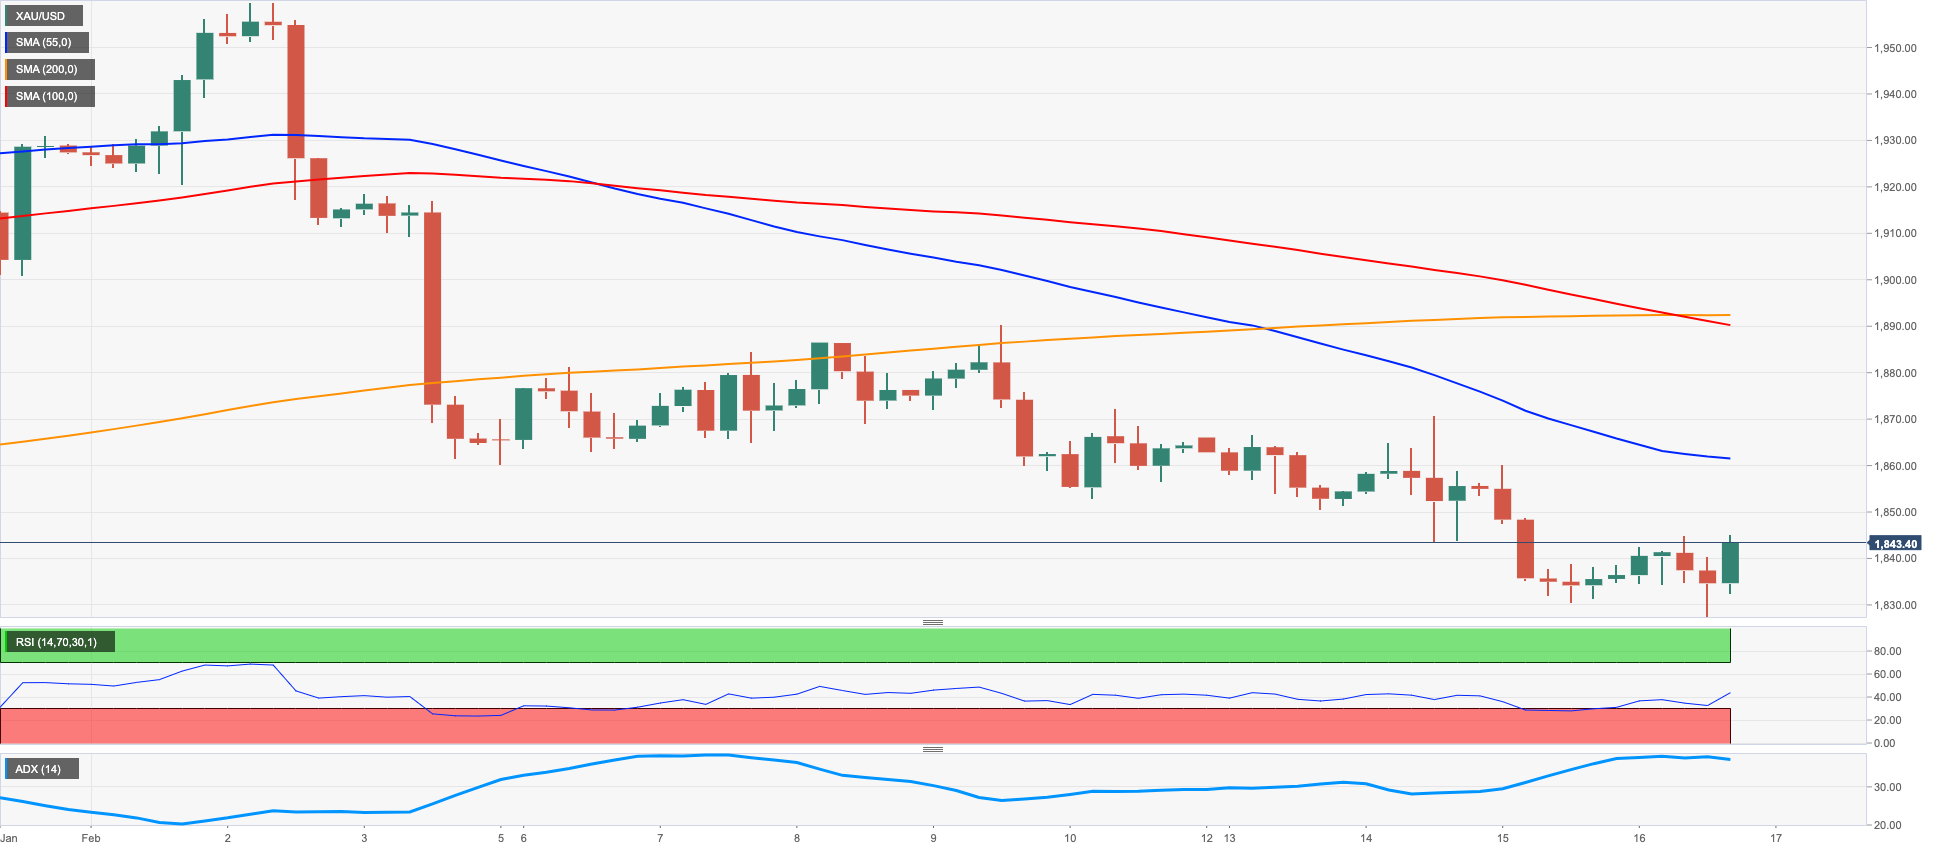
Another volatile session in the dollar encouraged buyers to return to the markets and lifted the yellow metal back to the $1850 zone.
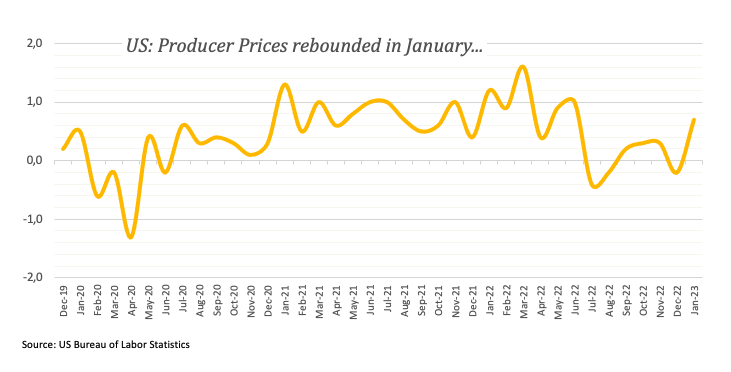
Once again, the greenback managed to pick up extra pace in the wake of higher-than-expected results in the US docket (this time from Producer Prices), motivating the USD Index (DXY) to reclaim the proximity of the 104.00 mark. The uptick, however, fizzled out afterwards and allowed the change of direction in the precious metal.
In addition, US yields rapidly abandoned the earlier pessimism and reversed course to extend further the ongoing monthly recovery, limiting the upside in bullion.
A deeper retracement in gold is expected to meet the next contention of note at the key $1800 region ahead of the interim 100-day SMA at $1781 and the more relevant 200-day SMA at $1776. The breach of this region could prompt a test of the weekly low at $1727 (November 23) to start shaping up in the near term. On the flip side, the surpass of the provisional 55-day SMA at $1853 should open the door to a quick move to the weekly peak at $1890 (February 9) ahead of the 2023 high at $1959 (February 2) and the April 2022 top at $1998 (April 18), all preceding the psychological $2000 mark and the 2022 peak at $2070 (March 8).
Resistance levels: $1845 $1870 $1890 (4H chart)
Support levels: $1827 $1797 $1784 (4H chart)
CRUDE WTI
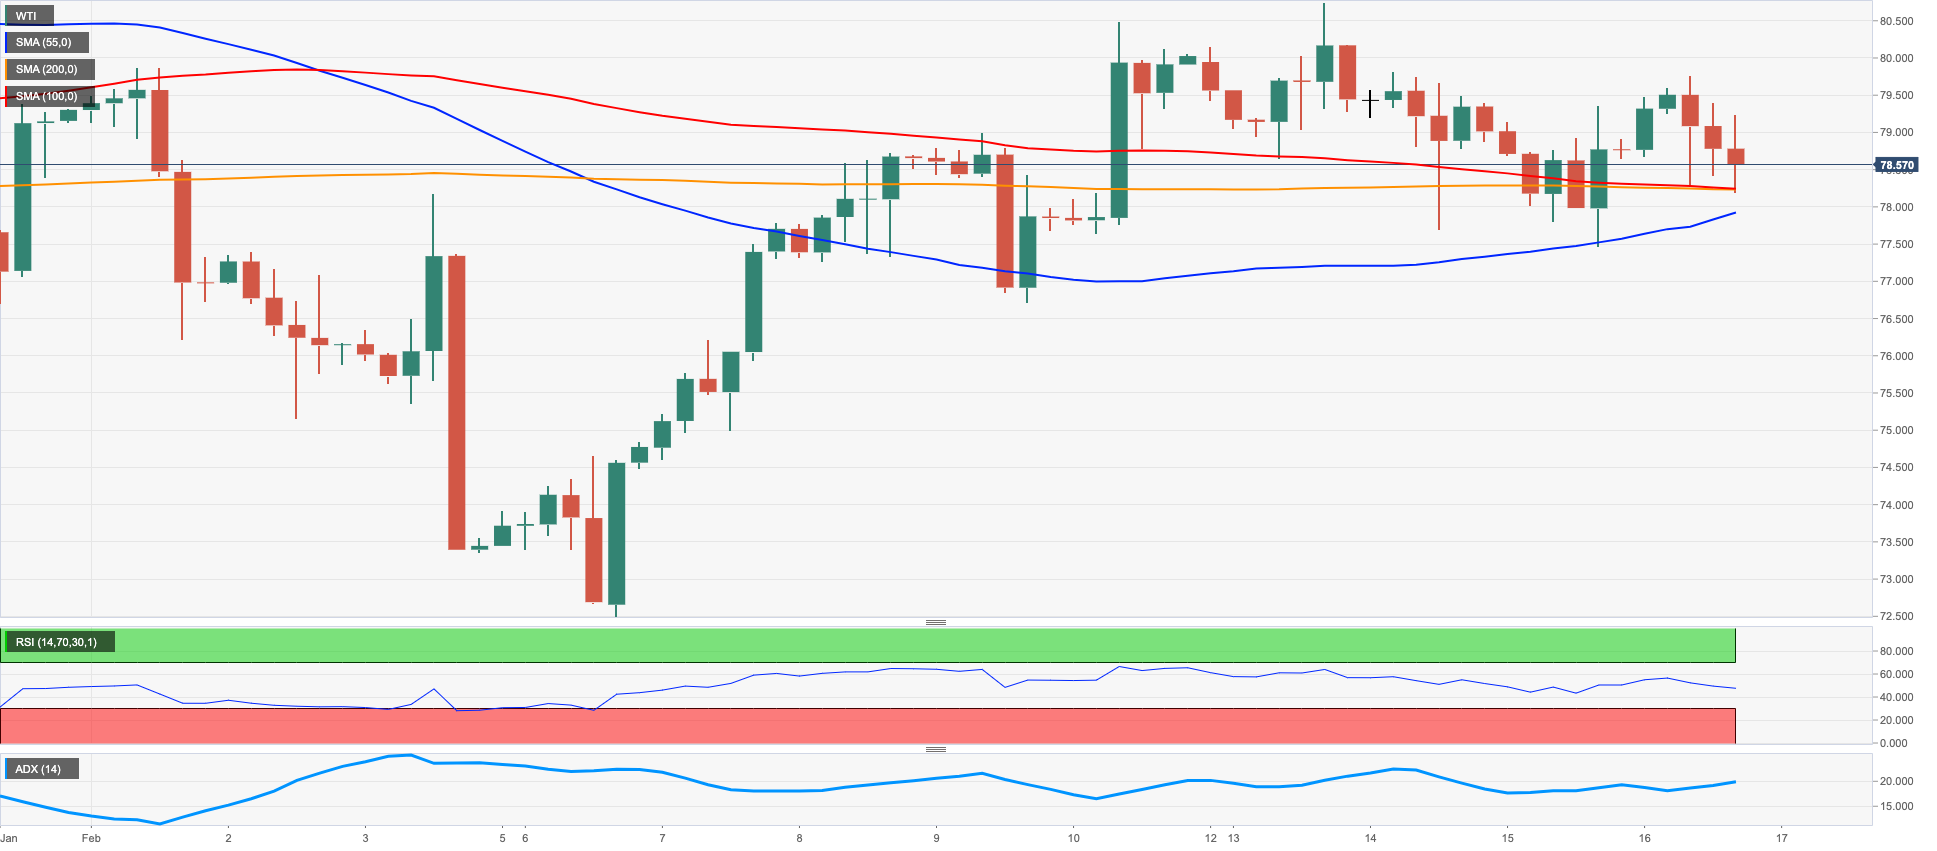
WTI prices alternated gains with losses on Thursday after a failed attempt to advance further north of the $79.50 level.
In fact, prices of the commodity kept the weekly consolidation well in place, as traders continued to assess the prospects for further tightening by the Federal Reserve and a potential slowdown of the economic activity coupled with the gigantic weekly build in US crude oil supplies, as reported by the EIA on Wednesday, and the stronger dollar.
Supporting prices emerged the ongoing Chinese reopening along with the IEA’s projection of a higher crude oil demand for the current year and speculation of a reduced Russian oil output.
Immediately to the upside for the WTI aligns the February top at $80.57 (February 13) just ahead of the temporary 100-day SMA at $81.03 and the 2023 peak at $82.60 (January 23). The surpass of this region could lead up to a test of the December 2022 high at $83.32 (December 1) seconded by the $90.08 level (November 11 2022). Having said that, the 2023 low at $72.30 (February 6) is expected to hold the initial downside test prior to the 2022 low at $70.10 (December 9), which is closely followed by the key round level at $70.00 and the weekly low at $66.15 (December 20 2021).
Resistance levels: $79.50 $80.57 $82.44 (4H chart)
Support levels: $77.22 $76.50 $74.72 (4H chart)
GER40
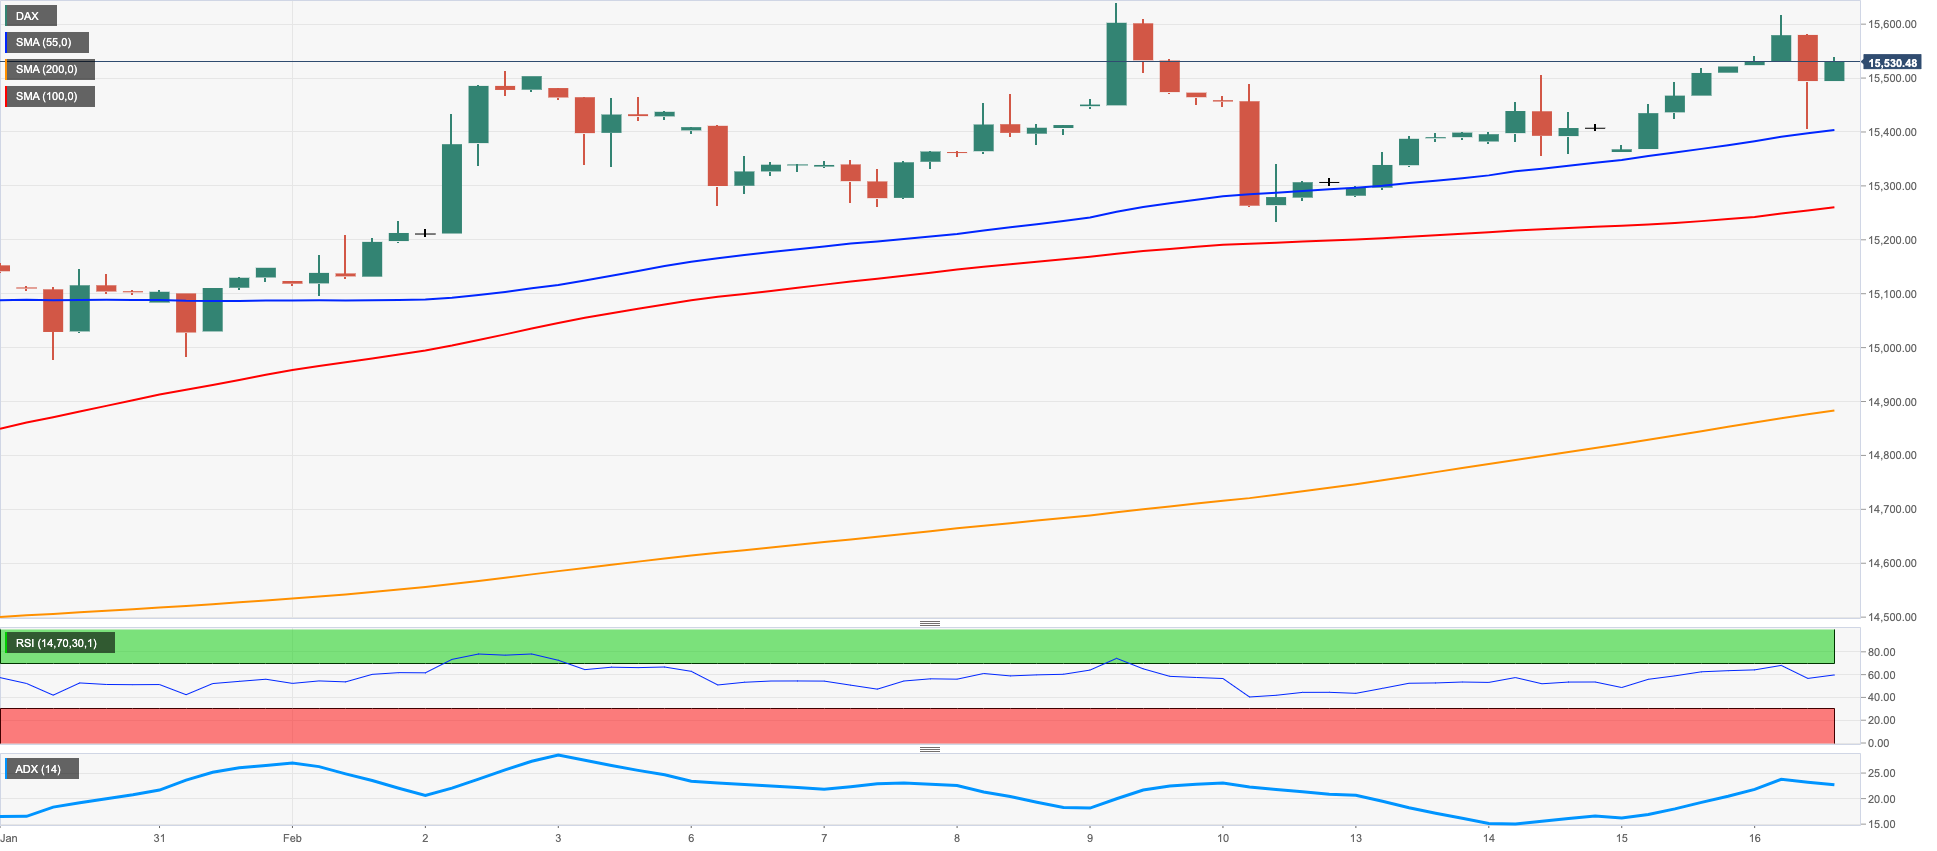
Equities gauged by the German benchmark DAX40 added to Wednesday’s uptick and ended the session above the 15500 mark, just below the so far 2023 high.
In fact, optimism among traders rose following the positive tone in Wall St in the previous session, where stronger-than-expected US Retail Sales supported the perception of a resilient US economy.
In addition, positive results from corporate earnings in the rest of the European markets also helped with the upbeat tone among investors.
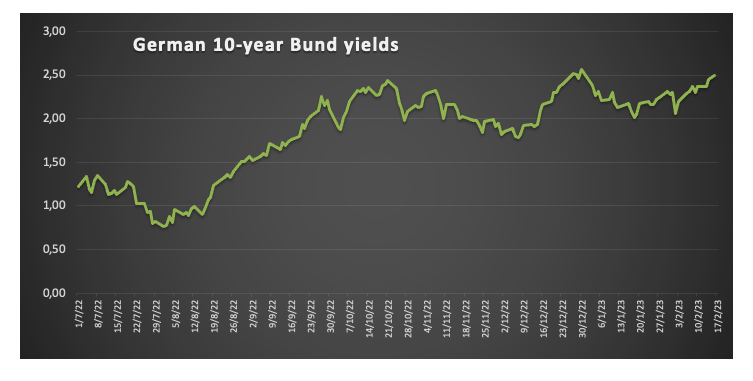
In the money market, the 10-year Bund yields surpassed the key 2.50% level for the first time since early January.
The DAX40 now trades at shouting distance from the 2023 high at 15658 (February 9). If the index clears this level, it could then put the February 2022 top at 15736 (February 2 2022) back on the radar prior to the round level at 16000 and the 2022 peak at 16285 (January 5). On the opposite side, the weekly low at 15246 (February 10) still emerges as the initial content zone before the weekly low at 14906 (January 19) and the provisional 55-day SMA at 14730. The breach of this region leaves the index vulnerable to a deeper drop to the December 2022 low at 13791 (December 20) ahead of the key 200-day SMA at 13718 and the November 2022 low at 13022 (November 3). The daily RSI gathered extra steam and surpassed the 65 mark.
Best Performers: Airbus Group, Deutsche Bank AG, Adidas
Worst Performers: Zalando SE, Siemens Healthineers, Vonovia
Resistance levels: 15634 15658 15736 (4H chart)
Support levels: 15246 14995 14906 (4H chart)
NASDAQ
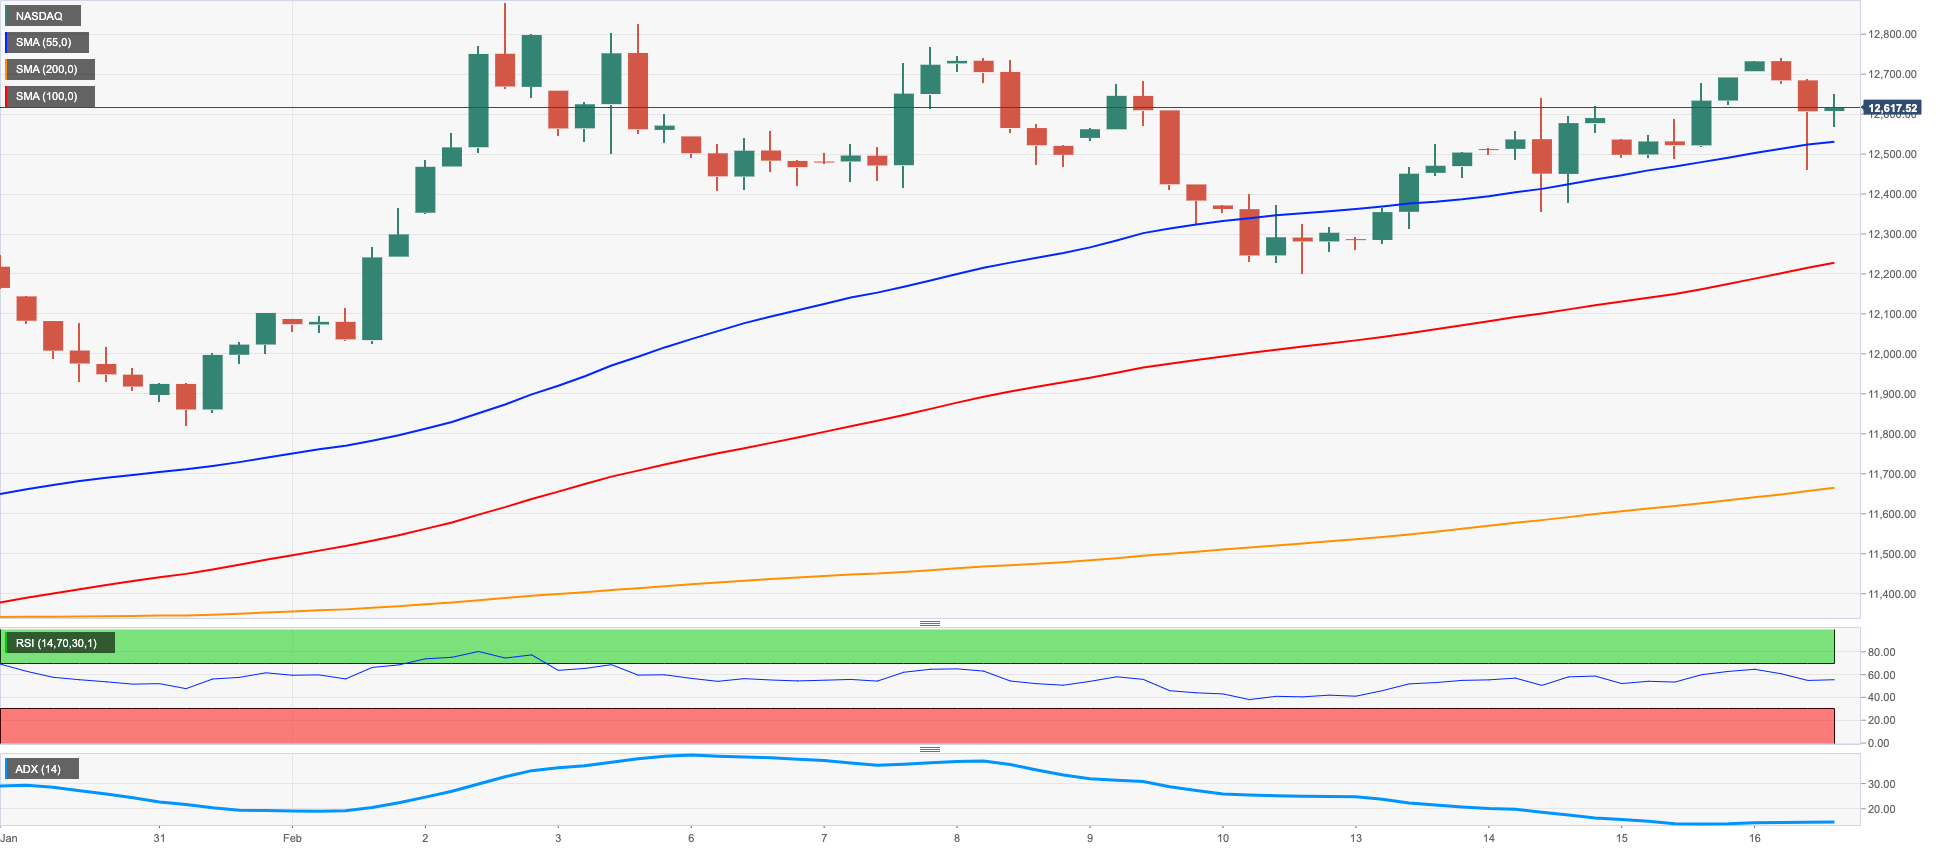
Tech equities measured by the Nasdaq 100 reversed three consecutive daily advances and charted moderate losses on Thursday.
This time, the better tone in the dollar and further recovery in US yields weighed on investors after another higher-than-expected readings from US Producer Prices and the relentless tightness in the labour market reinforced the Fed’s hawkish narrative.
Additionally, negative news from electric car maker Tesla also put the index under some extra pressure.
Next on the upside for the Nasdaq 100 appears the 2023 high at 12880 (February 2) prior to the round level at 13000 and ahead of the weekly peak at 13175 (August 26 2022). For all that, bears continue to target the weekly low at 12375 (February 10) prior to the key 200-day SMA at 11924 and weekly lows at 11550 (January 25) and 11251 (January 19). The breakdown of the latter exposes a move to the January low at 10696 (January 6) before the December 2022 low at 10671 (December 22) and the November 2022 low at 10632 (November 4). The daily RSI grinded lower to the 61 region.
Top Gainers: Seagen, Cisco, JD.com Inc Adr
Top Losers: Datadog, Synopsys, Zscaler
Resistance levels: 12688 12771 12880 (4H chart)
Support levels: 12204 11906 11550 (4H chart)
DOW JONES
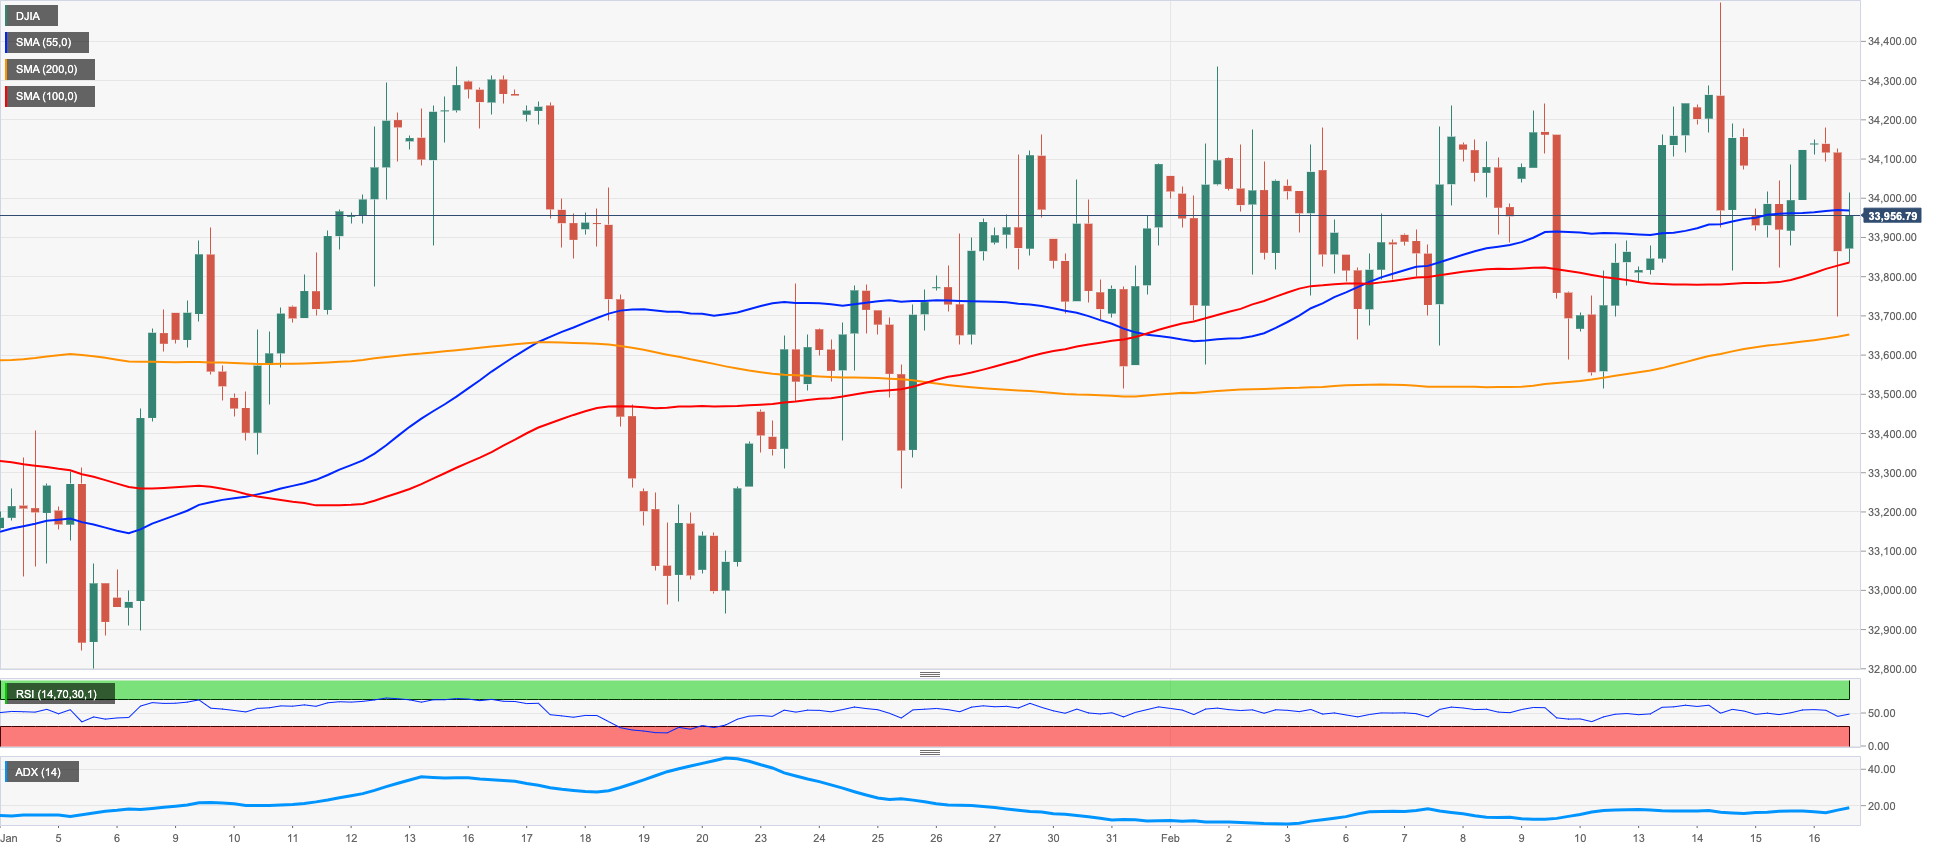
Another set of strong results from US fundamentals - this time Producer Prices – in combination with further evidence that the labour market remains far from losing momentum – according to weekly Claims- hurt the investors’ sentiment and dragged equities tracked by the Down Jones to the negative territory on Thursday.
in addition, the hawkish message from Cleveland Fed’s L.Mester also collaborated with the selling pressure in US stocks and underpinned the bounce in both the dollar and US yields.
All in all, the Dow Jones dropped 0.45% to 33973, the S&P500 retreated 0.50% to 4126 and the tech-heavy Nasdaq Composite deflated 0.63% to 11995.
The prospect for further near-term consolidation looks unchanged for the Dow Jones. Against that, the immediate hurdle comes at the 2023 top at 34342 (January 13) prior to the December 2022 peak at 34712 (December 13). Once this level is cleared, the index could revisit the April 2022 high at 35492 ahead of the February 2022 top at 35824 (February 9). The other way around, the February low at 33581 (February 1) lines up as the initial support before the weekly low at 32948 (January 20) and the December 2022 low at 32573 (December 22). South from here, a probable move to the key 200-day SMA at 32344 could start shaping up. The daily RSI lost further momentum and approached the 52 area.
Top Performers: Cisco, Home Depot, UnitedHealth
Worst Performers: Walt Disney, Microsoft, Amgen
Resistance levels: 34334 34712 35492 (4H chart)
Support levels: 33581 33273 32948 (4H chart)
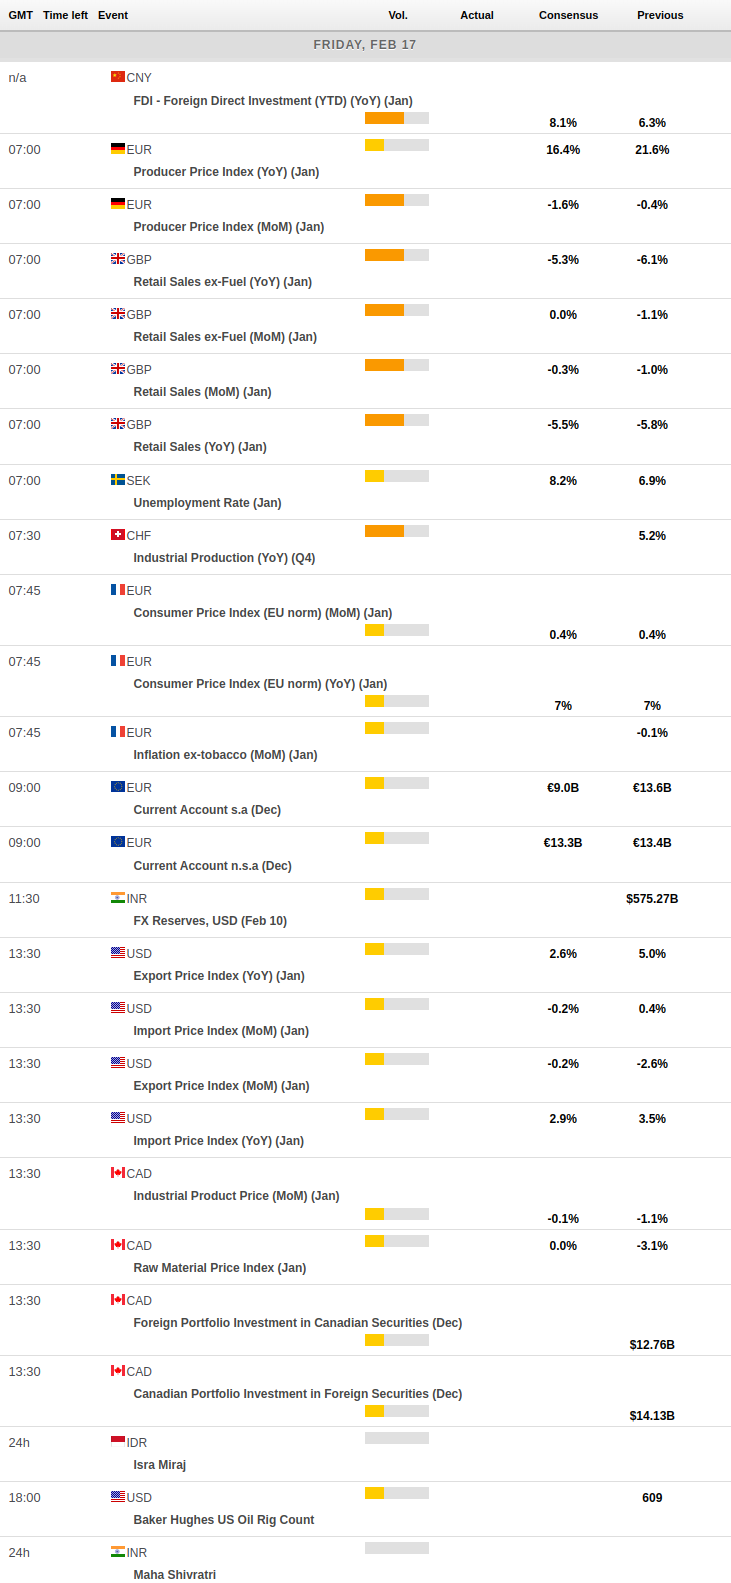
MACROECONOMIC EVENTS
All Information & Updates provided by:

All information relating to the financial markets available on this page has been prepared and issued by FXStreet (Forexstreet SL, Spain, Reg: B62498233) on the basis of publicly available information and all information believed to be reliable and does not conflict with Kuwaiti local laws, and all necessary care has been taken to before the company to ensure that the facts mentioned are correct from the source.
NCM Investment nor any of its directors or employees shall in any way be held responsible for the contents of this news, and the information contained on this page is intended only to provide clients with publicly available information and should not be construed as investment advice, report or analysis and/or constitute an offer or invitation to buy or sell financial instruments of any kind.
RISK WARNING: Forex and CFDs are highly risky leveraged products, as losses can exceed deposits. Please ensure you understand all the risks and take independent advice if necessary. NCM will segregate the clients based on the criteria of the regulator and its bylaws. NCM does not provide any advisory service; the material published does not constitute advice or a recommendation for a transaction in any financial instrument. NCM accepts no responsibility for any use of the content presented and any consequences of that use. Anyone acting on the information provided does so at their own risk.