
- Contact Us:
-

-

-

-


Daily Market Updates
20 Feb 2023
USDJPY
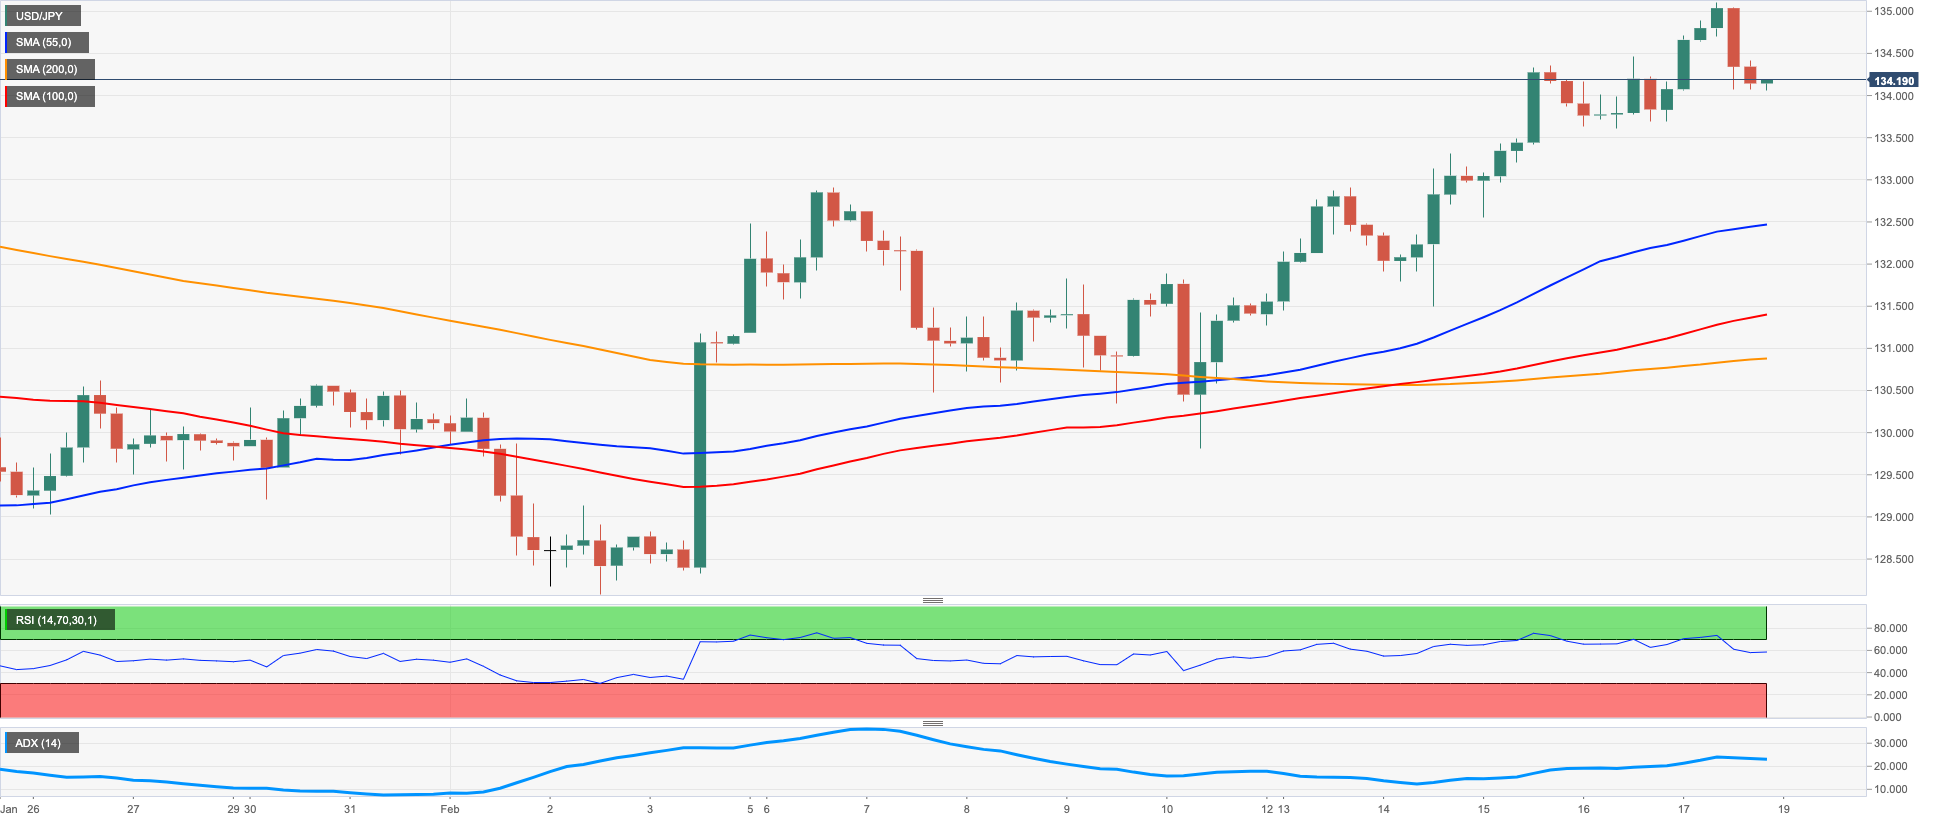
USD/JPY ended Friday’s session with decent gains in the low-134.00s after coming under pressure following an earlier move to the area north of the 135.00 barrier, or new 2023 highs.
The uptick in the pair was mainly underpinned by the strong rebound in the greenback – mostly in the first part of the session – as well as the continuation of the move up in US yields prior to make a U-turn towards the end of the session, all on the back of a plethora of hawkish comments from Fed’s policy makers.
There were no data releases in the Japanese docket on Friday, leaving the attention to the publication of flash PMIs on February 21.
USD/JPY prints a new 2023 peak at 135.11 (February 17). Extra gains beyond this level is expected to revisit the key 200-day SMA at 136.90 closely followed by the provisional 100-day SMA at 137.63. North from here comes weekly highs at 138.17 (December 15 2022) and 139.89 (November 30 2022) ahead of the key round level at 140.00. On the other hand, the interim 55-day SMA at 132.35 offers temporary contention before the weekly low at 129.79 (February 10) and ahead of the February low at 128.08 (February 2) and the 2023 low at 127.21 (January 16). South from here turns up the May 2022 low at 126.36 (May 24) prior to the weekly low at 121.27 (March 31 2022). The daily RSI advanced marginally above 61.
Resistance levels: 135.11 137.47 138.17 (4H chart)
Support levels: 133.92 133.60 131.49 (4H chart)
GBPUSD
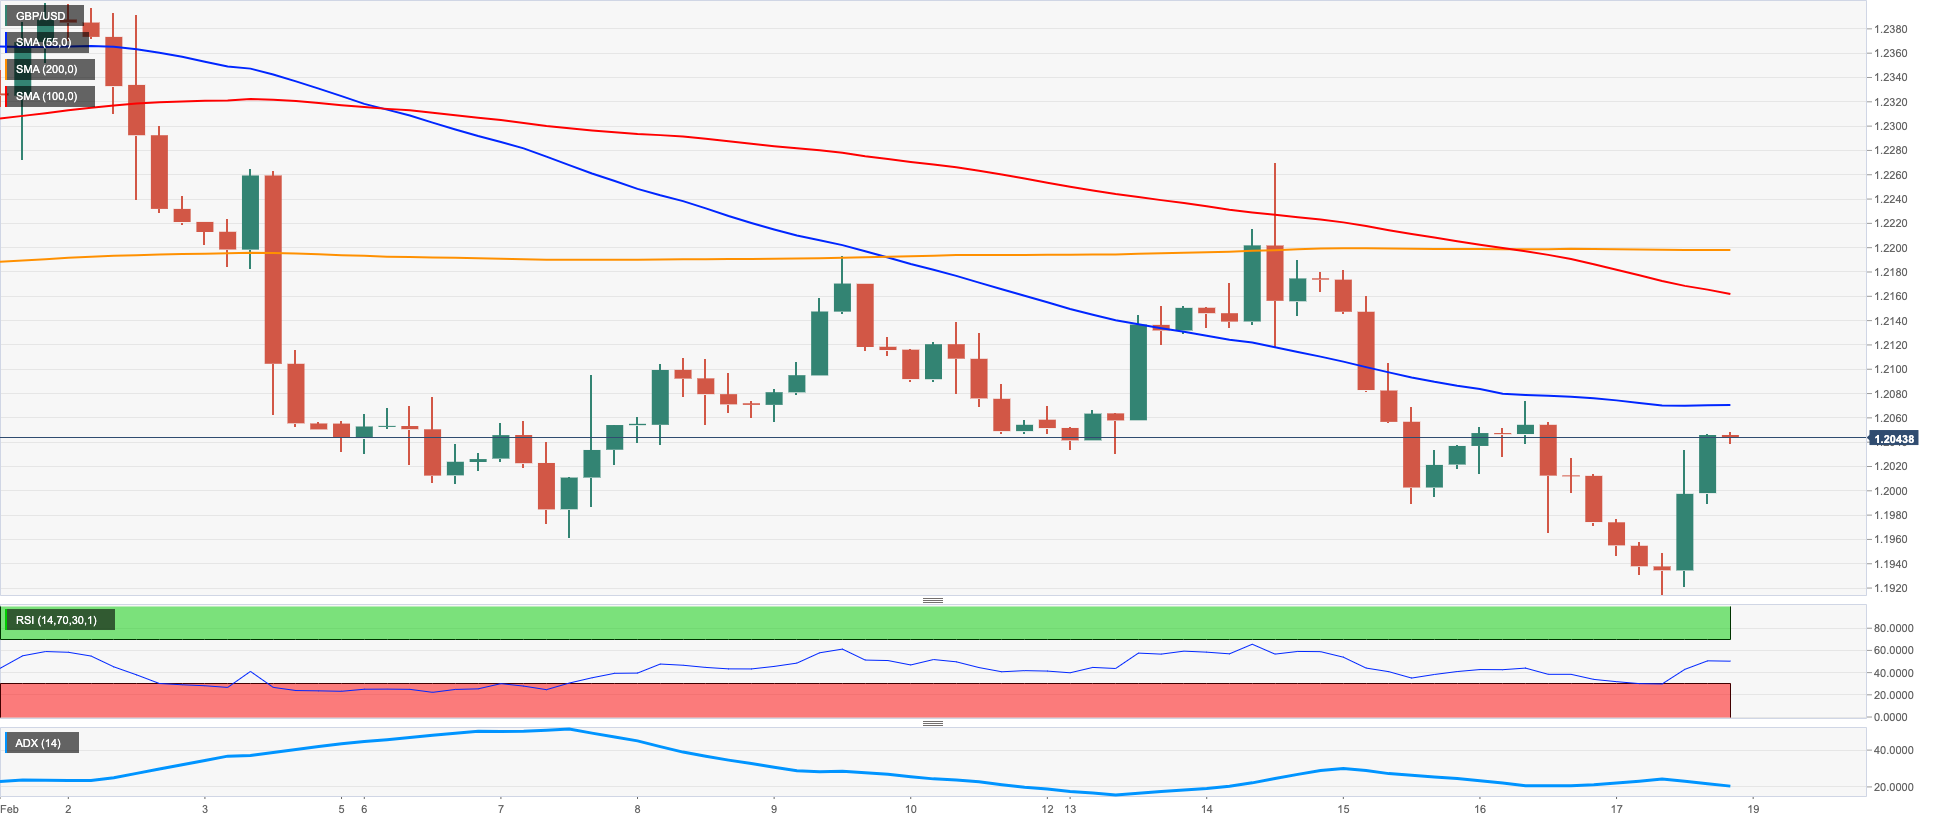
GBP/USD followed the rest of its risky peers and rebounded sharply at the end of the week.
That said, Cable reversed course and managed to leave behind a daily pullback to new 6-week lows near the 1.1900 region, as the greenback succumbed to the selling pressure soon after hitting multi-week highs near 104.70 when gauged by the USD Index (DXY).
In the UK docket, Retail Sales expanded at a monthly 0.5% in January and contracted 5.1% over the last twelve months.
Next on the downside for GBP/USD emerges the new February low at 1.1914 (February 17) just ahead of the temporary 100-day SMA at 1.1900 and the 2023 low at 1.1841 (January 6). Just the opposite, there is a temporary hurdle at the 55-day SMA at 1.2173 before the weekly top at 1.2269 (February 14). The surpass of this level could prompt a visit to the 2023 peak at 1.2447 (January 23) on the horizon prior to the May 2022 high at 1.2666 (May 27). Further up aligns the key 200-week SMA at 1.2891 seconded by the psychological 1.3000 level. The daily RSI rebounded north of the 43 mark.
Resistance levels: 1.2049 1.2074 1.2193 (4H chart)
Support levels: 1.1914 1.1841 1.1778 (4H chart)
AUDUSD
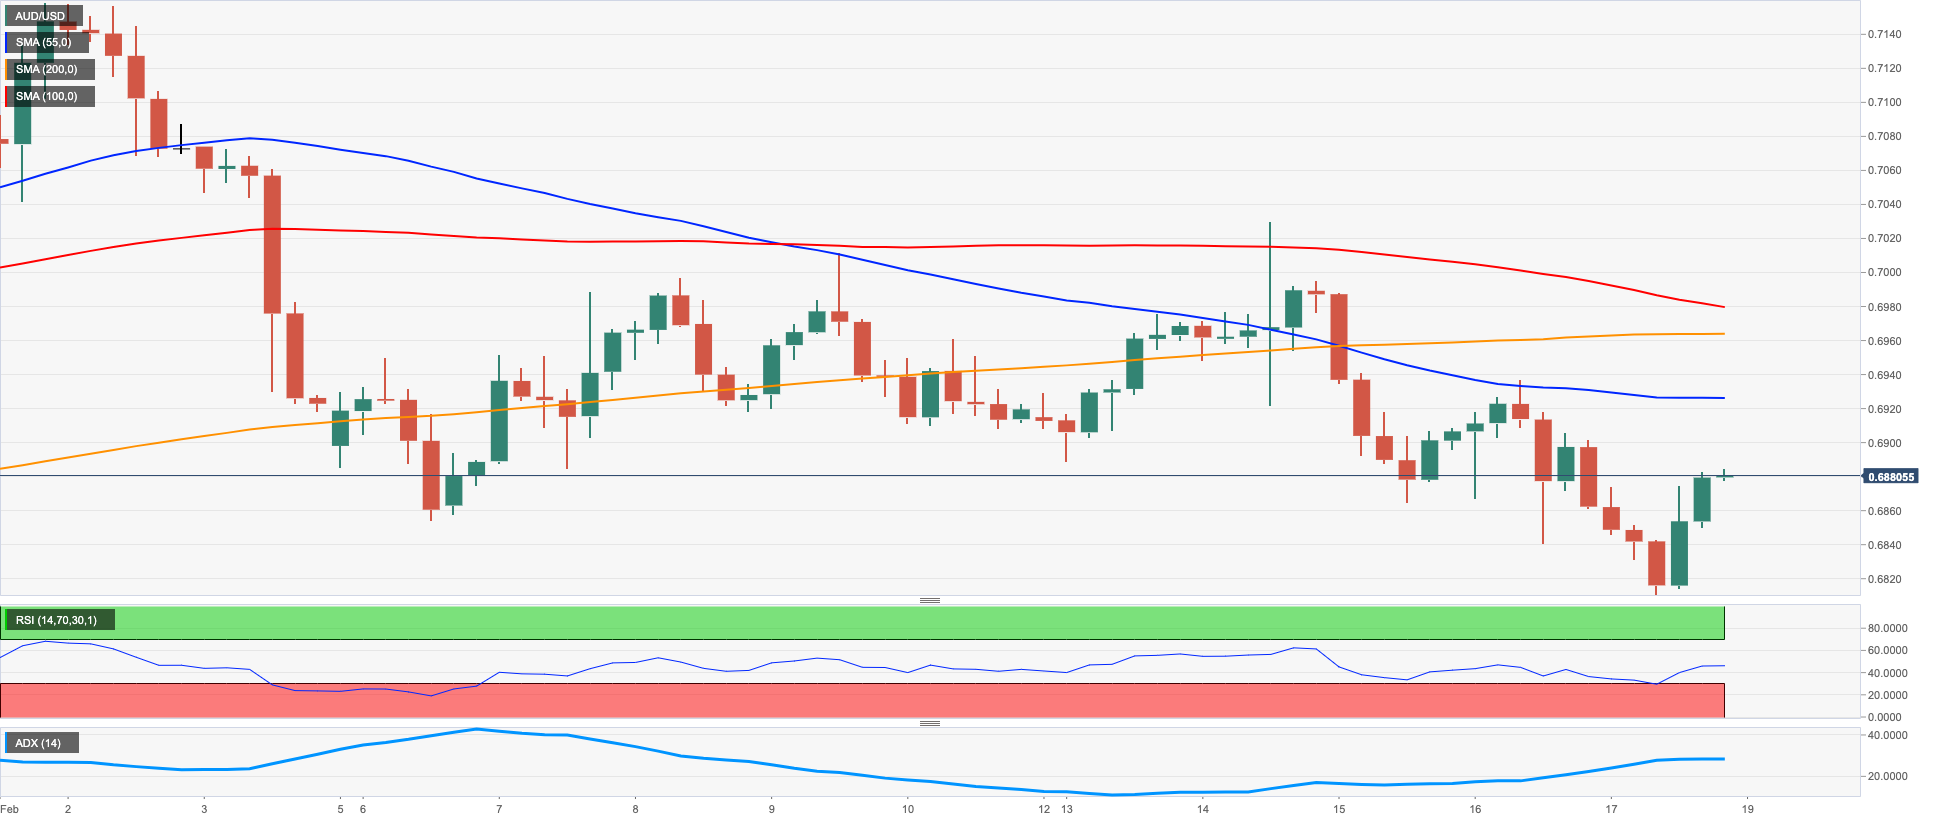
After bottoming out in the area of multi-week lows near the 0.6800 region, AUD/USD attempted a bullish move and trimmed almost all those losses to close Friday’s session around the previous day’s closing levels near 0.6880.
The late and quite moderate corrective downside in the greenback sparked an equally strong bounce in the Aussie dollar, which was later sustained by some tepid recovery in the commodity complex, where copper prices deflated marginally from the previous session and iron ore posted small gains.
The speech by RBA Governor R.Lowe was the sole release in Oz on Friday. Lowe anticipated further interest rate hikes in the next months, adding that the bank is aware of the uneven impact of higher interest rates across the community. Lowe also added that demand could be losing traction and suggested that the effects of this ongoing tightening cycle will be fully felt during next year.
The loss of the February low at 0.6811 (February 17) comes just ahead of the key 200-day SMA at 0.6802. Once AUD/USD clears the latter, it could then embark on a deeper retracement to the 2023 low at 0.6688 (January 3) ahead of the December 2022 low at 0.6629 (December 20). In the opposite direction, the weekly top at 0.7029 (February 14) emerges as the initial up barrier prior to the 2023 peak at 0.7157 (February 2). North from here turns up the round level at 0.7200 ahead of the June 2022 high at 0.7282 (June 3). The daily RSI looked consolidative above 44.
Resistance levels: 0.6884 0.6936 0.6959 (4H chart)
Support levels: 0.6811 0.6722 0.6688 (4H chart)
GOLD
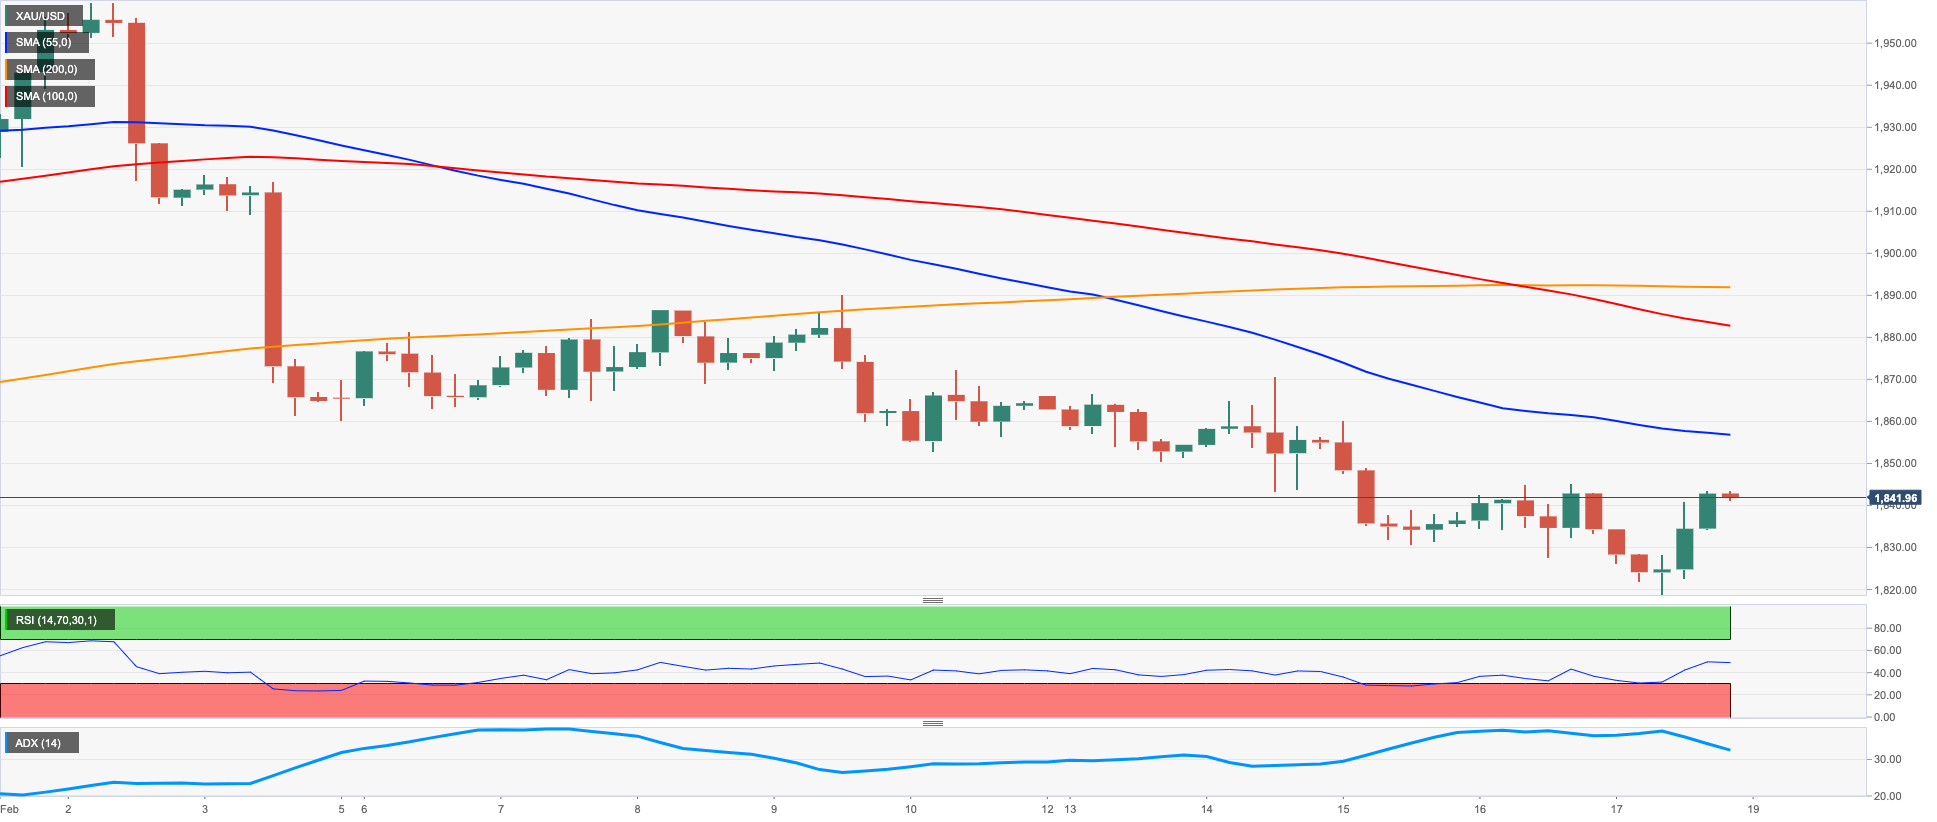
Gold prices bounced off new 2023 lows in the $1820 region per ounce troy and managed to close the second session with gains following Thursday’s marginal advance.
The late drop in the greenback sponsored the change of direction in the yellow metal after the USD Index (DXY) fully eroded the move to multi-week tops well north of the 104.00 mark.
Also collaborating with the daily advance in bullion was the corrective decline in US yields across the curve after, once again, hitting peaks seen several weeks ago.
If gold breaks below the new 2023 low at $1818 (February 17) it could then spark a potential decline to the key $1800 region prior to the provisional 100-day SMA at $1783 and the more significant 200-day SMA at $1776. Down from here emerges the weekly low at $1727 (November 23). By contrast, there is a temporary resistance level at the 55-day SMA at $1854 prior to the weekly high at $1890 (February 9) and the 2023 top at $1959 (February 2). North from here appears the April 2022 peak at $1998 (April 18) ahead of the psychological $2000 mark and the 2022 high at $2070 (March 8).
Resistance levels: $1845 $1870 $1890 (4H chart)
Support levels: $1818 $1797 $1784 (4H chart)
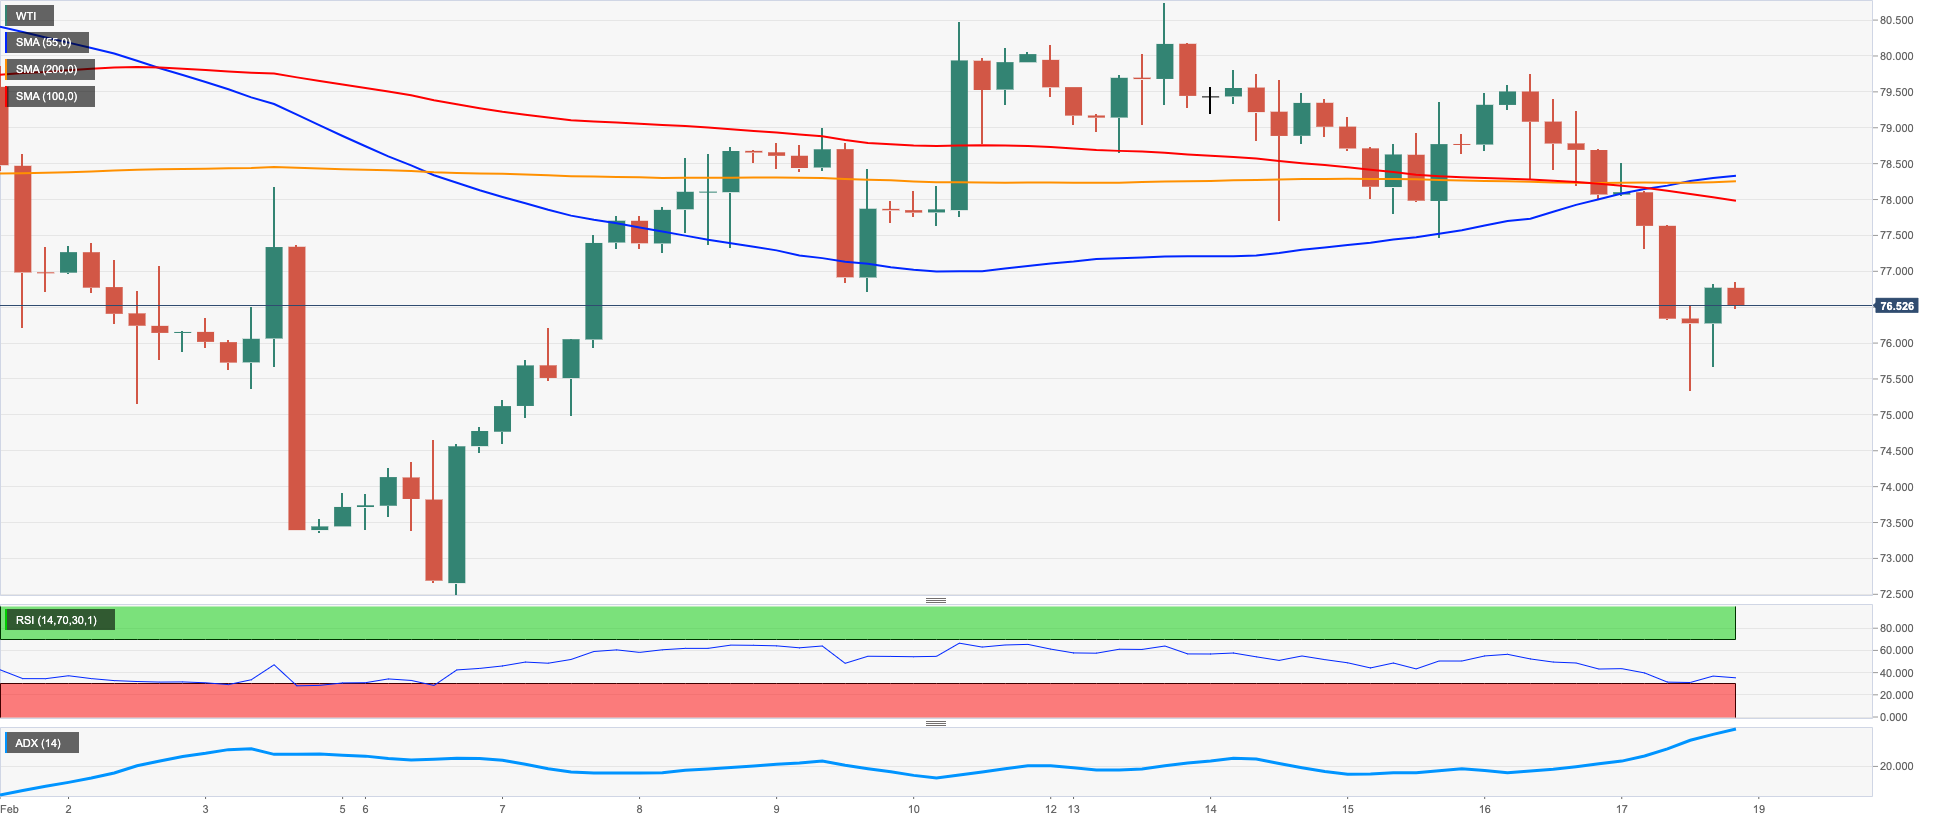
CRUDE WTI
Prices of the WTI closed with losses every day of the week, coming under relentless downside pressure after hitting new monthly highs past the $80.00 mark per barrel on February 13.
Concerns around a potential economic slowdown continued to weigh on traders’ sentiment following another wave of hawkish remarks from Fed’s rate setters, while another huge build in US crude oil supplies – as per the EIA’s weekly report – and news that Russian crude oil producers intend to maintain their exports levels also collaborated with the downbeat mood around the commodity, this time from the supply side.
On the demand side of the equation, the Chinese reopening and auspicious prospects from agencies EIA and IEA appear to have limited the downside somewhat.
In the calendar, the US oil rig count went down by 2 in the week to February 17 to 607 total active oil rigs, as per the usual weekly report on the US drilling activity by Baker Hughes.
WTI faces immediate contention at the weekly low at $75.36 (February 17) ahead of the 2023 low at $72.30 (February 6). The loss of the latter exposes a move to the 2022 low at $70.10 (December 9) just ahead of the key round level at $70.00 and the weekly low at $66.15 (December 20 2021). In the opposite direction, initial resistance emerges at the February peak at $80.57 (February 13), which appears reinforced by the interim 100-day SMA at $80.97 and the 2023 high at $82.60 (January 23). North from here, the commodity could challenge the December 2022 top at $83.32 (December 1) prior to the $90.08 level (November 11 2022).
Resistance levels: $78.02 $79.50 $80.57 (4H chart)
Support levels: $75.29 $72.22 $70.07 (4H chart)
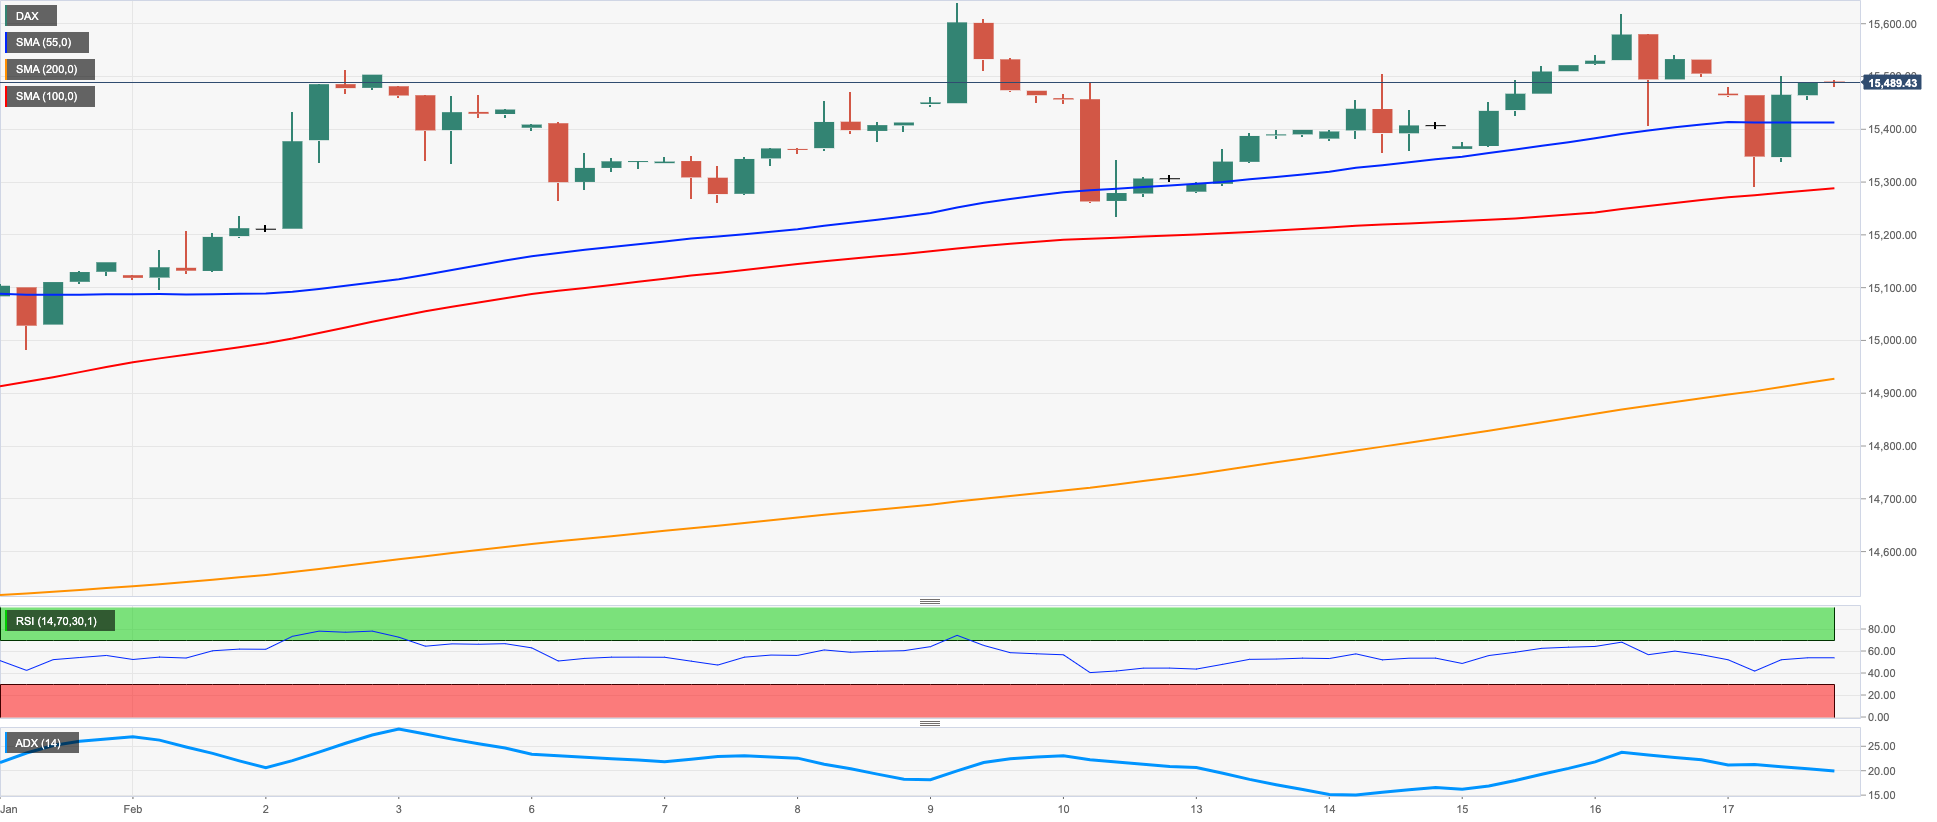
GER40
The German stock reference DAX40 eased to multi-day lows on Friday, although it managed well to keep weekly gains in place and close to the upper end of the recent range near the 15500 zone.
Investors’ concerns over the continuation of the tightening cycle by both the Federal Reserve and the European Central Bank (ECB) remained well and sound during this week, supported at the same time by firm results in fundamentals on both sides of the ocean and hawkish remarks from rate setters.
Supporting the above, ECB Board member I.Schnabel suggested in an interview that markets may be underestimating the current persistent inflation in the euro bloc, adding that elevated consumer prices might prove to be more persevering that initially thought.
In the German bond market, the 10-year Bund yields receded to the vicinity of the 2.40% region after three consecutive daily advances.
In the German docket, Producer Prices contracted at a monthly 1.0% in January and rose 17.8% vs. the same month of 2022.
The DAX40 faces immediate contention at the weekly low at 15246 (February 10) seconded by another weekly low at 14906 (January 19). The loss of this level could open the door to a drop to the interim 55-day SMA at 14748 seconded by December 2022 low at 13791 (December 20) and the key 200-day SMA at 13727. The other way around, the 2023 top at 15658 (February 9) still emerges as the next up barrier followed by the February 2022 peak at 15736 (February 2 2022). Once the index leaves this region behind, it could confront the round level at 16000 seconded by the 2022 high at 16285 (January 5). The daily RSI deflated to the sub-63 area.
Best Performers: Daimler, E.ON SE, MTU Aero
Worst Performers: Infineon, Allianz, Sartorius AG VZO
Resistance levels: 15634 15658 15736 (4H chart)
Support levels: 15300 15246 15103 (4H chart)
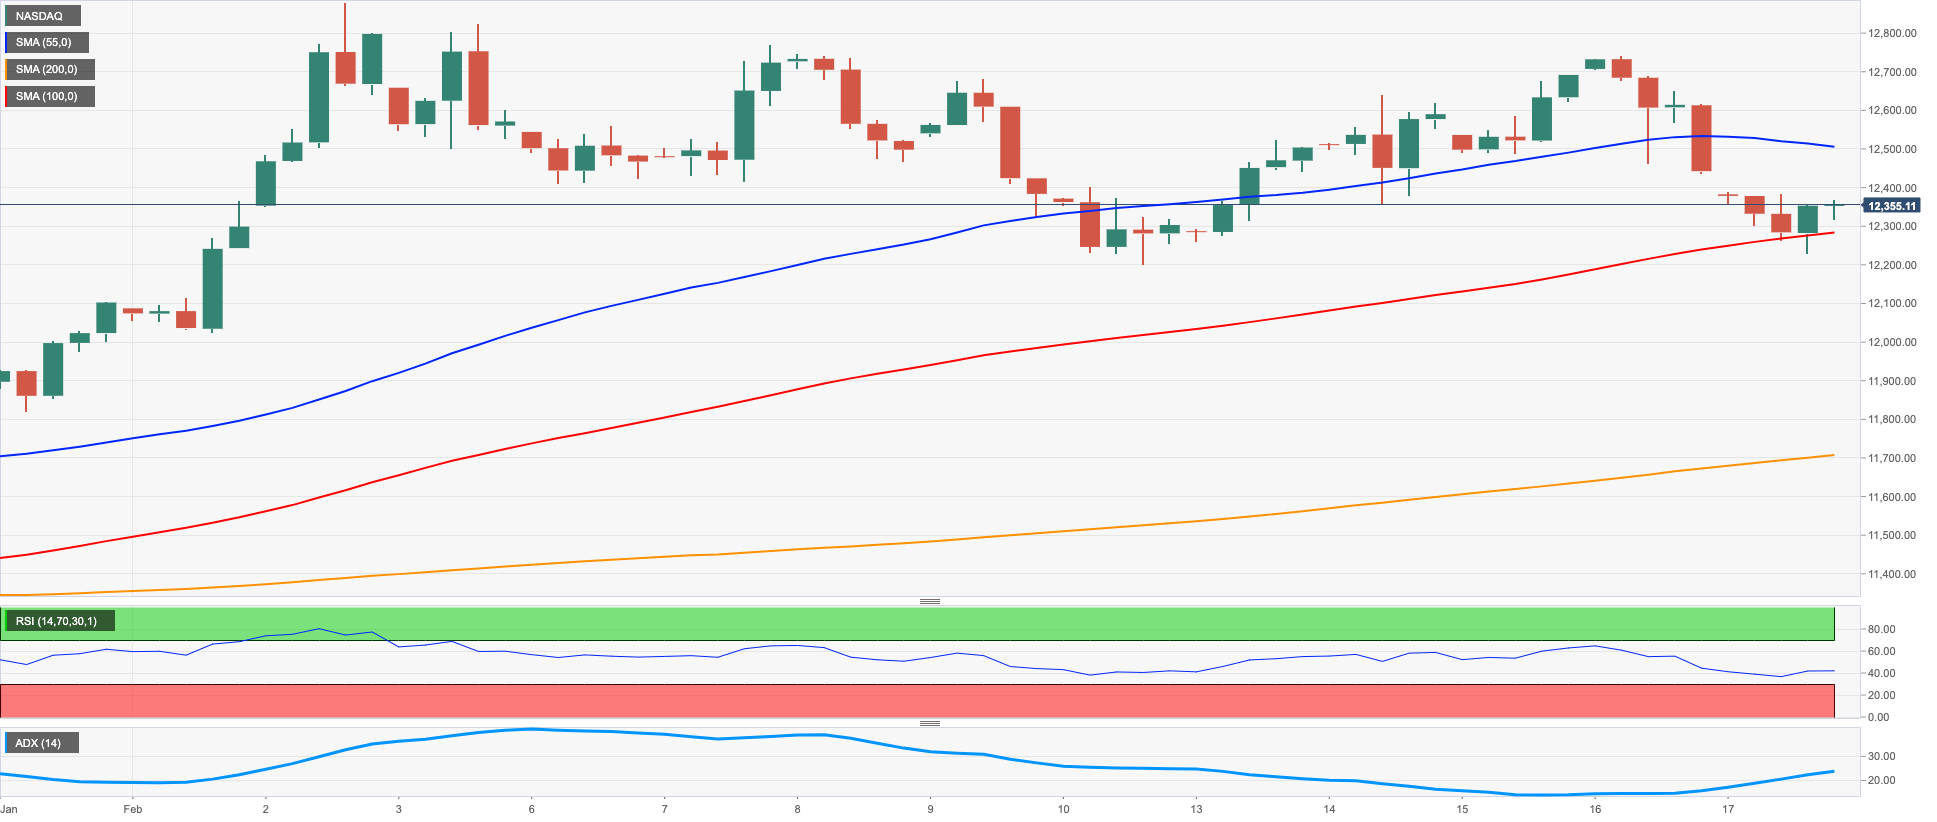
NASDAQ
The tech benchmark Nasdaq 100 charted an inconclusive session, although it left the weekly performance slightly in the positive territory on Friday.
The persistent march north in US yields amidst the unabated hawkish message from Fed’s policy makers weighed on investors’ sentiment and the tech sector in general throughout the last week, motivating the index to navigate in a range bound fashion.
In addition, the negative performance of giants Microsoft and Nvidia also added to the sour mood among traders.
Further weakness could drag the Nasdaq 100 to retest the weekly low at 12204 (February 10) ahead of the key 200-day SMA at 11919 and weekly lows at 11550 (January 25) and 11251 (January 19). South from here comes the January low at 10696 (January 6) prior to the December 2022 low at 10671 (December 22) and the November 2022 low at 10632 (November 4). On the opposite side, the 2023 peak at 12880 (February 2) remains the big magnet for bulls before the round level at 13000 and the weekly high at 13175 (August 26 2022). The daily RSI broke below the 55 zone.
Top Gainers: Tesla, Lucid Group, Amgen
Top Losers: Airbnb, Baker Hughes, Diamondback
Resistance levels: 12689 12771 12880 (4H chart)
Support levels: 12204 11906 11550 (4H chart)
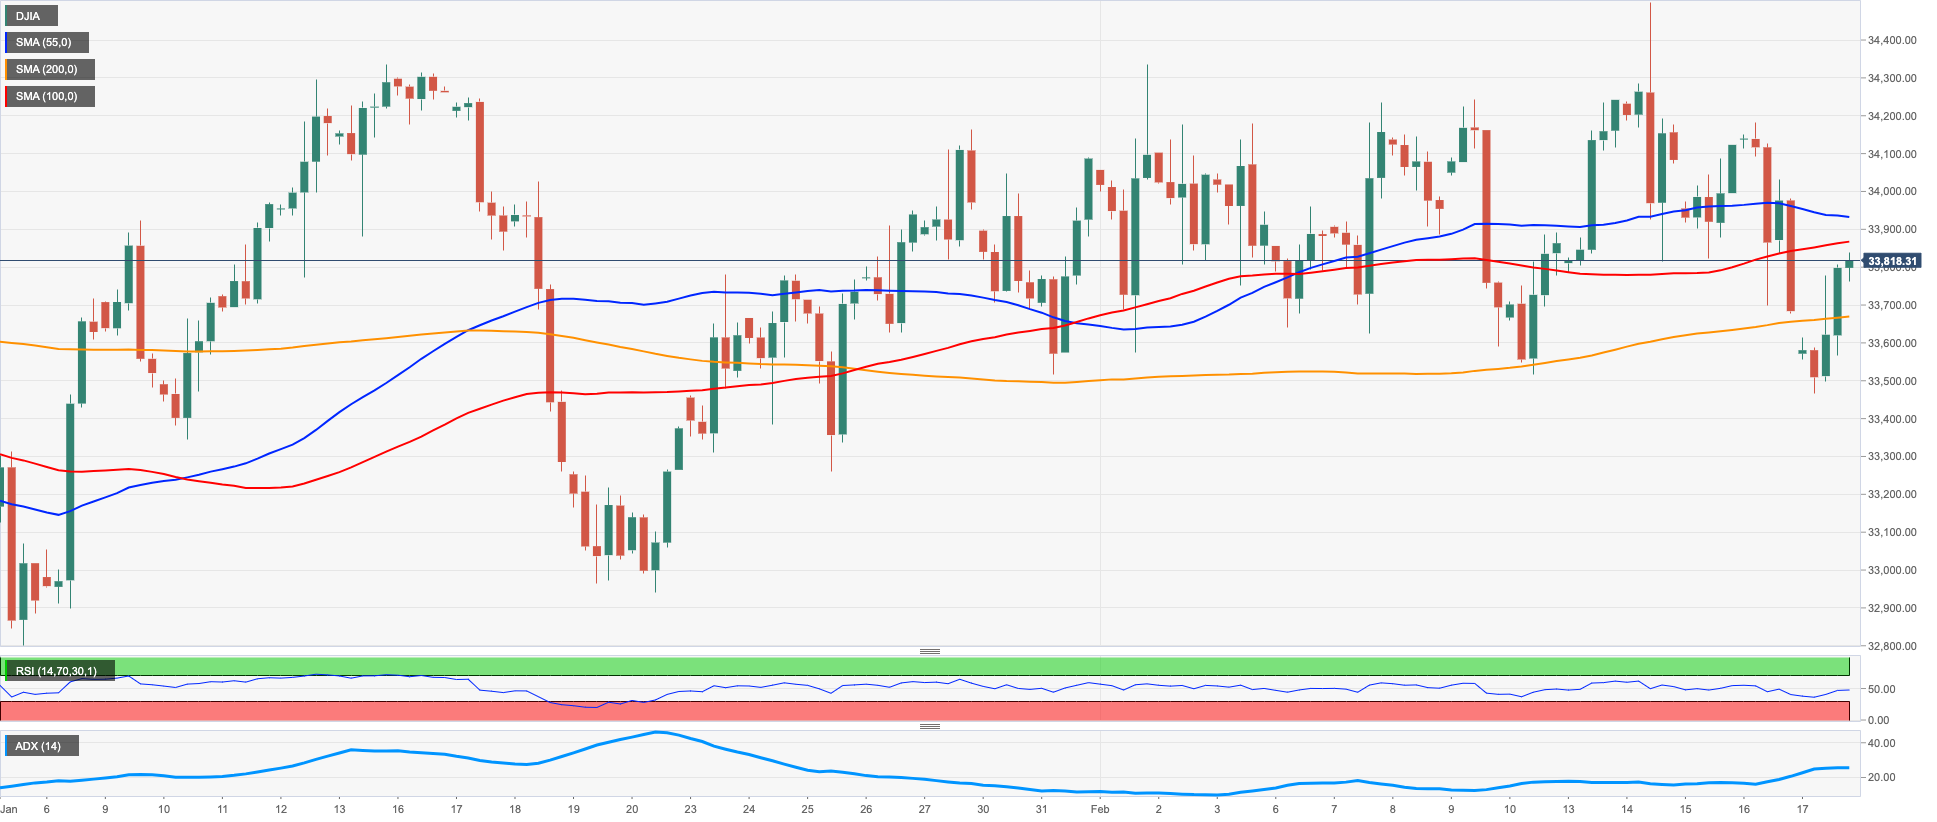
DOW JONES
US equities tracked by the Dow Jones reversed two consecutive daily retracements and charted decent gains at the end of the week, in contrast to the negative performance from the S&P500 and the Nasdaq Composite.
Bargain hunters managed to lend some oxygen to the index in context where the risk-off mood prevailed among market participants following further hawkish remarks from Fed speakers, this time from Fed’s Barkin (Richmond) and Bowman (FOMC Governor).
On the whole, the Dow Jones rose 0.39% to 33826, the S&P500 dropped 0.28% to 4079 and the tech-benchmark Nasdaq Composite retreated 0.58% to 11787.
The Dow Jones kept the multi-week consolidative phase well in place on Friday. That said, a drop below the February low at 33517 (February 17) could put a test of the weekly low at 32948 (January 20) back on the investors’ radar prior to the December 2022 low at 32573 (December 22) and the key 200-day SMA at 32346. Having said that, the initial up barrier aligns at the 2023 peak at 34342 (January 13) seconded by the December 2022 high at 34712 (December 13) and the April 2022 top at 35492 (April 21). The breakout of the latter exposes a move to the February 2022 peak at 35824 (February 9). The daily RSI gathered some pace and poked with the 50 level.
Top Performers: Merck&Co, Amgen, UnitedHealth
Worst Performers: Chevron, Intel, Salesforce Inc
Resistance levels: 34334 34712 35492 (4H chart)
Support levels: 33517 33273 32948 (4H chart)
MACROECONOMIC EVENTS

All Information & Updates provided by:

All information relating to the financial markets available on this page has been prepared and issued by FXStreet (Forexstreet SL, Spain, Reg: B62498233) on the basis of publicly available information and all information believed to be reliable and does not conflict with Kuwaiti local laws, and all necessary care has been taken to before the company to ensure that the facts mentioned are correct from the source.
NCM Investment nor any of its directors or employees shall in any way be held responsible for the contents of this news, and the information contained on this page is intended only to provide clients with publicly available information and should not be construed as investment advice, report or analysis and/or constitute an offer or invitation to buy or sell financial instruments of any kind.
RISK WARNING: Forex and CFDs are highly risky leveraged products, as losses can exceed deposits. Please ensure you understand all the risks and take independent advice if necessary. NCM will segregate the clients based on the criteria of the regulator and its bylaws. NCM does not provide any advisory service; the material published does not constitute advice or a recommendation for a transaction in any financial instrument. NCM accepts no responsibility for any use of the content presented and any consequences of that use. Anyone acting on the information provided does so at their own risk.