
- Contact Us:
-

-

-

-


Daily Market Updates
21 Feb 2023
USDJPY
The lack of direction prevailed in the global markets and USD/JPY kept hovering around the upper end of the recent range in the low-134.00s at the beginning of the week.
The absence of volatility in the pair’s price action came in line with the tight trading range in the greenback and the inactivity in the US money markets due to Washington's Birthday holiday.
In Japan, the JGB 10-year yields prolonged the consolidative mood around the 0.50% region.
From the BoJ, Deputy Governor Amamiya suggested the central bank has operational tools to fulfill an exit from the current ultra-accommodative monetary stance, adding that it is more difficult to decide whether conditions have met to change the current monetary policy and how to communicate those plans.
Next of note in the Japanese calendar will be the preliminary readings for the Manufacturing and Services PMIs for the month of February, due on Tuesday.
Immediately to the upside in USD/JPY aligns the 2023 high at 135.11 (February 17) ahead of the key 200-day SMA at 136.92 and the interim 100-day SMA at 137.53. The surpass of the latter exposes a probable move to weekly tops at 138.17 (December 15 2022) and 139.89 (November 30 2022) prior to the key round level at 140.00. Just the opposite, there is a temporary contention at the 55-day SMA at 132.30 ahead of the weekly low at 129.79 (February 10) and the February low at 128.08 (February 2). The breach of this level could put a potential test of the 2023 low at 127.21 (January 16) back on the investors’ radar before the May 2022 low at 126.36 (May 24) and the weekly low at 121.27 (March 31 2022). The daily RSI advanced slightly and flirted with the 62 region.
Resistance levels: 135.11 137.47 138.17 (4H chart)
Support levels: 133.60 132.64 131.49 (4H chart)

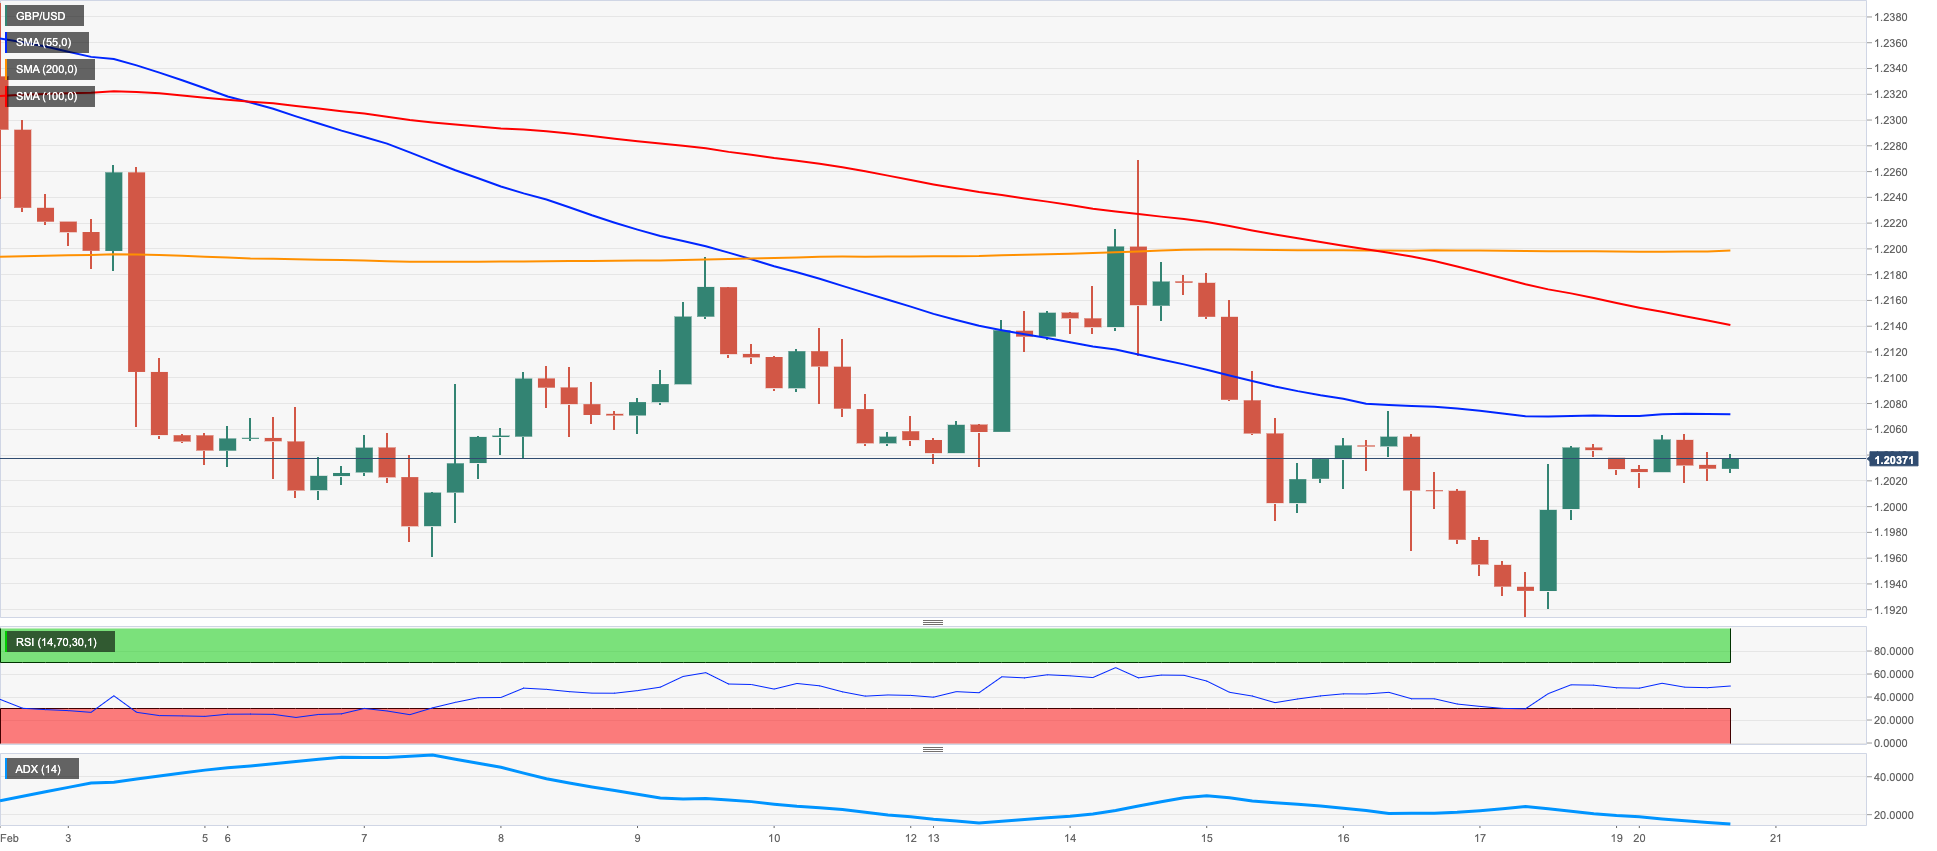
GBPUSD
GBP/USD charted an inconclusive session in line with the rest of the risk-linked galaxy, managing to keep business above the key 1.2000 mark amidst the absence of volatility in the global markets in response to the US holiday.
Indeed, marginal gains in the dollar put Cable under some mild pressure following Friday’s decent gains. The topside, in the meantime, remained capped by the 1.2050/60 band at the beginning of the week.
There were no data releases scheduled across the Channel on Monday, leaving all the attention to Tuesday’s publication of the flash Manufacturing and Services PMIs for the current month and the CBI Industrial Trends Orders.
GBP/USD faces the next contention area at the 200-day SMA at 1.1936, which also reinforces the February low at 1.1914 (February 17). The breach of this level exposes the interim 100-day SMA at 1.1907 ahead of the 2023 low at 1.1841 (January 6). For all that, the 55-day SMA at 1.2170 appears as a provisional up barrier seconded by the weekly peak at 1.2269 (February 14) and the 2023 high at 1.2447 (January 23). North from here comes the May 2022 top at 1.2666 (May 27) prior to the 200-week SMA at 1.2887 and the psychological 1.3000 mark. The daily RSI looked stable just above 43.
Resistance levels: 1.2056 1.2074 1.2192 (4H chart)
Support levels: 1.1914 1.1841 1.1778 (4H chart)
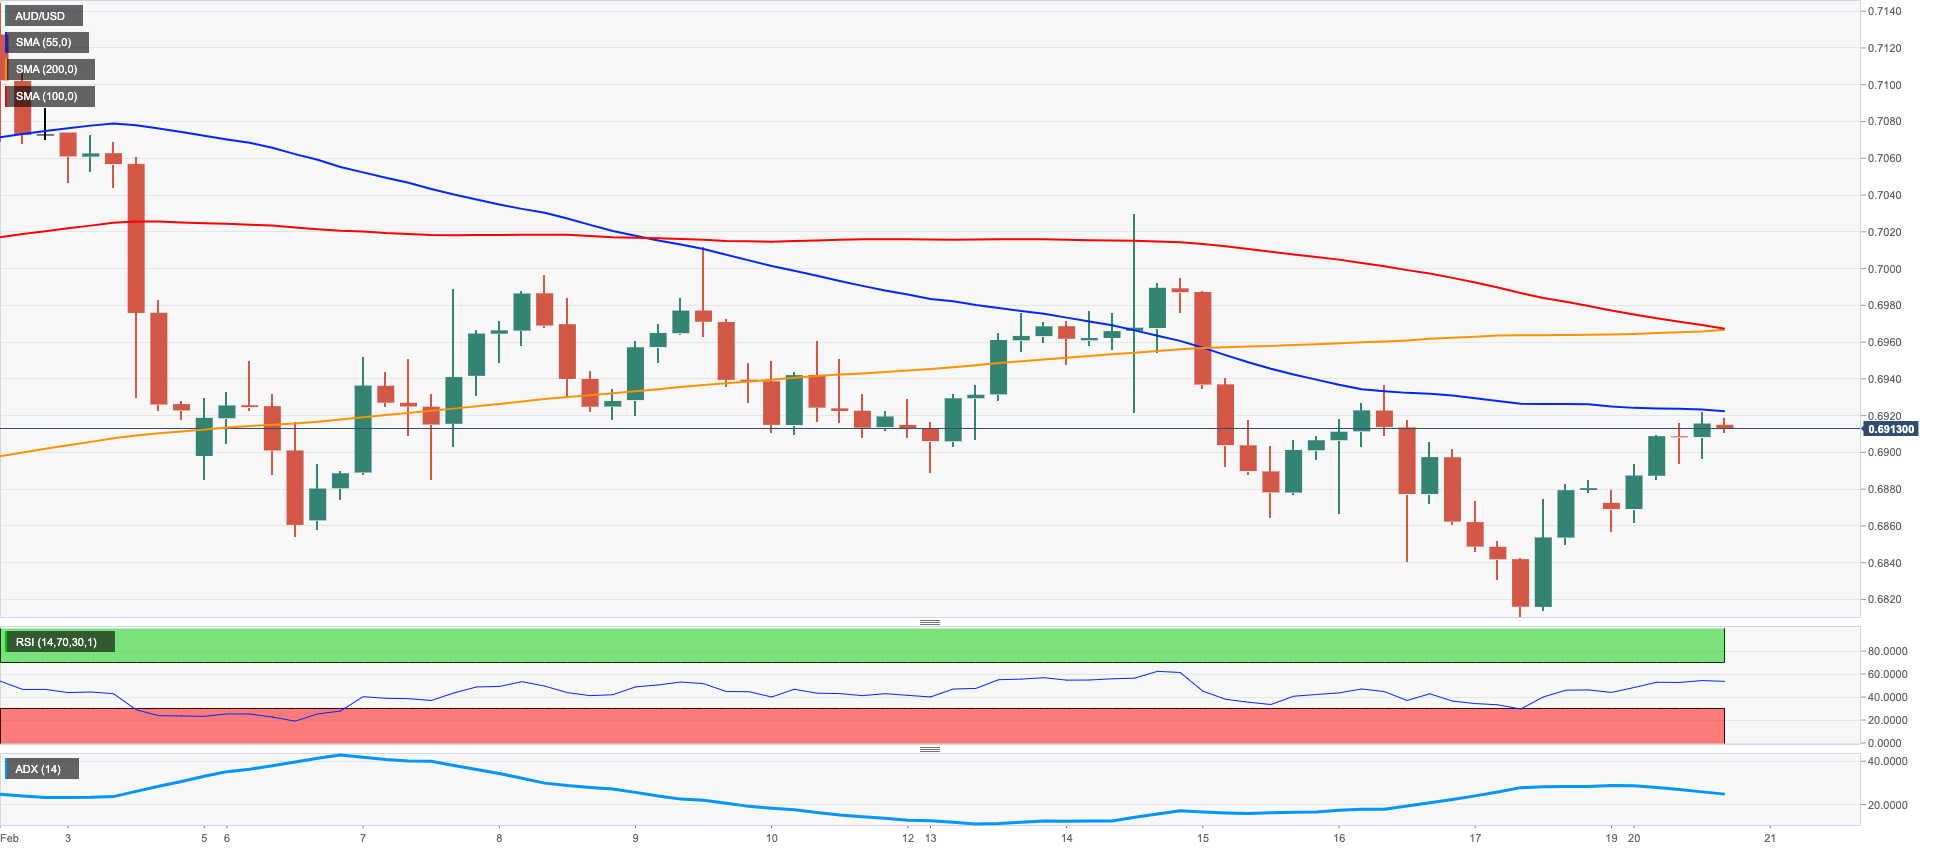
AUDUSD
AUD/USD reversed three consecutive daily drops and regained strong buying interest, managing at the same time to reclaim the area beyond 0.6900 the figure at the beginning of the week.
The directionless performance of the greenback allowed the Aussie dollar to grab some oxygen and leave behind part of last week’s intense decline.
The generalized upbeat tone in the commodity complex also collaborated with the upside bias in the pair on Monday. On the latter, copper prices extended further the recent recovery and the iron ore advanced modestly to the boundaries of the $125.00 zone per tonne.
There were no data releases Down Under on Monday, leaving all the attention to Tuesday’s publication of the RBA Minutes of the February event.
If the recovery picks up impulse, AUD/USD could then attempt to challenge the weekly peak at 0.7029 (February 14) ahead of the 2023 high at 0.7157 (February 2). Once the latter is cleared, the pair could head towards the round level at 0.7200 prior to the June 2022 top at 0.7282 (June 3). On the other hand, the February low at 0.6811 (February 17) appears underpinned by the key 200-day SMA at 0.6803. The breach of this region could pave the way for a test of the 2023 low at 0.6688 (January 3) prior to the December 2022 low at 0.6629 (December 20). The daily RSI rebounded and approached the 48 mark.
Resistance levels: 0.6920 0.6936 0.6962 (4H chart)
Support levels: 0.6811 0.6722 0.6688 (4H chart)
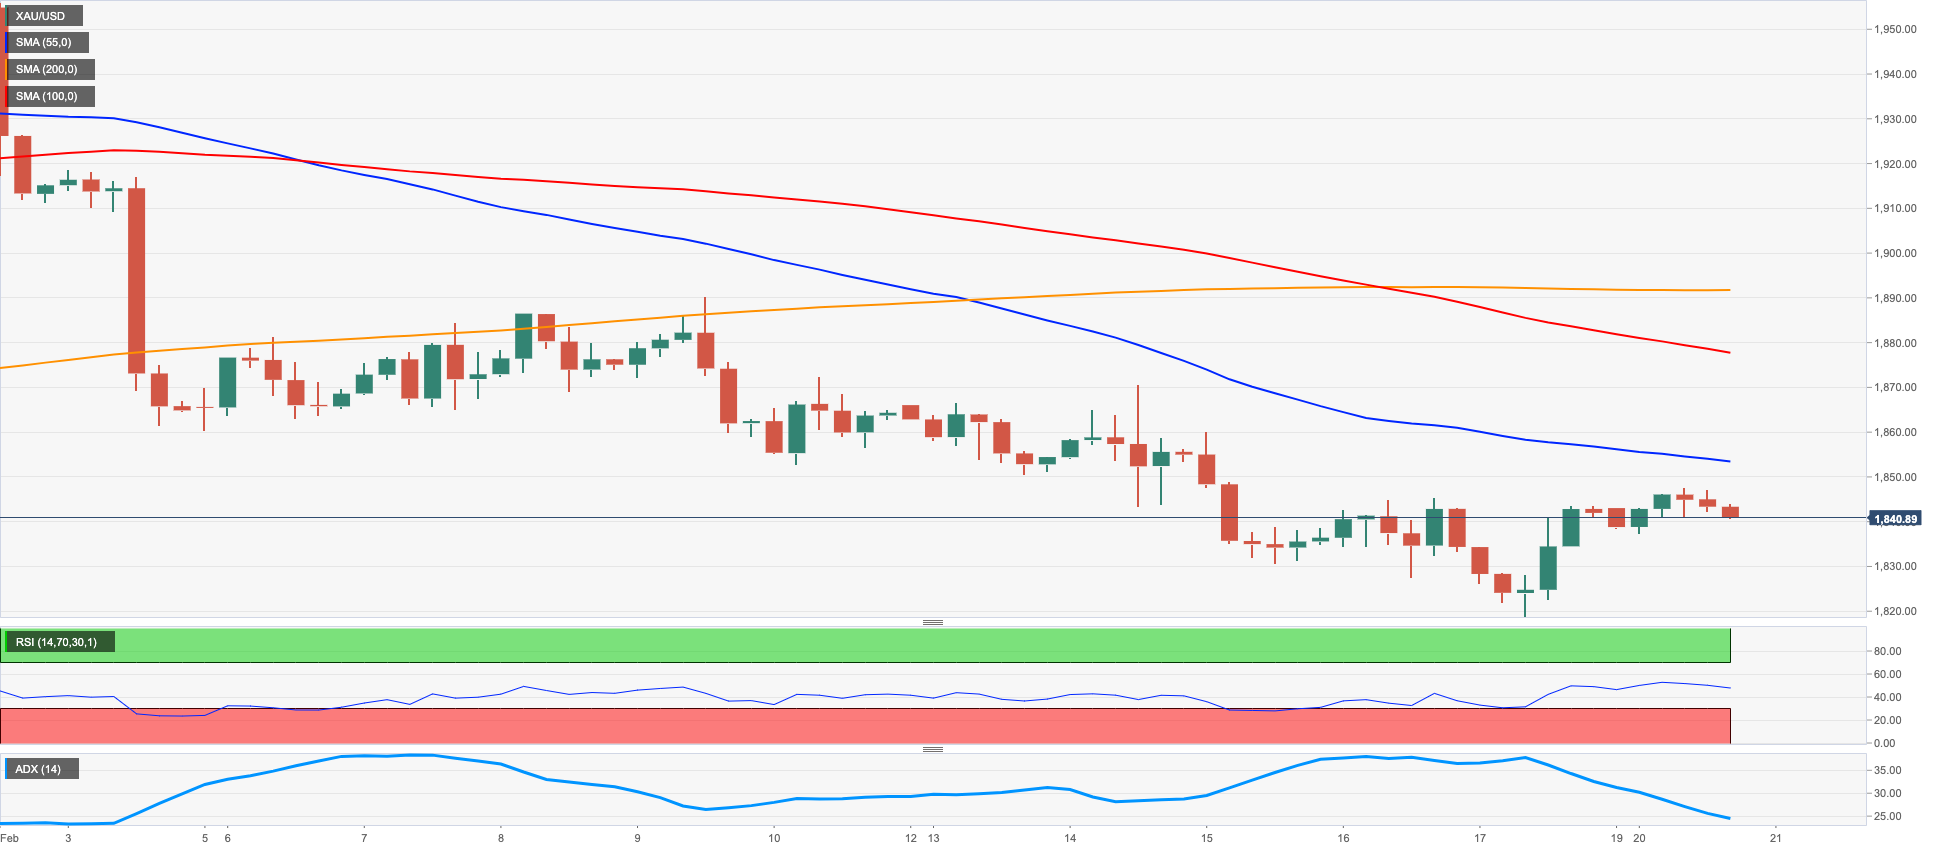
GOLD
Prices of the ounce troy of gold faced some selling pressure and reversed two daily gains in a row on Monday.
Indeed, bullion approached the key $1850 mark on the back of the lack of direction in the greenback and the generalized cautious note in the global markets, although that earlier bull run fizzled out towards the end of the session.
Collaborating with the price action in the precious metal appeared the inactivity in the US money market, where yields have picked up intense upside traction in February mainly on the back of the hawkish narrative from Fed’s policy makers.
Further rebound in gold now faces the next hurdle at the 55-day SMA at $1855 ahead of the weekly top at $1890 (February 9) and the 2023 peak at $1959 (February 2). Further up comes the April 2022 high at $1998 (April 18) before the psychological $2000 mark and the 2022 top at $2070 (March 8). In the opposite direction, a drop below the 2023 low at $1818 (February 17) could open the door to the key $1800 region ahead of the provisional 100-day SMA at $1785 and the more relevant 200-day SMA at $1776. Further down appears the weekly low at $1727 (November 23).
Resistance levels: $1847 $1870 $1890 (4H chart)
Support levels: $1818 $1797 $1784 (4H chart)
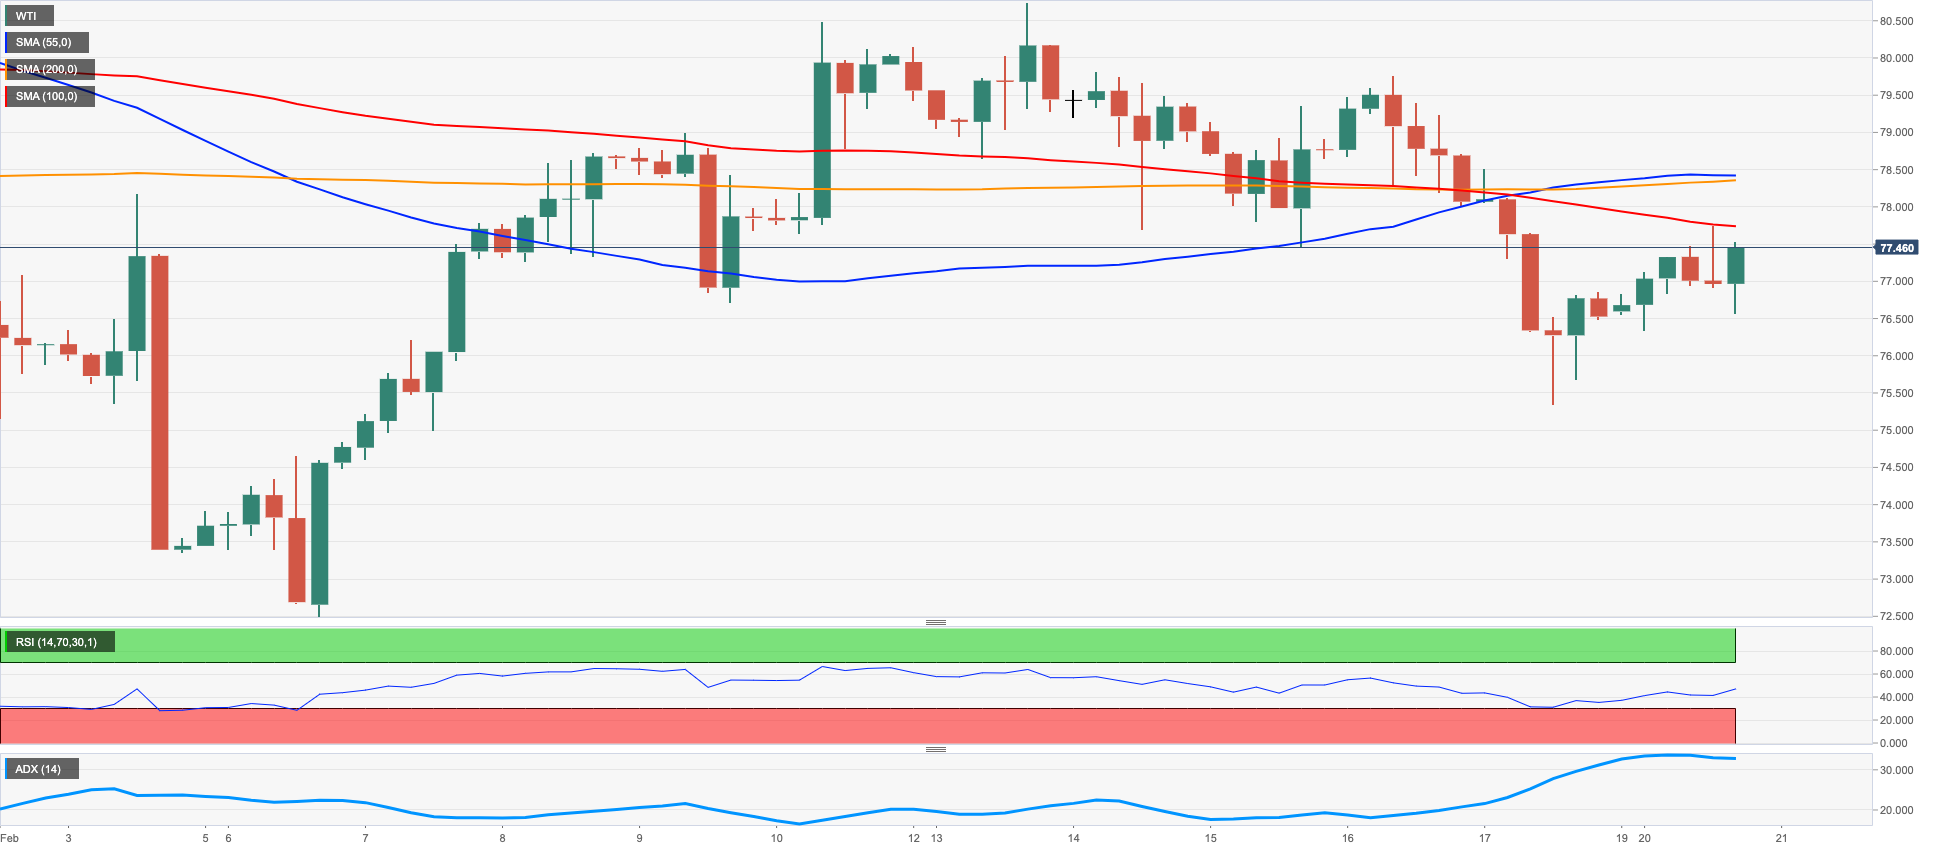
CRUDE WTI
Finally, some respite for the West Texas Intermediate (WTI), as it managed to snap five consecutive daily drops and print a decent advance north of the $77.00 mark per barrel on Monday.
This time, the Chinese reopening and its direct impact on the demand for the commodity was behind the auspicious start of the week for crude oil prices, while the reduction of the oil output in Russia also underpinned the daily advance in the WTI.
Later in the week, the API and the EIA will report on US crude oil inventories in the week to February 17 on Wednesday and Thursday, respectively.
In case bulls regain the upper hand, WTI should meet the next hurdle at the February high at $80.57 (February 13) just ahead of the temporary 100-day SMA at $80.92. Further up comes the 2023 top at $82.60 (January 23). Ahead of the December 2022 peak at $83.32 (December 1) and the $90.08 level (November 11 2022). On the flip side, the loss of the weekly low at $75.36 (February 17) could put the 2023 low at $72.30 (February 6) to the test ahead of the 2022 low at $70.10 (December 9) and the key round level at $70.00, all followed by the weekly low at $66.15 (December 20 2021).
Resistance levels: $78.03 $79.50 $80.57 (4H chart)
Support levels: $75.29 $72.22 $70.07 (4H chart)
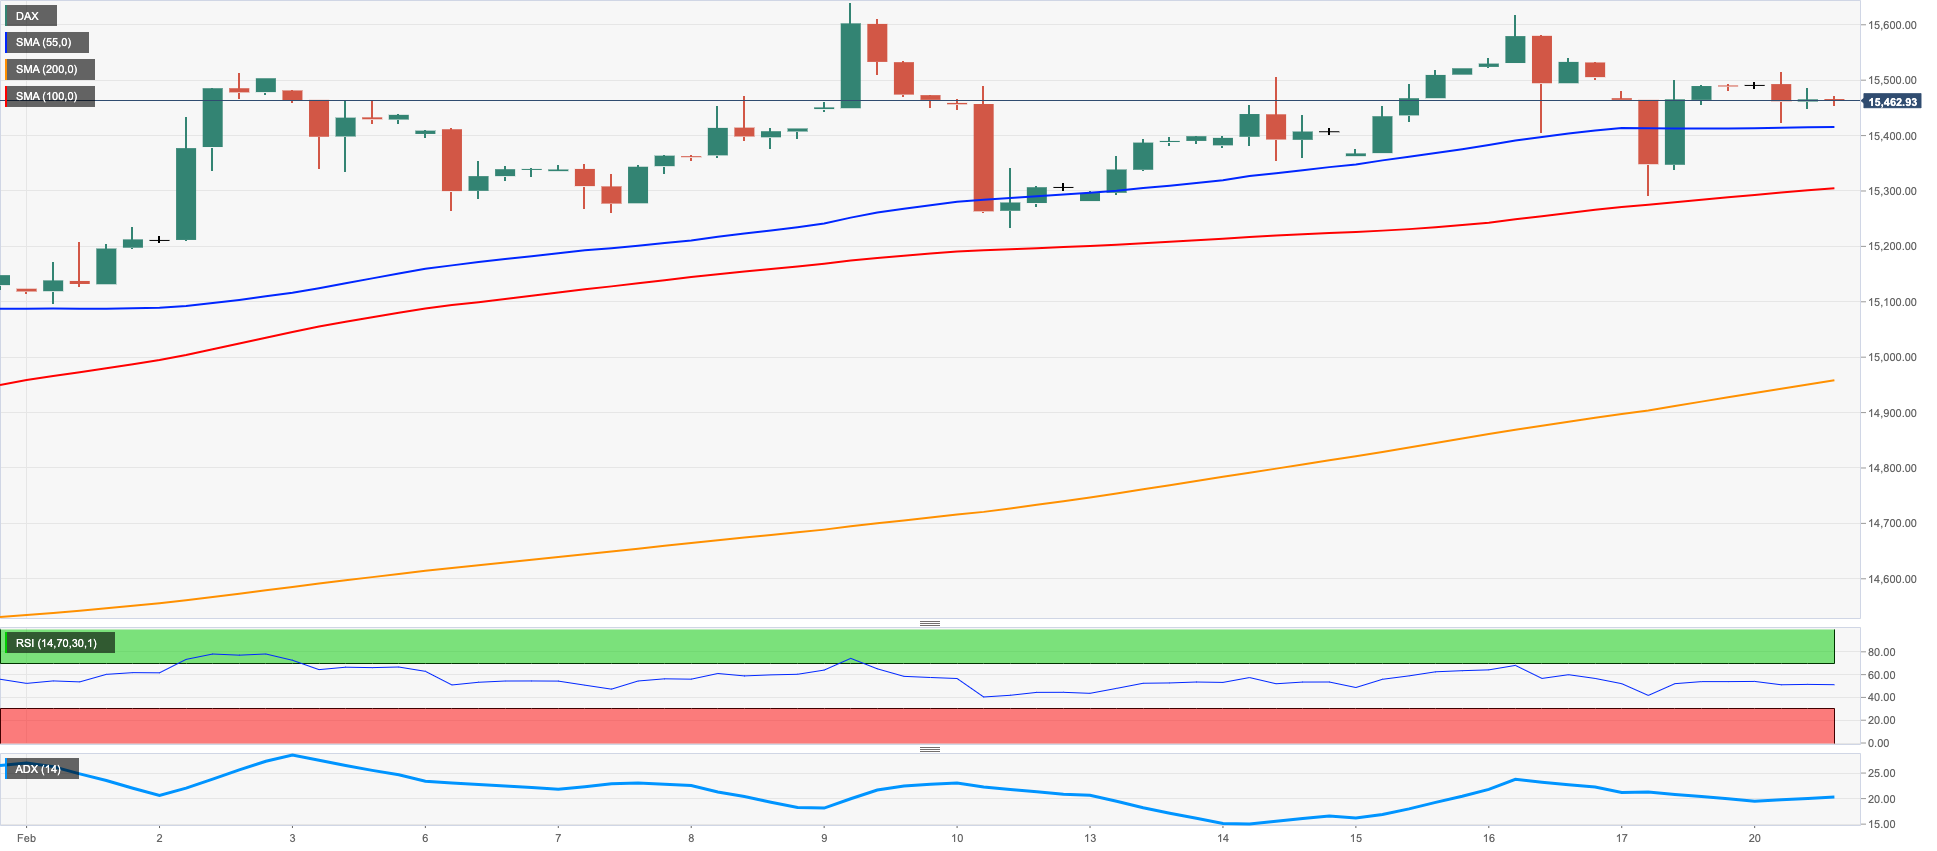
GER40
German equities traded within a tight range and remained around the 15500 region at the beginning of the week.
The lack of volatility in the global markets due to the US holiday weighed on the investors’ mood on Monday.
In addition, prudence among market participants started to swell in light of upcoming key data releases in Germany, the broader euro area and the publication of the FOMC Minutes.
On another page, the Bundesbank suggested that core inflation is expected to decline only tentatively in the coming months, while headline inflation seems to have peaked. The German lender added that the second round impact of quick wage growth is seen keeping inflation in the euro area above target for an extended period. Furthermore, the bank sees an improvement in the short-term outlook for the country, although high inflationary pressures still persist.
In the German bond market, the 10-year Bund yields advanced marginally to the 2.46% level, somewhat reversing Friday’s retracement.
The DAX40 appears so far within the multi-session consolidative theme in the upper end of the monthly range. That said, the next resistance level comes at the 2023 peak at 15658 (February 9) ahead of the February 2022 high at 15736 (February 2 2022). North from here turns up the round level at 16000 prior to the 2022 top at 16285 (January 5). Having said that, the weekly low at 15246 (February 10) offers initial contention seconded by another weekly low at 14906 (January 19) and the provisional 55-day SMA at 14765. Further down aligns the December 2022 low at 13791 (December 20) before the key 200-day SMA at 13734. The daily RSI retreated to the sub-63 area.
Best Performers: BASF, Covestro, Volkswagen VZO
Worst Performers: Deutsche Bank AG, Airbus Group, MTU Aero
Resistance levels: 15634 15658 15736 (4H chart)
Support levels: 15300 15246 15157 (4H chart)
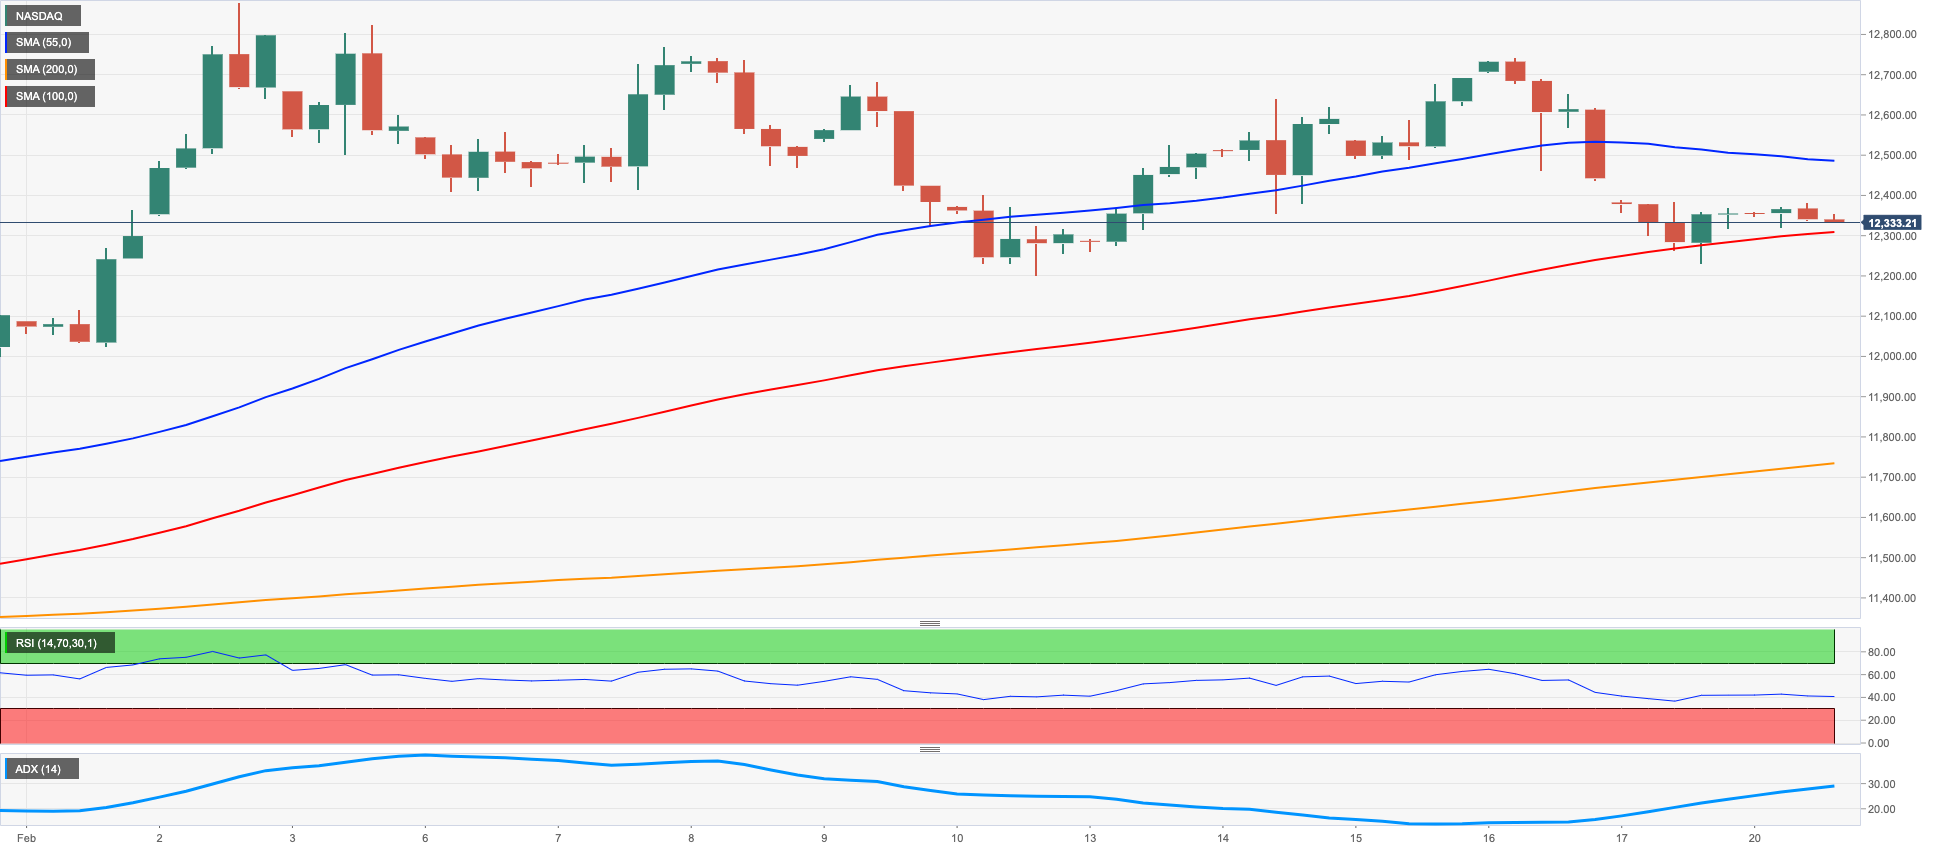
NASDAQ
The reference index for the US tech sector - the Nasdaq 100 – recorded the second consecutive daily decline on Friday.
Indeed, tech equities were dragged lower following the poor price action around megacaps Microsoft and Nvidia, while the intense march north in US yields across the curve also weighed on traders’ sentiment at the end of last week.
In case the Nasdaq 100 corrects further down, there is an initial support at the weekly low at 12204 (February 10) closely followed by the key 200-day SMA at 11919 and seconded by weekly lows at 11550 (January 25) and 11251 (January 19). The breach of the latter could put the January low at 10696 (January 6) to the test ahead of the December 2022 low at 10671 (December 22) and the November 2022 low at 10632 (November 4). The other way around, the index faces an immediate hurdle at the 2023 peak at 12880 (February 2) followed by the round level at 13000 and the weekly high at 13175 (August 26 2022). The daily RSI came under pressure and breached the 55 level.
Top Gainers: Tesla, Lucid Group, Amgen
Top Losers: Airbnb, Baker Hughes, Diamondback
Resistance levels: 12689 12771 12880 (4H chart)
Support levels: 12204 11906 11550 (4H chart)
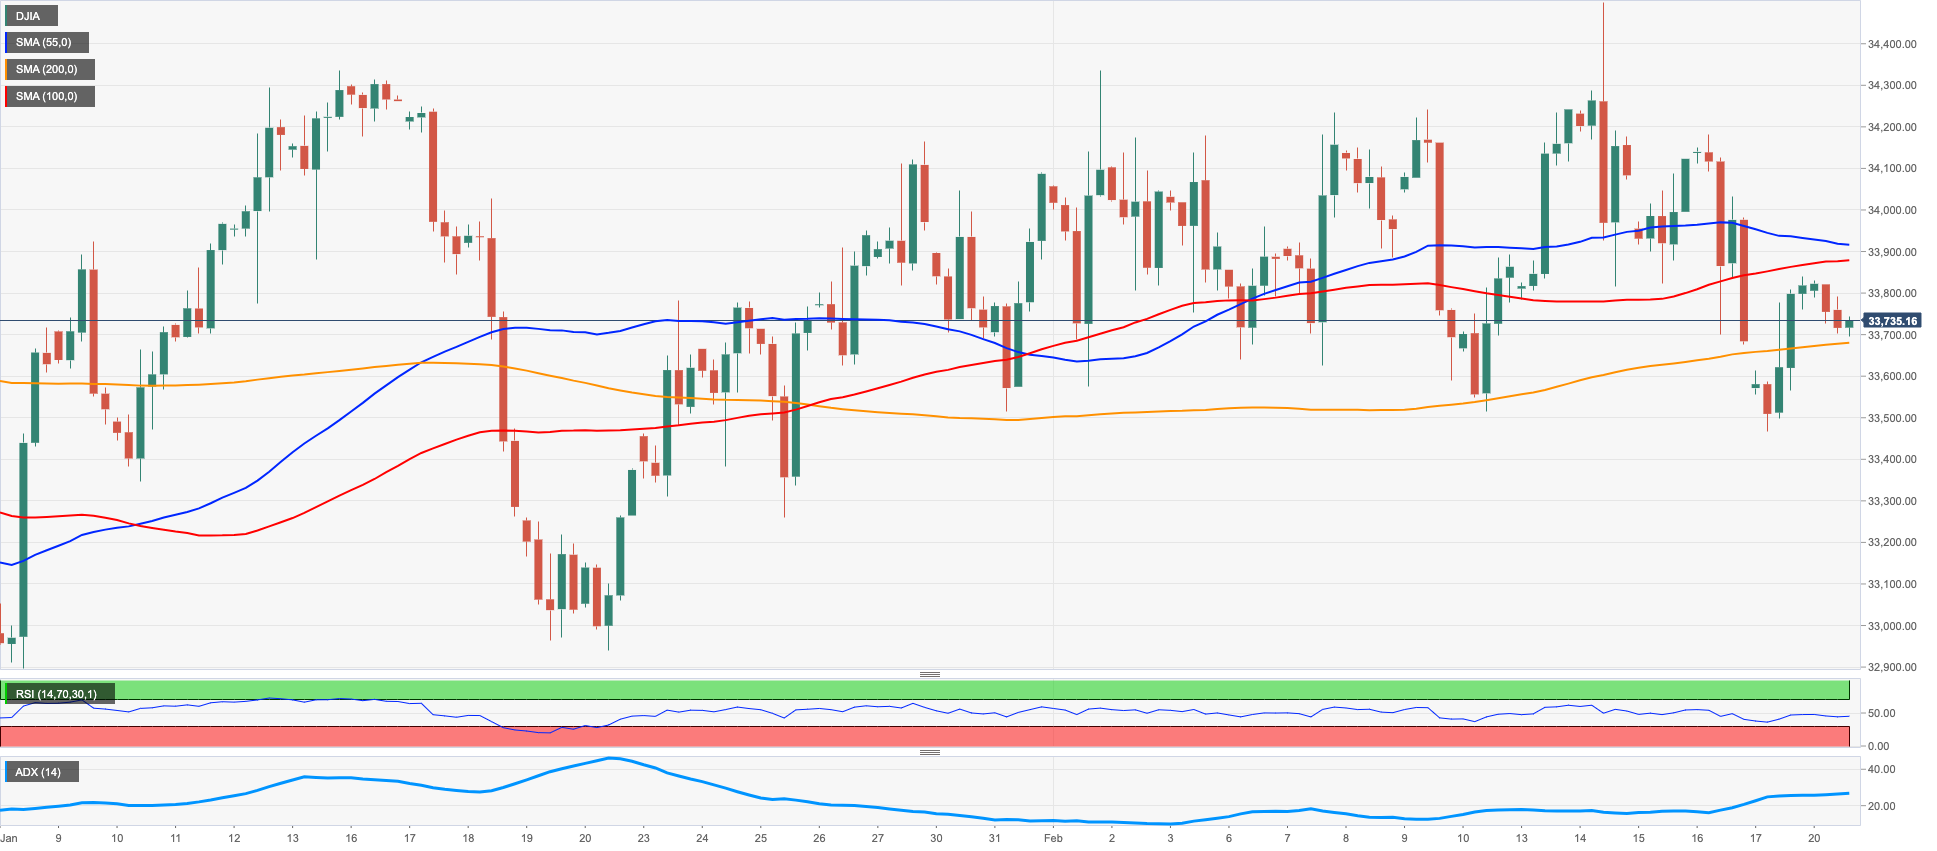
DOW JONES
US markets were closed on Monday due to Washington's Birthday holiday.
Despite equities tracked by the three major US stock indices closed in a mixed note at the end of last week, the main driver behind the recent loss of momentum in equities can be found in the persistent hawkish narrative from Fed’s speakers, which has met further support in the better-than-expected results from some US fundamentals as of late.
So far, and according to CME Group’s FedWatch Tool, the probability of a ¼ percentage point at the March 22 meeting is at nearly 85% (from around 91% a week ago).
All in all, the Dow Jones gained 0.39% to 33826, the S&P500 retreated 0.28% to 4079 and the tech-benchmark Nasdaq Composite deflated 0.58% to 11787.
The Dow Jones risks a deeper pullback in case it breaks below the February low at 33517 (February 17). Losses could then accelerate and revisit the weekly low at 32948 (January 20) ahead of the December 2022 low at 32573 (December 22) and the key 200-day SMA at 32346. In the opposite direction, the 2023 peak at 34342 (January 13) emerges as the immediate obstacle for bulls prior to the December 2022 high at 34712 (December 13) and the April 2022 top at 35492 (April 21). North from here comes the February 2022 peak at 35824 (February 9). The daily RSI gathered steam and approached the 48 zone.
Top Performers: Merck&Co, Amgen, UnitedHealth
Worst Performers: Chevron, Intel, Salesforce Inc
Resistance levels: 34334 34712 35492 (4H chart)
Support levels: 33517 33273 32948 (4H chart)
MACROECONOMIC EVENTS

All Information & Updates provided by:

All information relating to the financial markets available on this page has been prepared and issued by FXStreet (Forexstreet SL, Spain, Reg: B62498233) on the basis of publicly available information and all information believed to be reliable and does not conflict with Kuwaiti local laws, and all necessary care has been taken to before the company to ensure that the facts mentioned are correct from the source.
NCM Investment nor any of its directors or employees shall in any way be held responsible for the contents of this news, and the information contained on this page is intended only to provide clients with publicly available information and should not be construed as investment advice, report or analysis and/or constitute an offer or invitation to buy or sell financial instruments of any kind.
RISK WARNING: Forex and CFDs are highly risky leveraged products, as losses can exceed deposits. Please ensure you understand all the risks and take independent advice if necessary. NCM will segregate the clients based on the criteria of the regulator and its bylaws. NCM does not provide any advisory service; the material published does not constitute advice or a recommendation for a transaction in any financial instrument. NCM accepts no responsibility for any use of the content presented and any consequences of that use. Anyone acting on the information provided does so at their own risk.