
- Contact Us:
-

-

-

-


Daily Market Updates
22 Feb 2023
USDJPY
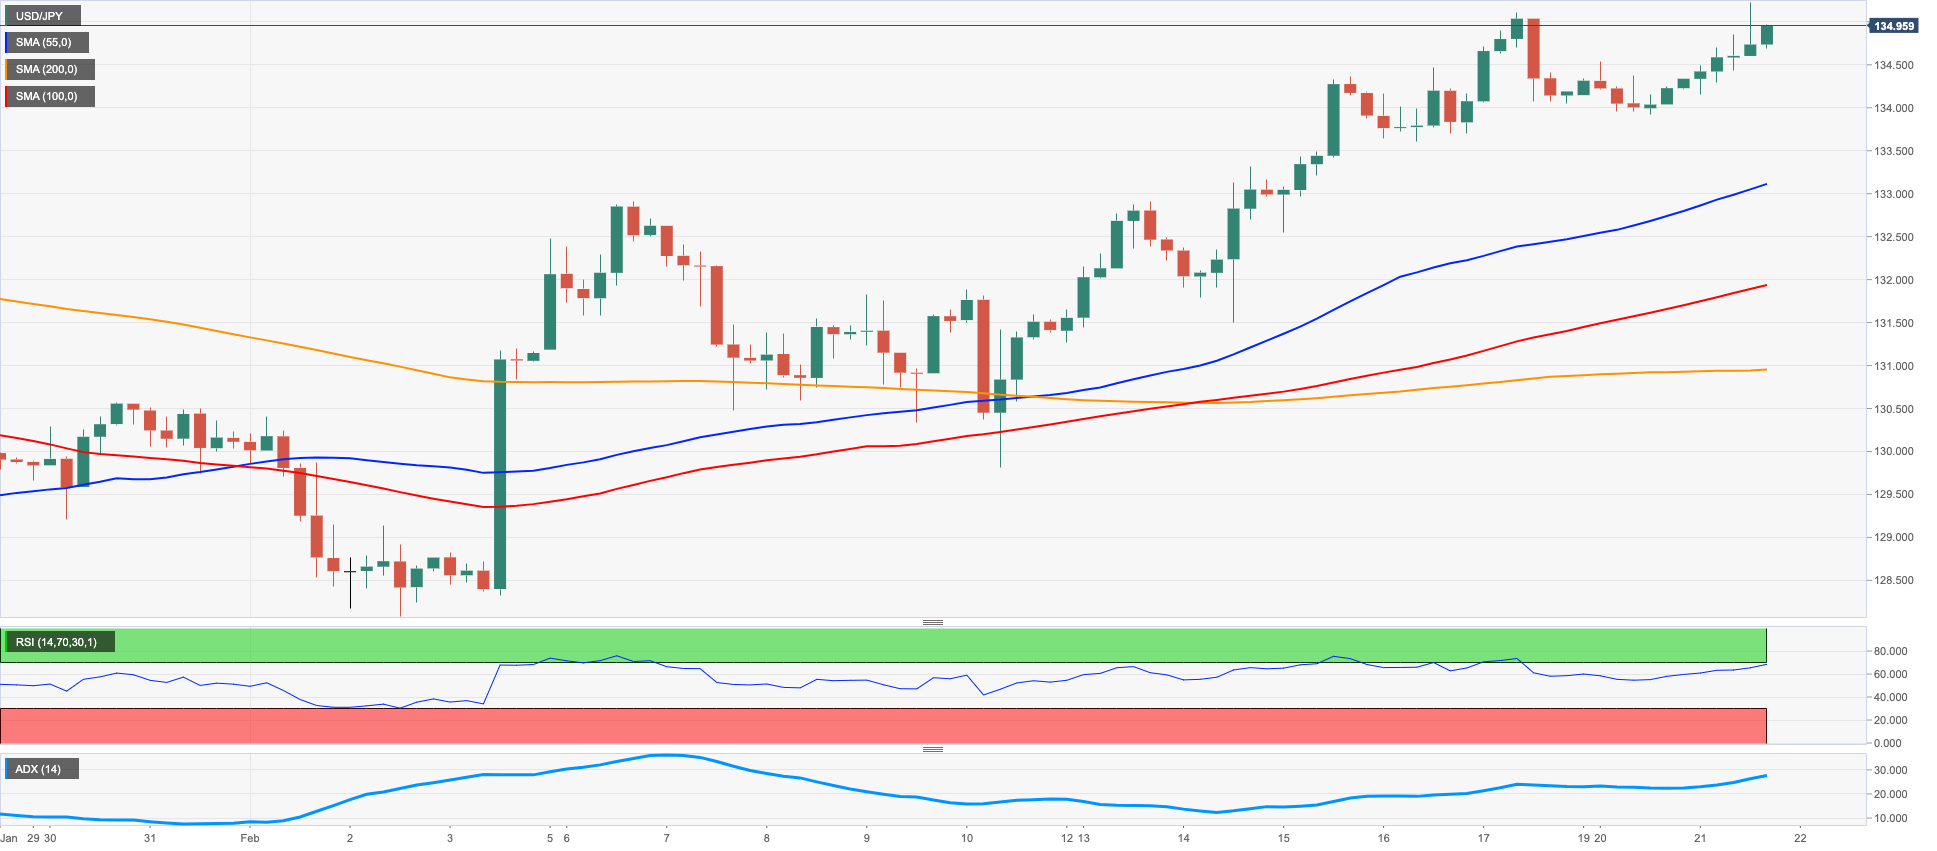
USD/JPY extended the bullish performance for the third session in a row and printed new YTD peaks around 135.20 on Tuesday.
The better tone in the greenback in combination with higher US yields across the curve all underpinned another uptick in the pair as US markets returned to the usual activity following Monday’s inactivity.
News from the BoJ, Governor H.Kuroda suggested the bank will continue to monitor FX moves and their impact on the economy. He also suggested that inflation would start losing traction in mid-FY2023 and that wages could rise in response to labour demand and inflation.
In the domestic money market, the JGB 10-year yields remained side-lined around 0.50%, the upper end of the YCC band.
In Japan, the preliminary readings for the Manufacturing and Services PMIs came at 47.4 and 53.6, respectively, for the month of February.
USD/JPY faces the next up barrier at the 2023 top at 135.11 (February 17). The breakout of this level exposes a probable move to the key 200-day SMA at 136.95 closely followed by the provisional 100-day SMA at 137.43 and ahead of weekly peaks at 138.17 (December 15 2022) and 139.89 (November 30 2022), all before the key round level at 140.00. For all that, the 55-day SMA at 132.26 should offer initial and interim support prior to the weekly low at 129.79 (February 10) and the February low at 128.08 (February 2). Down from here emerges the 2023 low at 127.21 (January 16) ahead of the May 2022 low at 126.36 (May 24) and the weekly low at 121.27 (March 31 2022). The daily RSI picked up pace and approached the 65 mark.
Resistance levels: 135.22 137.47 138.17 (4H chart)
Support levels: 133.91 133.60 132.64 (4H chart)
GBPUSD
A marked recovery in the greenback put the risk complex under pressure although it failed to hurt the morale around the British pound, which saw its buying interest surge in the wake of (much) better-than-expected results from the domestic docket on Tuesday.
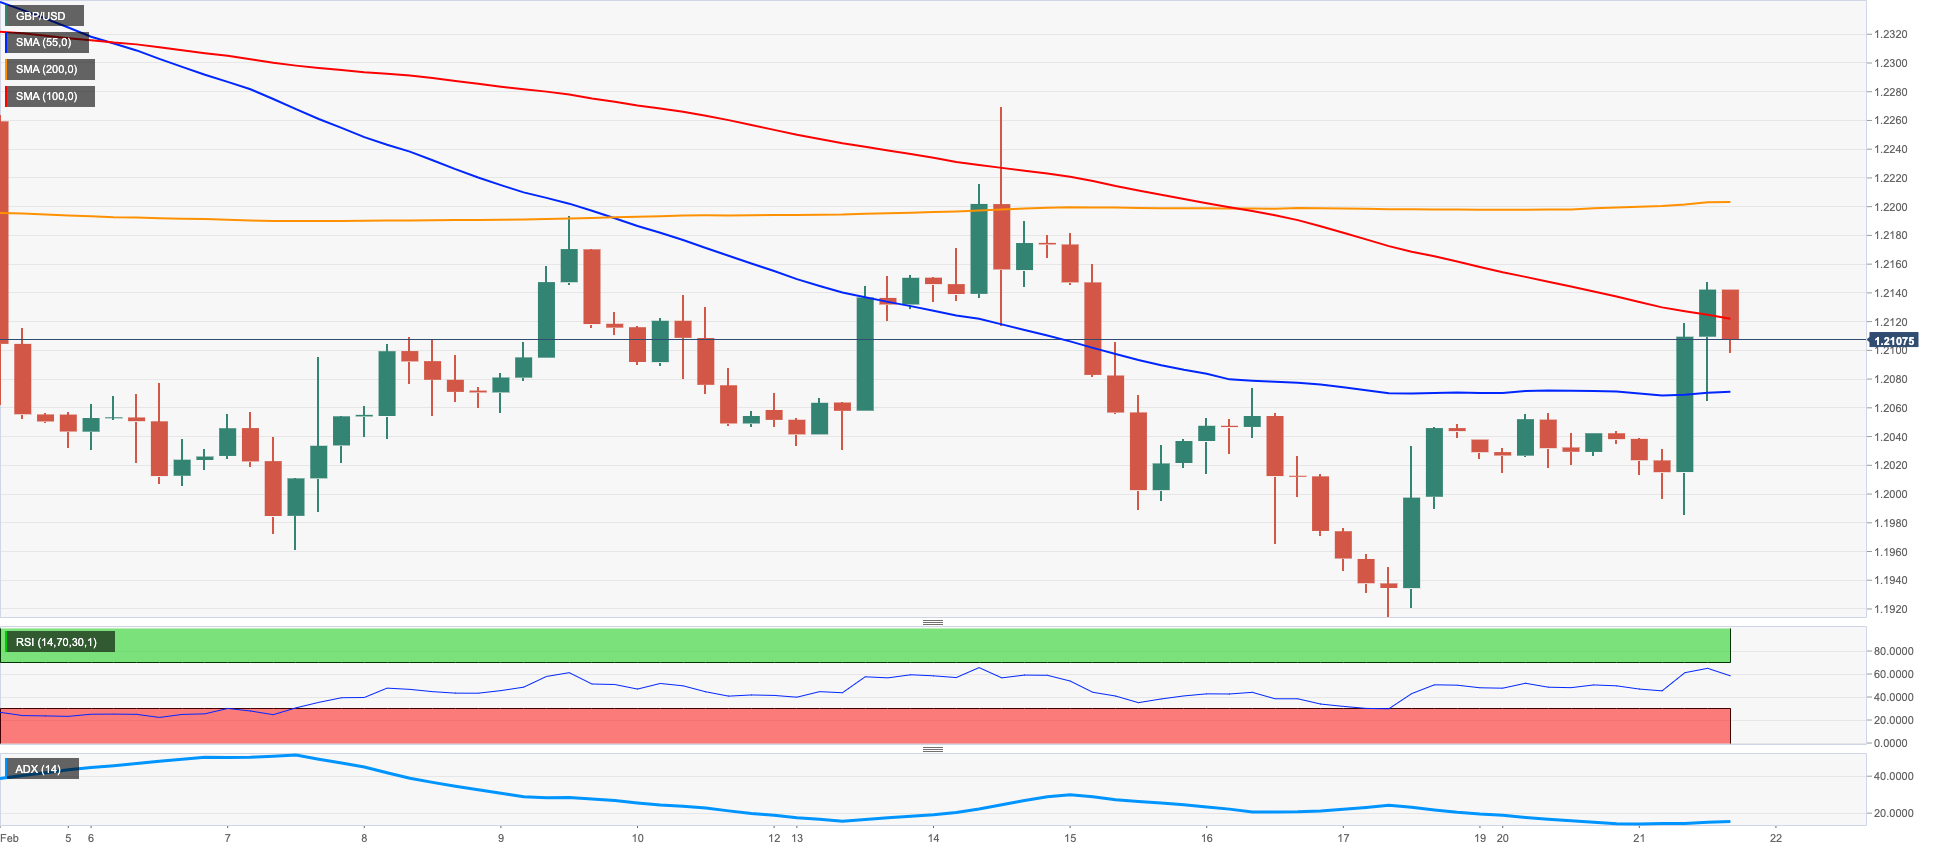
Indeed, GBP/USD managed to regain strong upside traction after briefly bottoming out in the sub-1.2000 region, extending the bounce to the area past 1.2100 the figure after the flash Manufacturing PMI is expected to have improved to 49.2 in February and the Services PMI is also seen higher at 53.3.
In the UK bonds market, the 10-year Gilt yields rose to multi-week highs near the 3.65% level.
Additionally in the UK calendar, CBI Industrial Trends Orders rose marginally to -16 also in February (from -17).
Immediately to the downside for GBP/USD appears the 200-day SMA at 1.1933 just ahead of the February low at 1.1914 (February 17), which in turn seems propped up by the provisional 100-day SMA at 1.1912 and comes ahead of the 2023 low at 1.1841 (January 6). On the opposite side, there is an interim barrier at the 55-day SMA at 1.2168 prior to the weekly high at 1.2269 (February 14) and the 2023 top at 1.2447 (January 23). The surpass of the latter could put a potential test of the May 2022 peak at 1.2666 (May 27) back on the investors’ radar before the 200-week SMA at 1.2887 and the psychological 1.3000 yardstick. The daily RSI improved to the vicinity of the 48 region.
Resistance levels: 1.2147 1.2192 1.2269 (4H chart)
Support levels: 1.1996 1.1914 1.1841 (4H chart)
AUDUSD
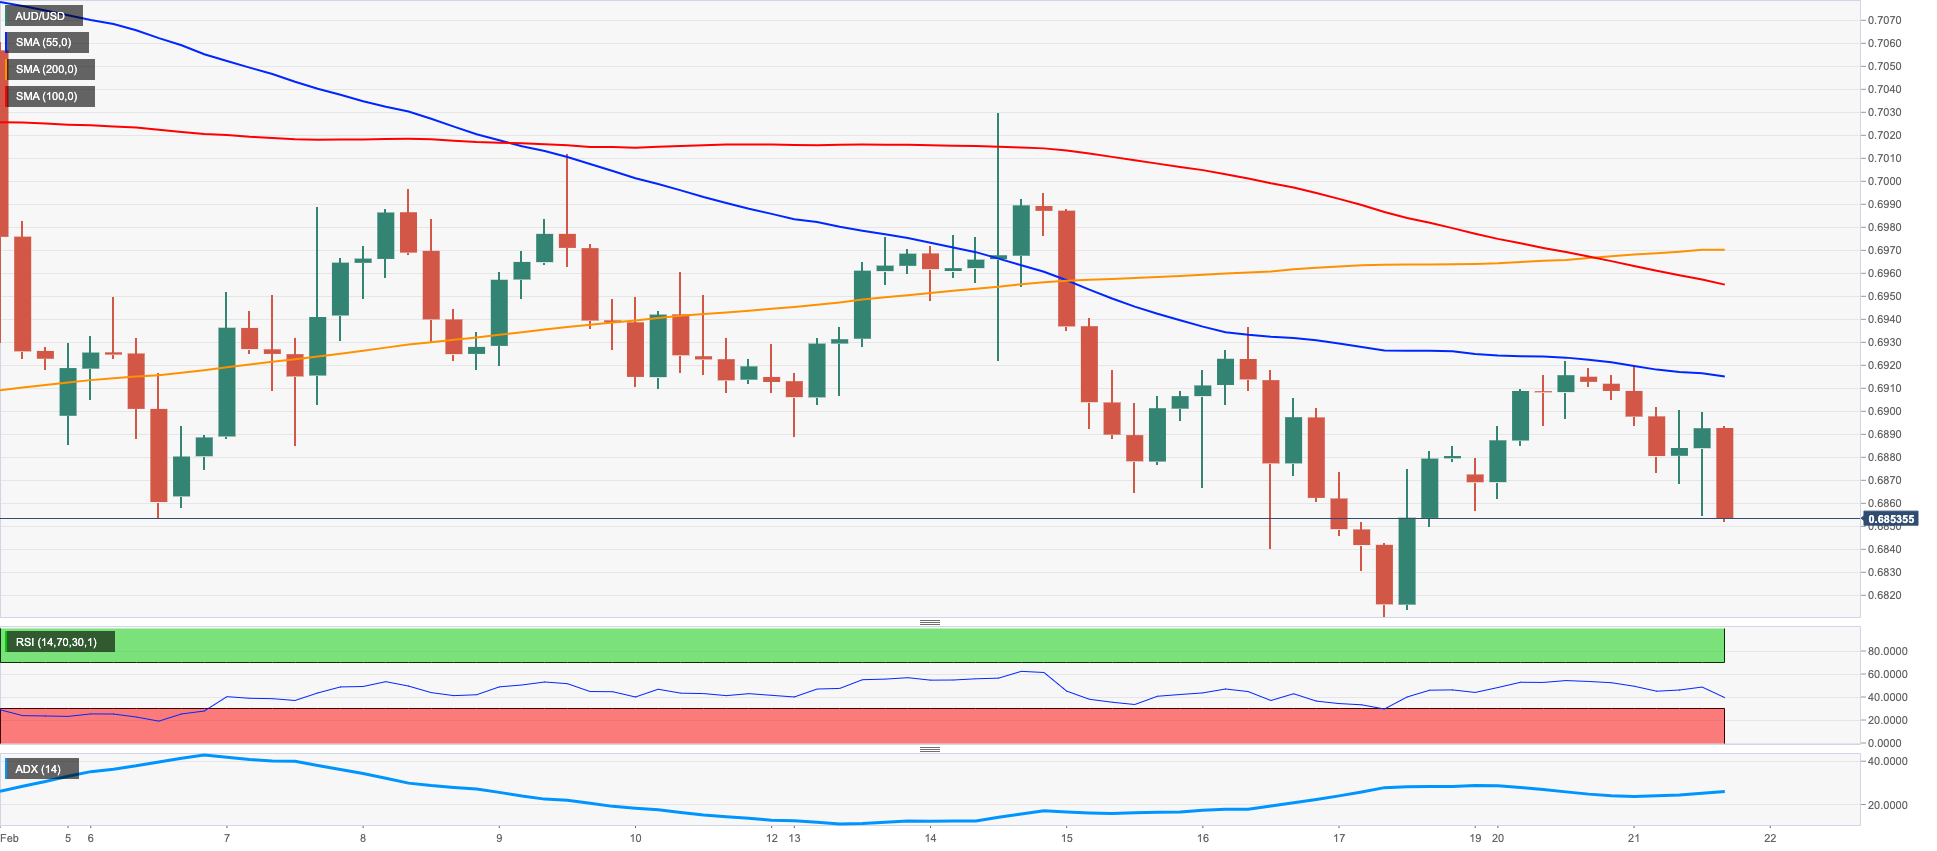
AUD/USD resumed the downside and rapidly faded the auspicious start of the week, returning to the mid-0.6800s following an earlier advance to the 0.6920 zone on Tuesday.
The bounce in the greenback weighed on the Aussie dollar and prompted the pair to give away part of the recent gains despite the generalized upbeat tone in the commodity complex and the precious metals and the hawkish tone from the RBA Minutes.
On the latter, the RBA Minutes fell on the hawkish side, in line with the recent speech by Governor R.Lowe and the Statement on Monetary policy (SoMP). Indeed, Board members showed concerns regarding the breath and persistence of inflation and the upside risks to wage growth. Participants also discussed a 50 bps rate hike before eventually raising rates by 25 bps, while the decision on how far rather could go remained data dependent. The Board also expects further rate hikes in the next months.
AUD/USD looks choppy so far this week. On the upside, the next target of note still appears at the weekly high at 0.7029 (February 14) prior to the 2023 top at 0.7157 (February 2). The breakout of the latter could motivate the pair to set sail to the round level at 0.7200 ahead of the June 2022 peak at 0.7282 (June 3). Just the opposite, there is an initial contention at the February low at 0.6811 (February 17) just ahead of the key 200-day SMA at 0.6802. Once this region is cleared, the pair could challenge the 2023 low at 0.6688 (January 3) before the December 2022 low at 0.6629 (December 20). The daily RSI lost traction and slipped back to the sub-43 area.
Resistance levels: 0.6920 0.6963 0.7029 (4H chart)
Support levels: 0.6850 0.6811 0.6722 (4H chart)
GOLD
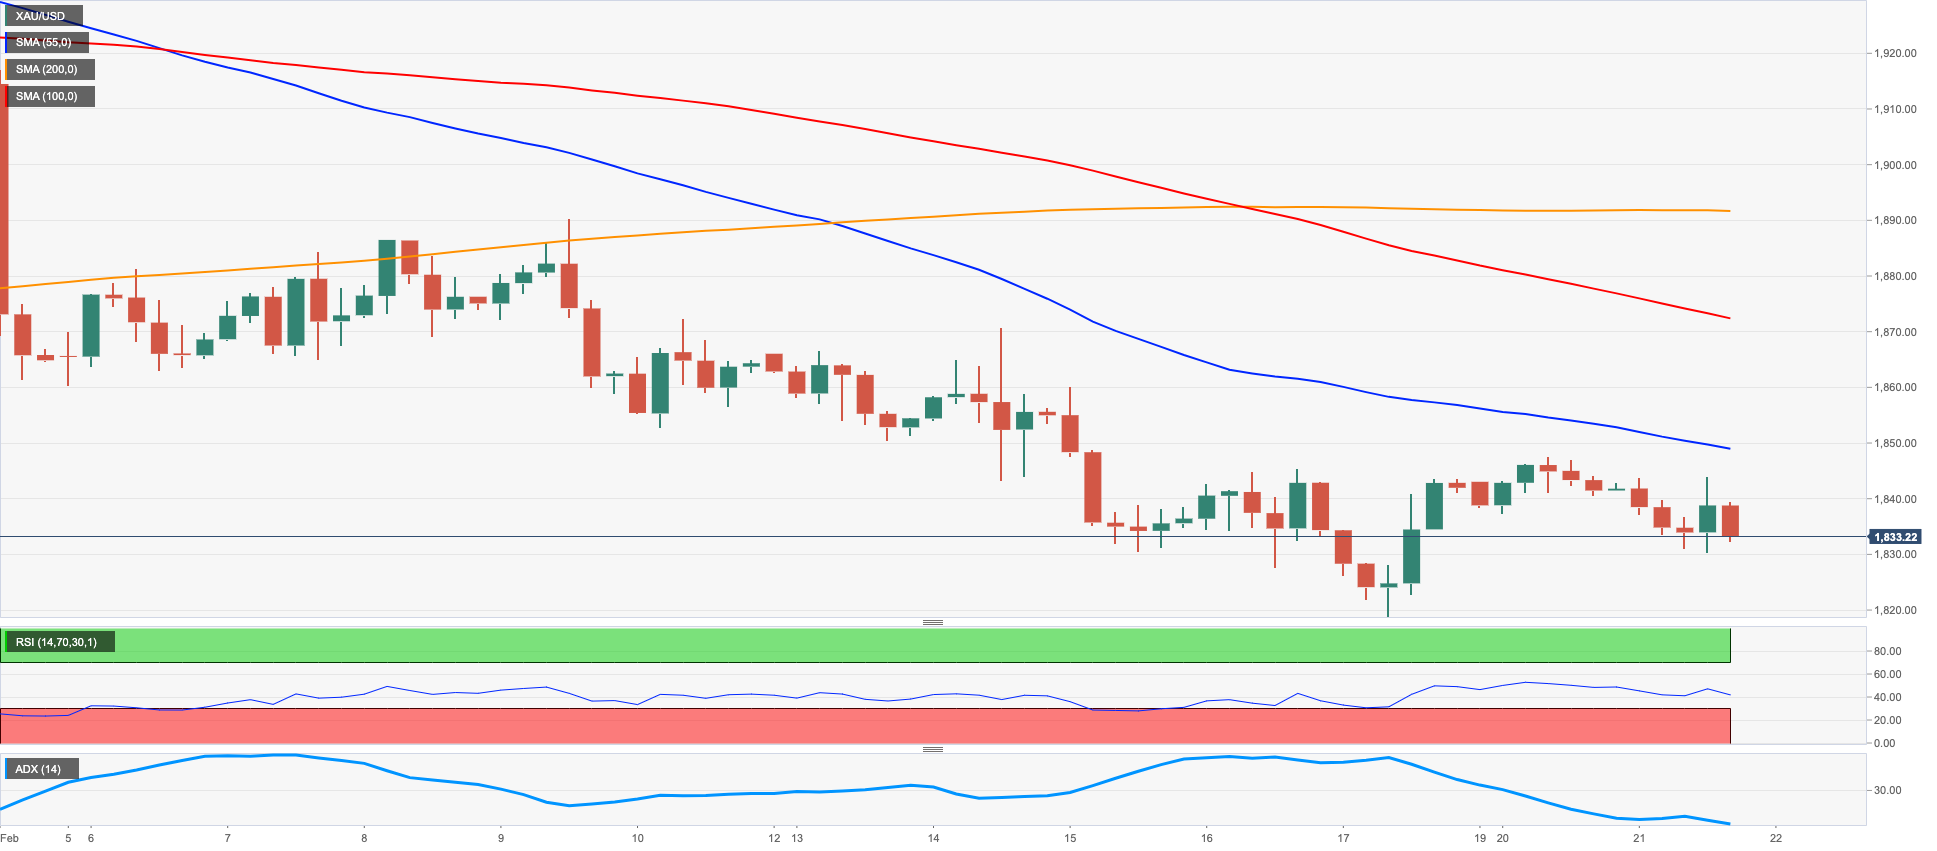
Gold prices grinded lower for the first time after three consecutive daily gains on Tuesday, returning to the $1830 region per ounce troy, where some initial contention seems to have emerged.
The daily rebound in the dollar put the precious metal under some moderate pressure along with the resumption of the march north in US yields across the curve, while some prudence has started to arise ahead of the publication of the FOMC Minutes (Wednesday) and the release of US inflation figures measured by the PCE (Friday).
In case sellers regain the initiative, gold could revisit the 2023 low at $1818 (February 17) ahead of the key $1800 region. Further south appears the provisional 100-day SMA at $1787 before the more significant 200-day SMA at $1776 and the weekly low at $1727 (November 23). On the other hand, the surpass of the interim 55-day SMA at $1855 could prompt a test of the weekly top at $1890 (February 9) to emerge on the horizon ahead of the 2023 high at $1959 (February 2) and the April 2022 top at $1998 (April 18). North from here comes the psychological $2000 mark seconded by the 2022 peak at $2070 (March 8).
Resistance levels: $1847 $1870 $1890 (4H chart)
Support levels: $1818 $1797 $1784 (4H chart)
CRUDE WTI
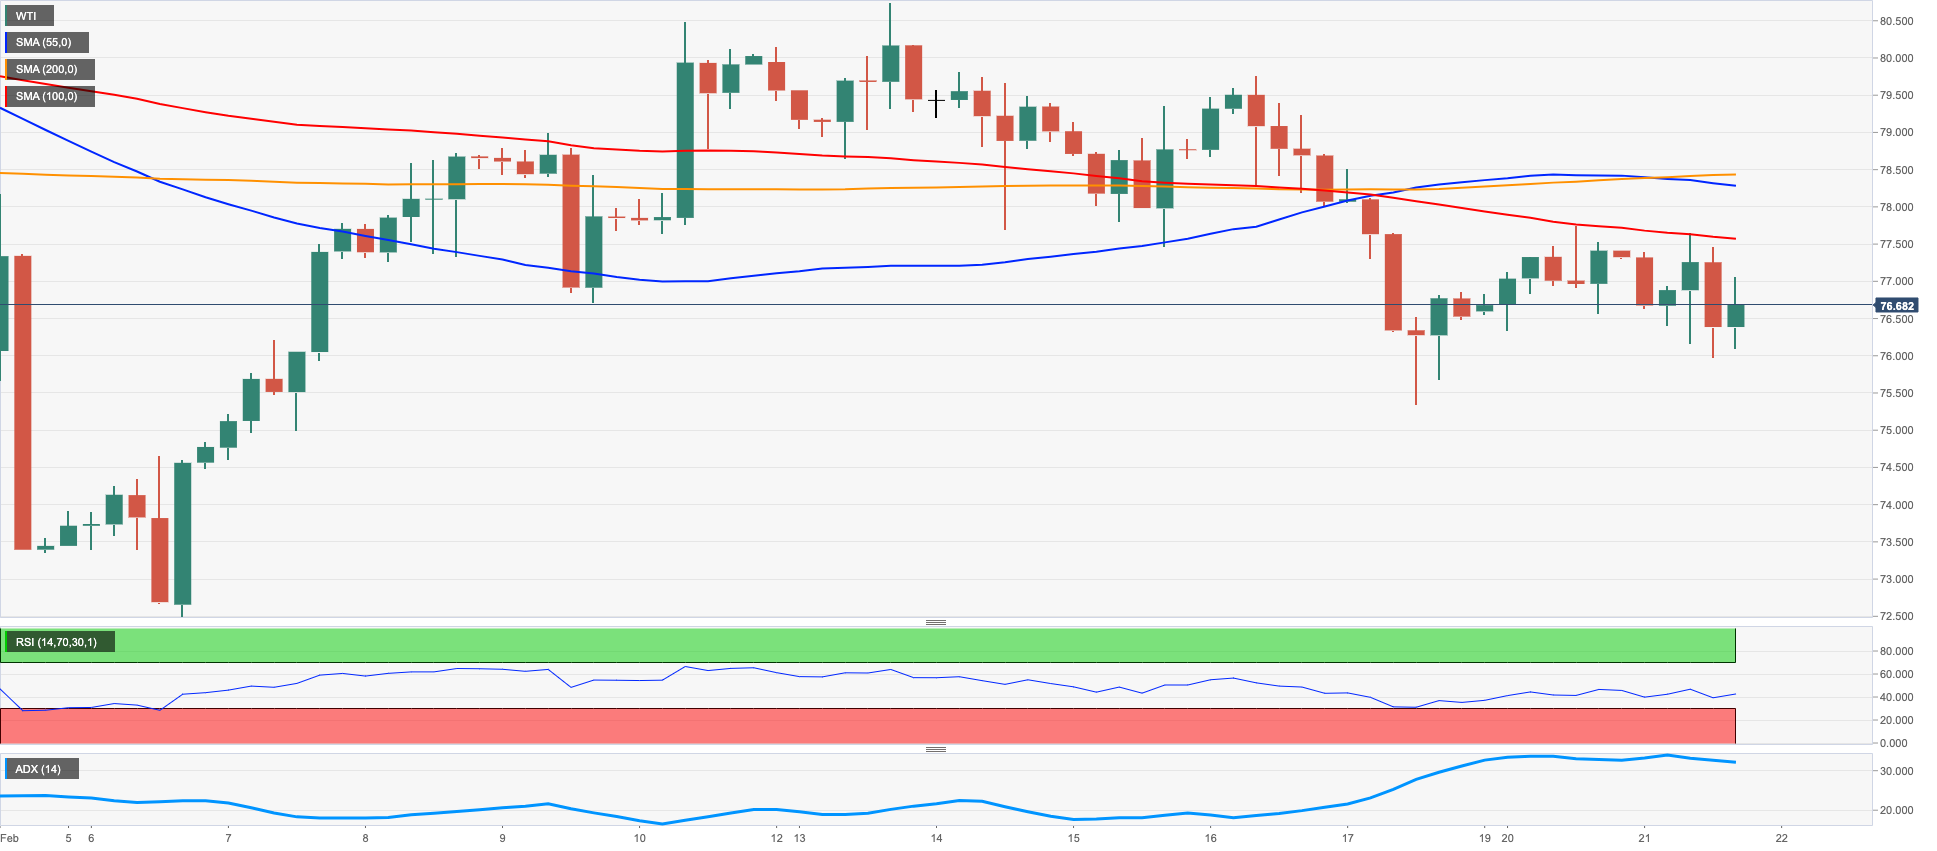
Prices of the American benchmark for the sweet light crude oil resumed the downtrend and briefly poked with the $76.00 mark per barrel on Tuesday.
In fact, fresh concerns around the impact on the demand for crude oil of a potential economic slowdown in response to further tightening by major central banks weighed on traders’ sentiment as well as the stronger dollar.
On the supply side, increasing Russian exports of crude oil coupled with the expected sell of 26M barrels from the US SPR and rising US inventories also added to the downbeat mood among traders.
Moving forward, the API and the EIA will publish their usual reports on US crude oil stockpiles for the week ended on February 17 on Wednesday and Thursday, respectively.
If losses accelerate, then the WTI is expected to dispute the weekly low at $75.36 (February 17) ahead of the 2023 low at $72.30 (February 6) and the 2022 low at $70.10 (December 9), which appears closely followed by the key round level at $70.00 and the weekly low at $66.15 (December 20 2021). By contrast, the February top at $80.57 (February 13) appears reinforced by the provisional 100-day SMA at $80.90, which precedes the 2023 peak at $82.60 (January 23). The breakout of this level could open the door to a visit to the December 2022 high at $83.32 (December 1) ahead of the $90.08 level (November 11 2022).
Resistance levels: $77.69 $78.12 $79.50 (4H chart)
Support levels: $76.10 $75.29 $72.22 (4H chart)
GER40
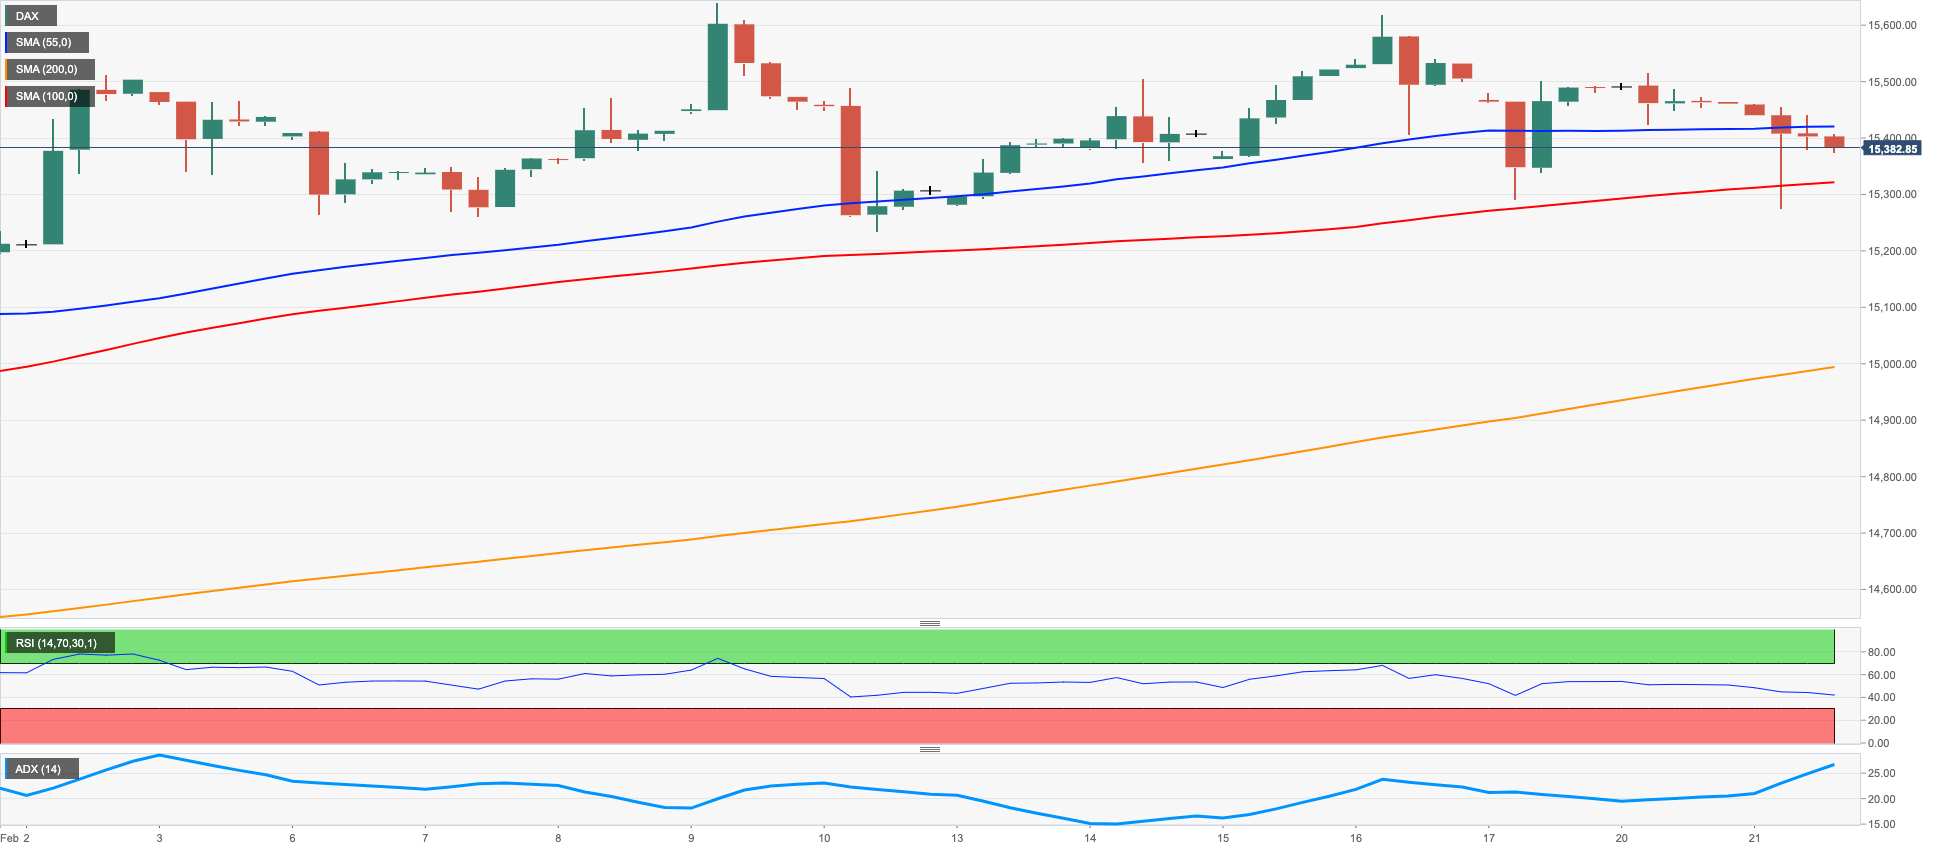
The German benchmark stock index DAX40 remained on the back foot on Tuesday, recording at the same time the third consecutive session with losses. Despite the daily pullback, the index managed well to keep the monthly consolidation theme intact in the upper end of the range.
German – and European – equities retreated on Tuesday pari passu with the deteriorated sentiment among market participants following disheartening prints from advanced manufacturing gauges in the old continent.
In addition, ECB Chairwoman C.Lagarde reiterated the bank’s intention to raise the policy rate by half percentage point at the March gathering, adding that further decision on rates will be data dependent.
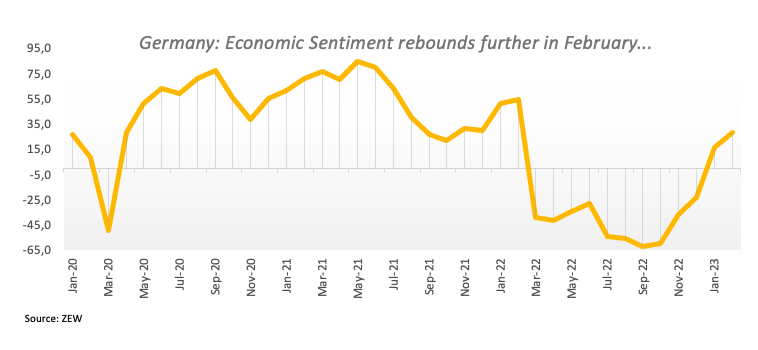
In the domestic calendar, flash readings showed the Manufacturing PMI is seen receding to 46.5 in February (from 47.3) vs. an expected improvement to 51.3 in the Services PMI (from 50.7). Additional data saw the Economic Sentiment measured by the ZEW Institute rebound further to 28.1 for the current month.
In the German money market, the 10-year Bund yields flirted with multi-week tops past the 2.55% level.
A break above the current consolidative phase could put the DAX40 en route to challenge the 2023 high at 15658 (February 9) prior to the February 2022 top at 15736 (February 2 2022). Further up emerges the round level at 16000 before the 2022 peak at 16285 (January 5). In the opposite direction, the weekly low at 15246 (February 10) is expected to hold the initial test prior to another weekly low at 14906 (January 19) and the temporary 55-day SMA at 14782. The breach of the latter exposes a deeper decline to the December 2022 low at 13791 (December 20) and the key 200-day SMA at 13742. The daily RSI broke below the 60 level.
Best Performers: RWE AG ST, Linde PLC, Henkel VZO
Worst Performers: Siemens Energy AG, Adidas, Sartorius AG VZO
Resistance levels: 15634 15658 15736 (4H chart)
Support levels: 15286 15246 15185 (4H chart)
NASDAQ
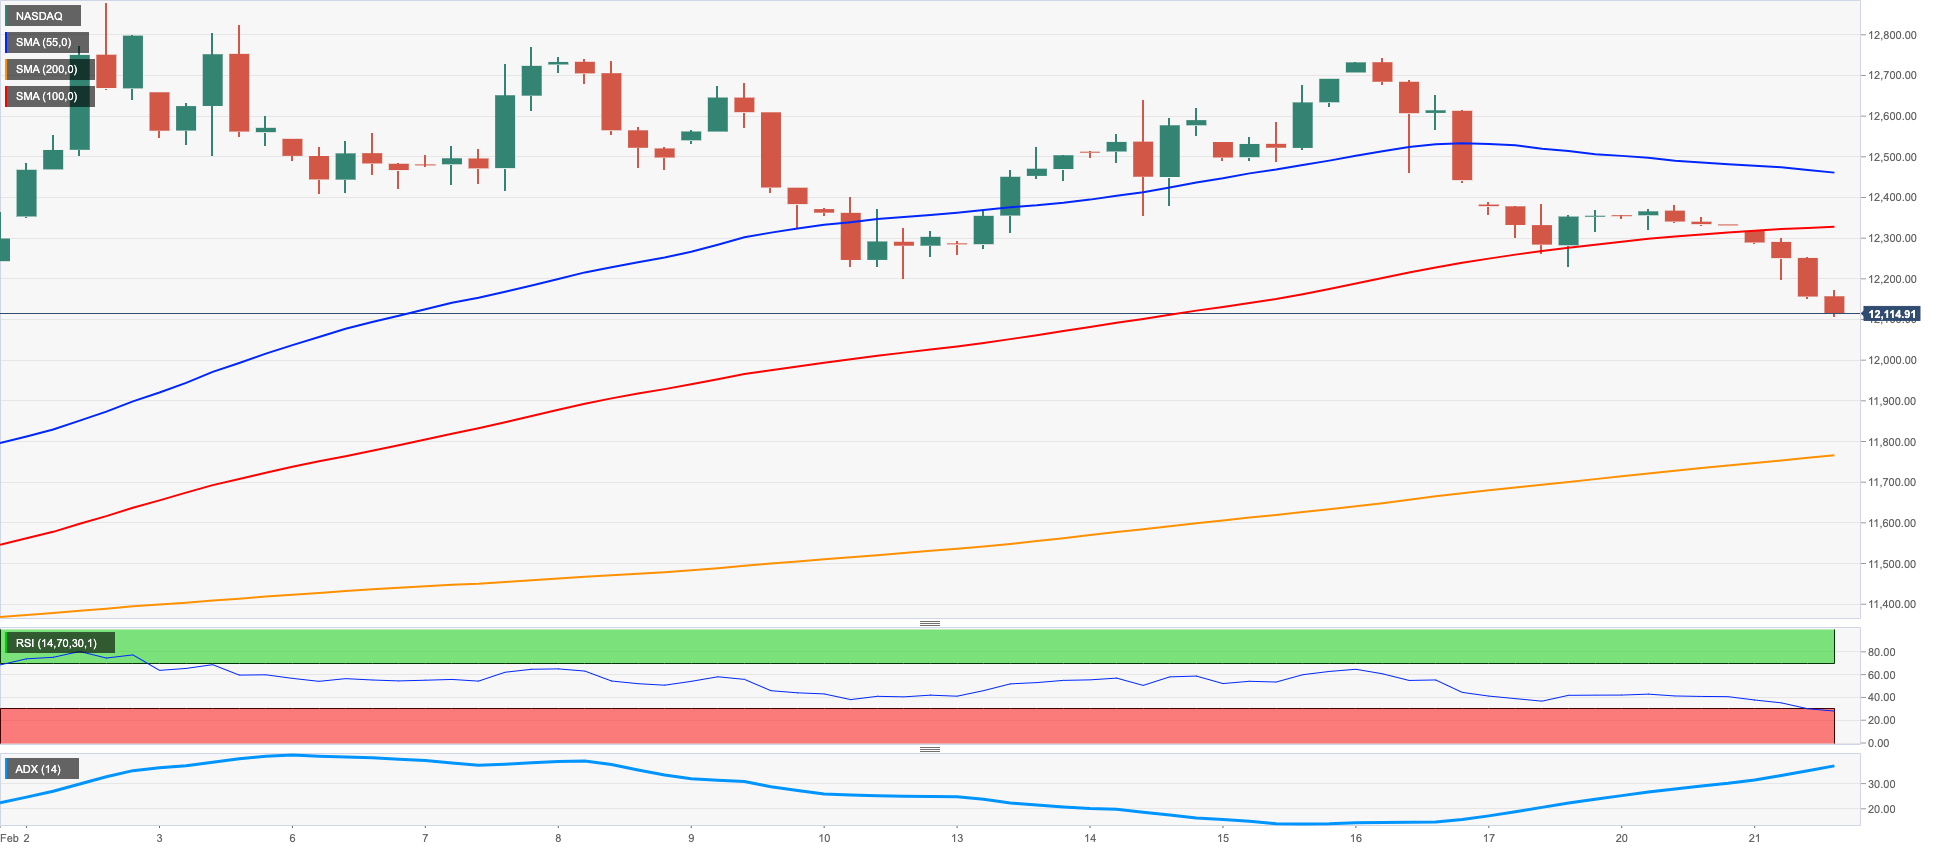
Techs equities tracked by the Nasdaq 100 accelerated the decline and slipped back to 3-week lows around the 12100 zone on Tuesday.
The sour mood swelled among traders following poor forecasts from retailers Walmart and Home Depot, dragging the Dow Jones and the rest of its major peers to levels last seen back in early February.
Also weighing on the tech sector appeared the intense move higher in US yields across the curve, as investors see the Fed moving past the 5% terminal rate in the next months, while the stronger dollar also helped with the downtick.
The continuation of the corrective pullback could see the Nasdaq 100 revisiting the key 200-day SMA at 11912 sooner rather than later. The breakdown of this region could put weekly lows at 11550 (January 25) and 11251 (January 19) back on the radar ahead of the January low at 10696 (January 6) and the December 2022 low at 10671 (December 22), all prior to the November 2022 low at 10632 (November 4). Having said that, the next up barrier remains at the 2023 high at 12880 (February 2) seconded by the round level at 13000 and the weekly top at 13175 (August 26 2022). The daily RSI breached the key 50 mark.
Top Gainers: Copart, AstraZeneca ADR, PepsiCo
Top Losers: JD.com Inc Adr, PDD Holdings DRC, Lucid Group
Resistance levels: 12689 12771 12880 (4H chart)
Support levels: 12110 11906 11550 (4H chart)
DOW JONES
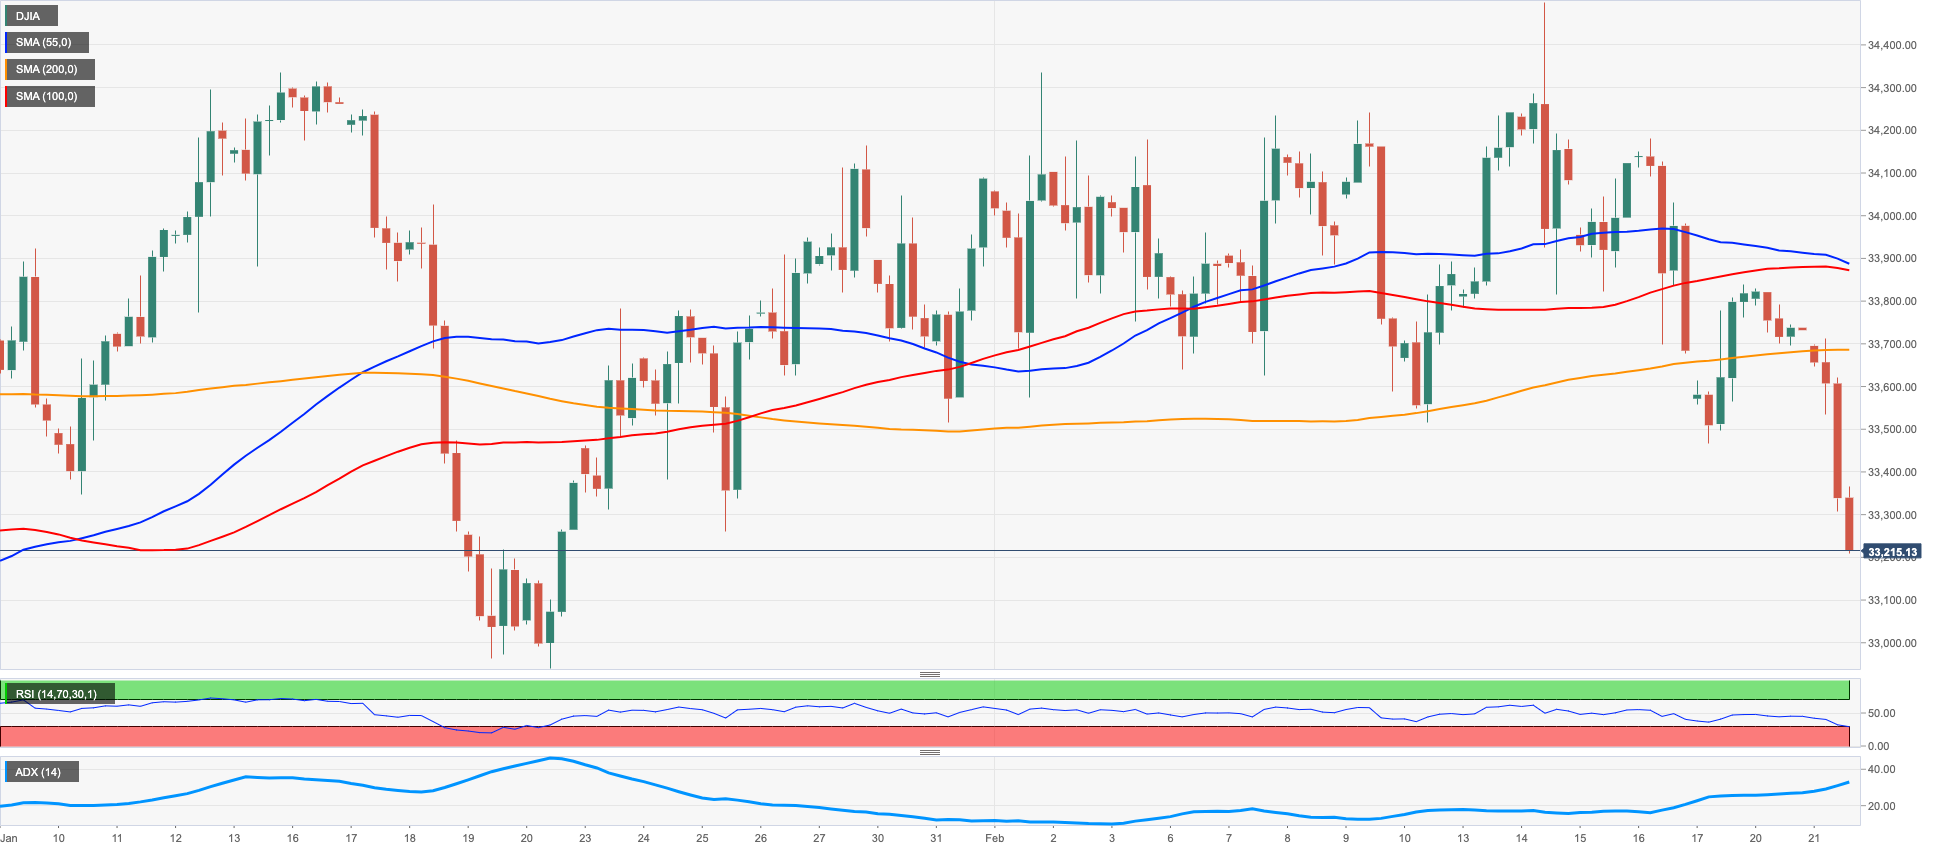
US equities tracked by the Dow Jones dropped to new 5-week lows - or more than 500 pts – to revisit the 33200 region on turnaround Tuesday.
Indeed, disappointing forecast earnings from retail giants Walmart and Home Depot weighed on investors’ sentiment and dragged the rest of the markets to the negative territory on Tuesday, as US traders returned to their desks following Monday’s holiday.
Collaborating with the sour mood in US stocks also emerged the moderate rebound in the dollar, the unabated rally in US yields and lower crude oil prices.
On the whole, the Dow Jones retreated 1.56% to 33291, the S&P500 dropped 1.58% to 4014 and the tech-heavy Nasdaq Composite lost 2.06% to 11545.
A deeper retracement could see the Dow Jones revisit the weekly low at 32948 (January 20) just ahead of the 100-day SMA at 32825. South from here aligns the December 2022 low at 32573 (December 22) prior to the key 200-day SMA at 32342. On the flip side, the immediate resistance level appears at the 2023 high at 34342 (January 13) ahead of the December 2022 top at 34712 (December 13) and the April 2022 top at 35492 (April 21). The surpass of the latter could put a potential visit to the February 2022 high at 35824 (February 9) back on the radar. The daily RSI sunk below the 42 yardstick.
Top Performers: Procter & Gamble, Walmart, Merck&Co
Worst Performers: Home Depot, Intel, 3M
Resistance levels: 34334 34712 35492 (4H chart)
Support levels: 33240 32948 32767 (4H chart)
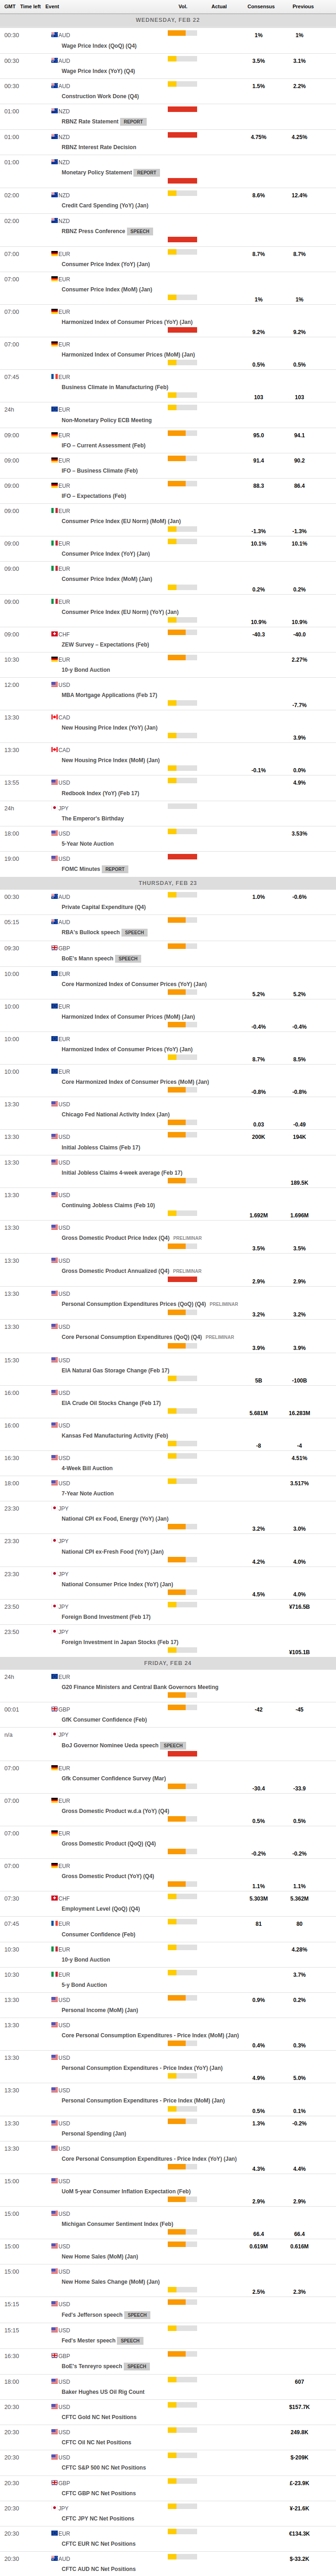
MACROECONOMIC EVENTS
All Information & Updates provided by:

All information relating to the financial markets available on this page has been prepared and issued by FXStreet (Forexstreet SL, Spain, Reg: B62498233) on the basis of publicly available information and all information believed to be reliable and does not conflict with Kuwaiti local laws, and all necessary care has been taken to before the company to ensure that the facts mentioned are correct from the source.
NCM Investment nor any of its directors or employees shall in any way be held responsible for the contents of this news, and the information contained on this page is intended only to provide clients with publicly available information and should not be construed as investment advice, report or analysis and/or constitute an offer or invitation to buy or sell financial instruments of any kind.
RISK WARNING: Forex and CFDs are highly risky leveraged products, as losses can exceed deposits. Please ensure you understand all the risks and take independent advice if necessary. NCM will segregate the clients based on the criteria of the regulator and its bylaws. NCM does not provide any advisory service; the material published does not constitute advice or a recommendation for a transaction in any financial instrument. NCM accepts no responsibility for any use of the content presented and any consequences of that use. Anyone acting on the information provided does so at their own risk.