
- Contact Us:
-

-

-

-


Daily Market Updates
23 Feb 2023
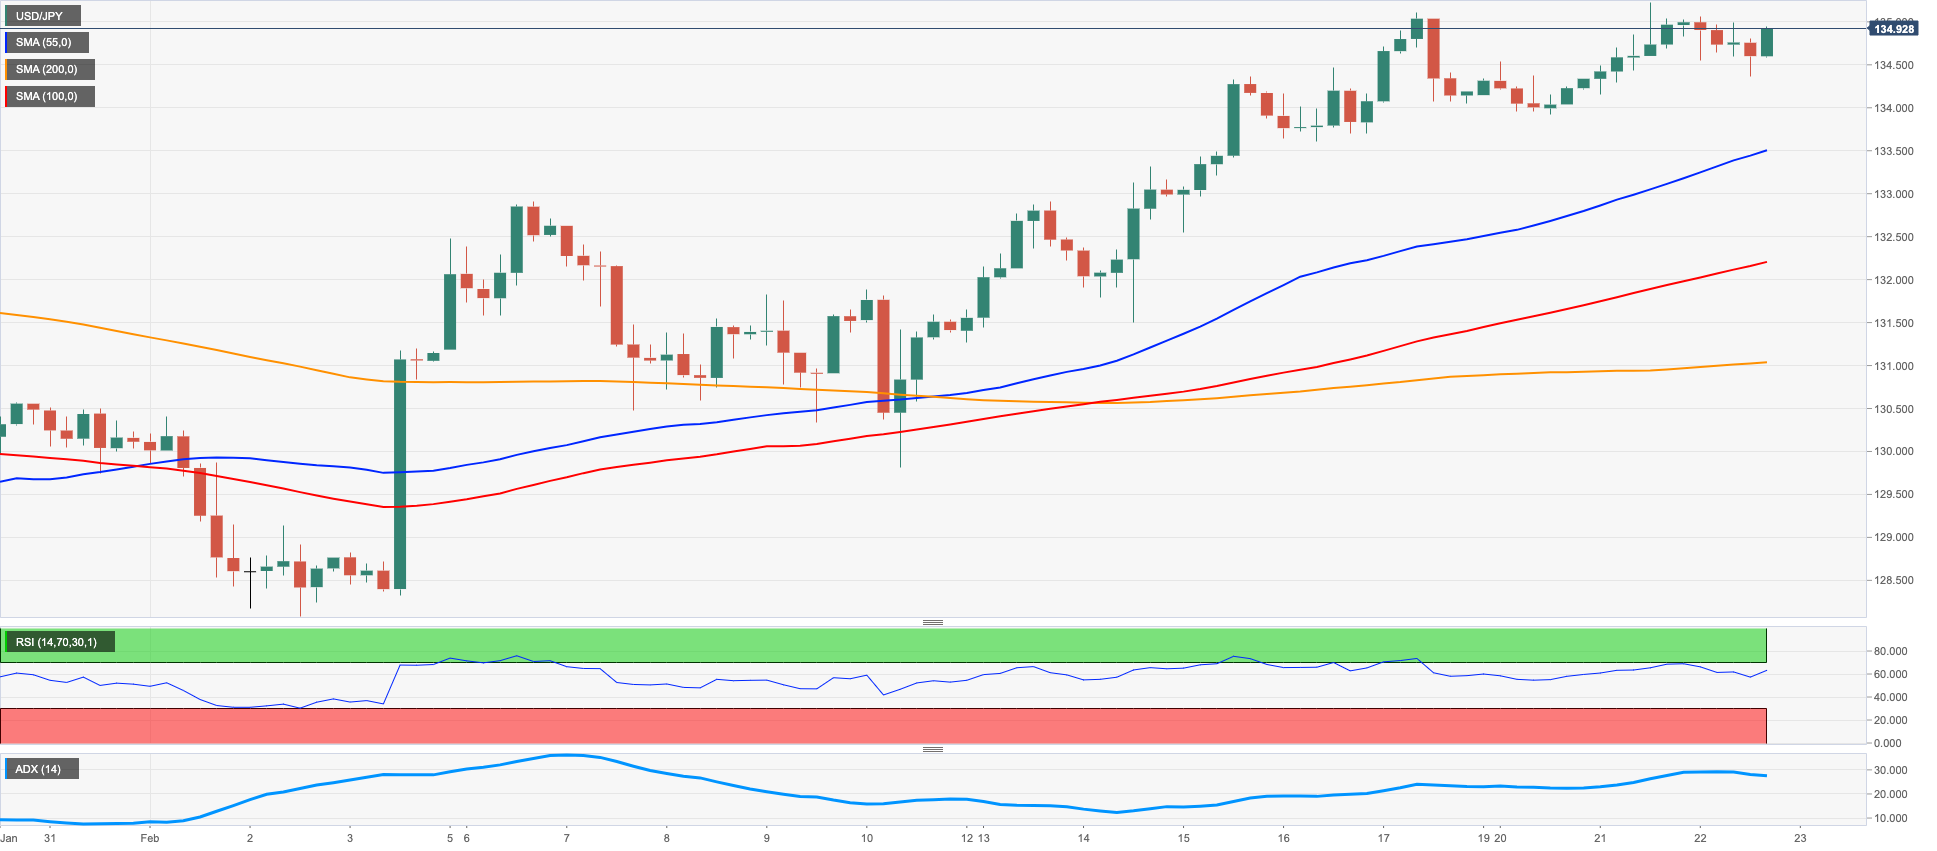
USDJPY
USD/JPY came under some moderate downside pressure on the back further gains in the greenback and the corrective decline in US yields across the curve.
In fact, the pair gave away some gains after hitting new 2023 peaks near 135.20 on Tuesday, always supported by speculation of a tighter-for-longer Fed and the move to multi-week tops in US yields.
In the Japanese money market, further consolidation appeared on the cards for the JGB 10-year yields on Wednesday.
From the BoJ, Board member N.Tamura, reiterated that the widening of the YCC band back in December did not mean a tightening of the monetary policy stance. He also left the door open to a future assessment of the monetary policy framework, although he considered the current monetary conditions appropriated. He, however, warned against risks of inflation overshooting expectations.
In Japan, the Reuters Tankan Index improved a tad to -5 for the current month (from -6) in what was the sole release in the docket.
The resumption of the upside momentum in USD/JPY is expected to retarget the 2023 top at 135.22 (February 21). Beyond this level emerges the key 200-day SMA at 136.99, which is also reinforced by the interim 100-day SMA at 137.34 and comes prior to weekly highs at 138.17 (December 15 2022) and 139.89 (November 30 2022), all ahead of the key round level at 140.00. On the opposite side, initial contention turns up at the temporary 55-day SMA at 132.23 before the weekly low at 129.79 (February 10) and the February low at 128.08 (February 2). A deeper drop could put the 2023 low at 127.21 (January 16) back on the radar prior to the May 2022 low at 126.36 (May 24) and the weekly low at 121.27 (March 31 2022). The daily RSI lost some traction and eased below the 65 level.
Resistance levels: 135.22 137.47 138.17 (4H chart)
Support levels: 133.91 133.60 132.64 (4H chart)
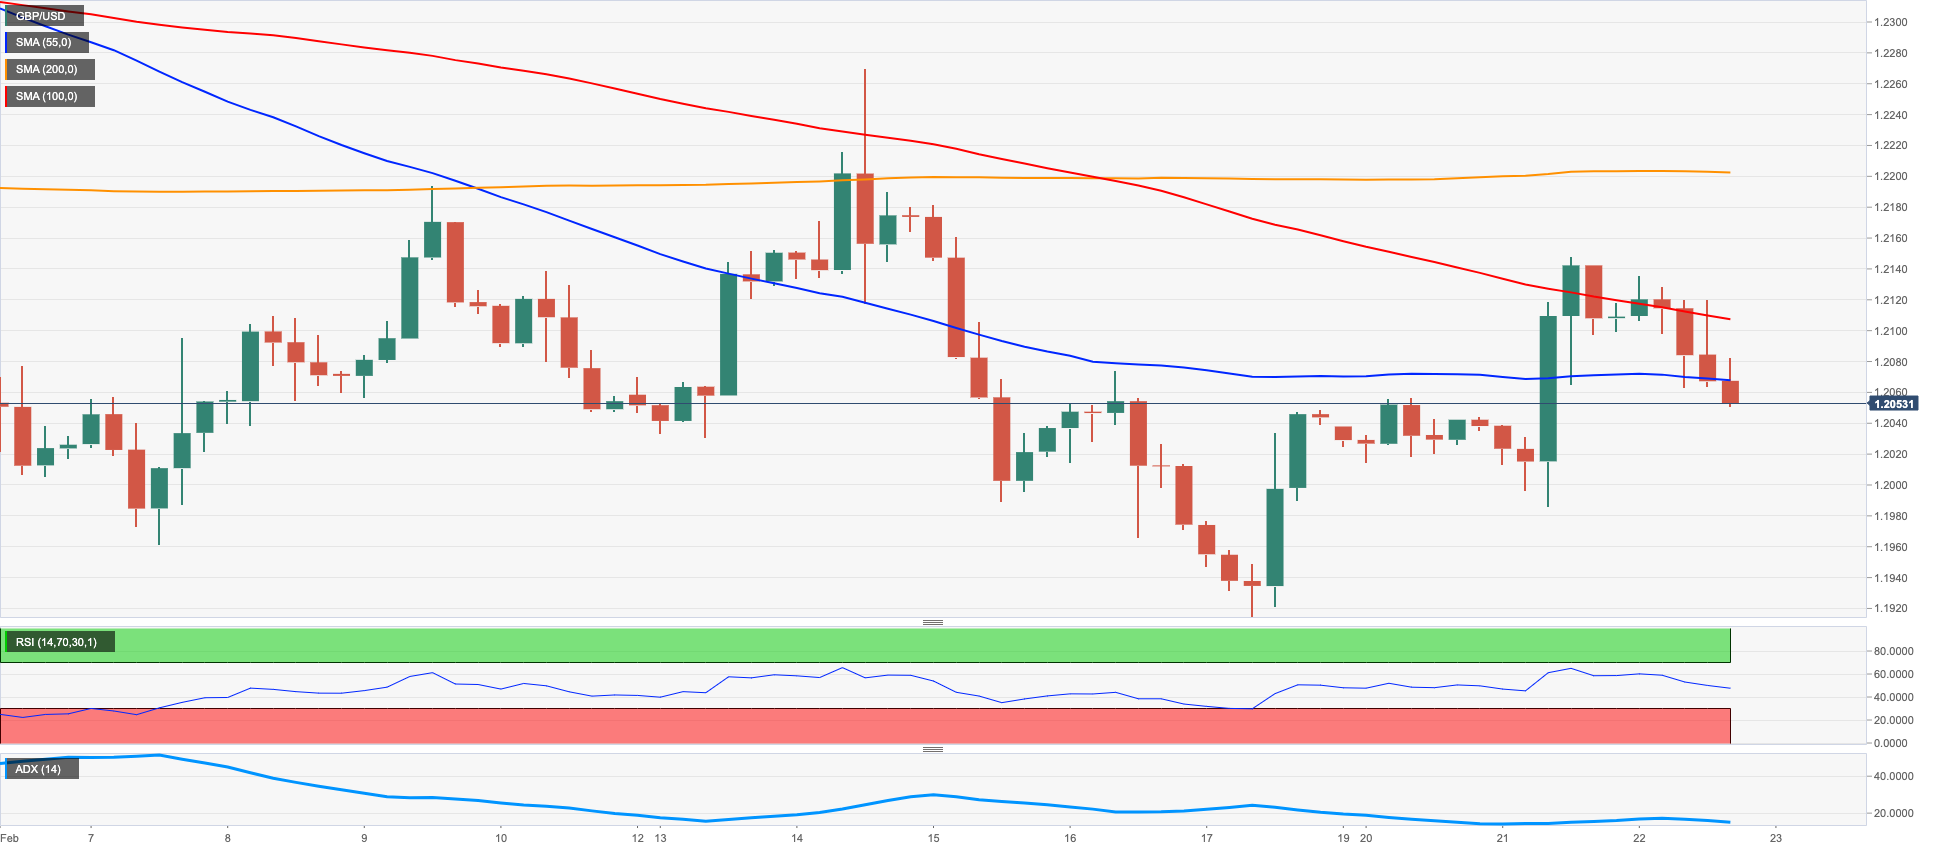
GBPUSD
GBP/USD traded on the back foot and gave away part of Tuesday’s strong advance amidst further buying interest around the greenback on Wednesday.
In fact, the bid bias in the dollar gathered extra pace in the wake of the release of the FOMC Minutes of the Fed’s February gathering, which in turn morphed into extra downside pressure in the risk complex.
In the UK bond market, the 10-year Gilt yields climbed to fresh 2023 highs in levels just short of 3.70% amidst mounting speculation of a higher terminal rate by the Bank of England, which currently gyrates around 4.60% by September.
There were no data releases scheduled in the UK docket on Wednesday.
Further recovery in GBP/USD faces a temporary resistance at the 55-day SMA at 1.2168 ahead of the weekly top at 1.2269 (February 14) and the 2023 peak at 1.2447 (January 23). North from here emerges the May 2022 high at 1.2666 (May 27) prior to the 200-week SMA at 1.2887, which is followed by the psychological 1.3000 mark. The other way around, the February low at 1.1914 (February 17) remains bolstered by the 200-day SMA at 1.1933 and the temporary 100-day SMA at 1.1921. The loss of this region could pave the way for a probable decline to the 2023 low at 1.1841 (January 6). The daily RSI receded marginally to the proximity of the 45 level.
Resistance levels: 1.2147 1.2197 1.2269 (4H chart)
Support levels: 1.2050 1.1985 1.1914 (4H chart)
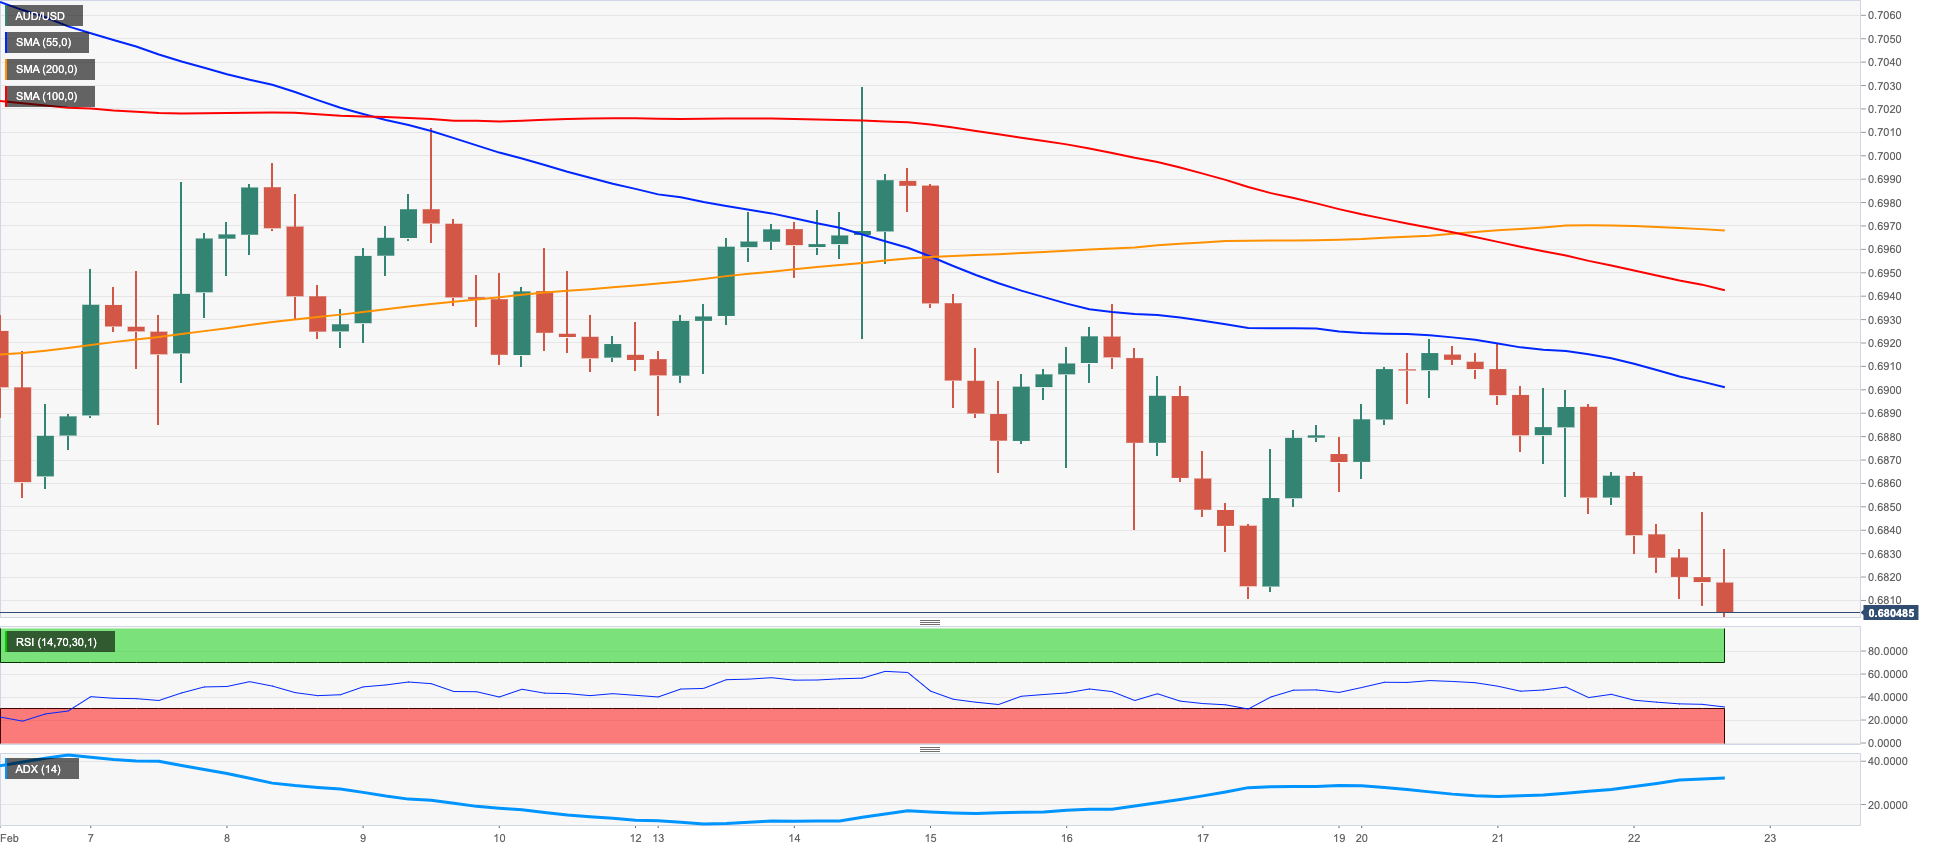
AUDUSD
Further upside pressure in the dollar forced AUD/USD to add to Tuesday’s losses and revisit at the same time fresh lows in the 0.6800 neighbourhood, where the key 200-day SMA also sits.
In addition, the generalized downbeat mood in the commodity universe saw copper prices give away part of the recent marked advance and the iron ore chart marginal gains, all putting the Aussie dollar under extra selling pressure.
The pair also derived further weakness after the Australian Wage Price Index expanded below expectations at an annualized 3.3% in Q4, while the Westpac Leading Index contracted 0.08% MoM in January.
Immediately to the downside for AUD/USD now comes the key 200-day SMA at 0.6801 prior to the 2023 low at 0.6688 (January 3) and the December 2022 low at 0.6629 (December 20). For all that, the weekly top at 0.7029 (February 14) emerges as the next up barrier of note seconded by the 2023 peak at 0.7157 (February 2). Further north appears the round level at 0.7200 prior to the June 2022 high at 0.7282 (June 3). The daily RSI retreated to the sub-40 area.
Resistance levels: 0.6920 0.6966 0.7029 (4H chart)
Support levels: 0.6803 0.6722 0.6688 (4H chart)
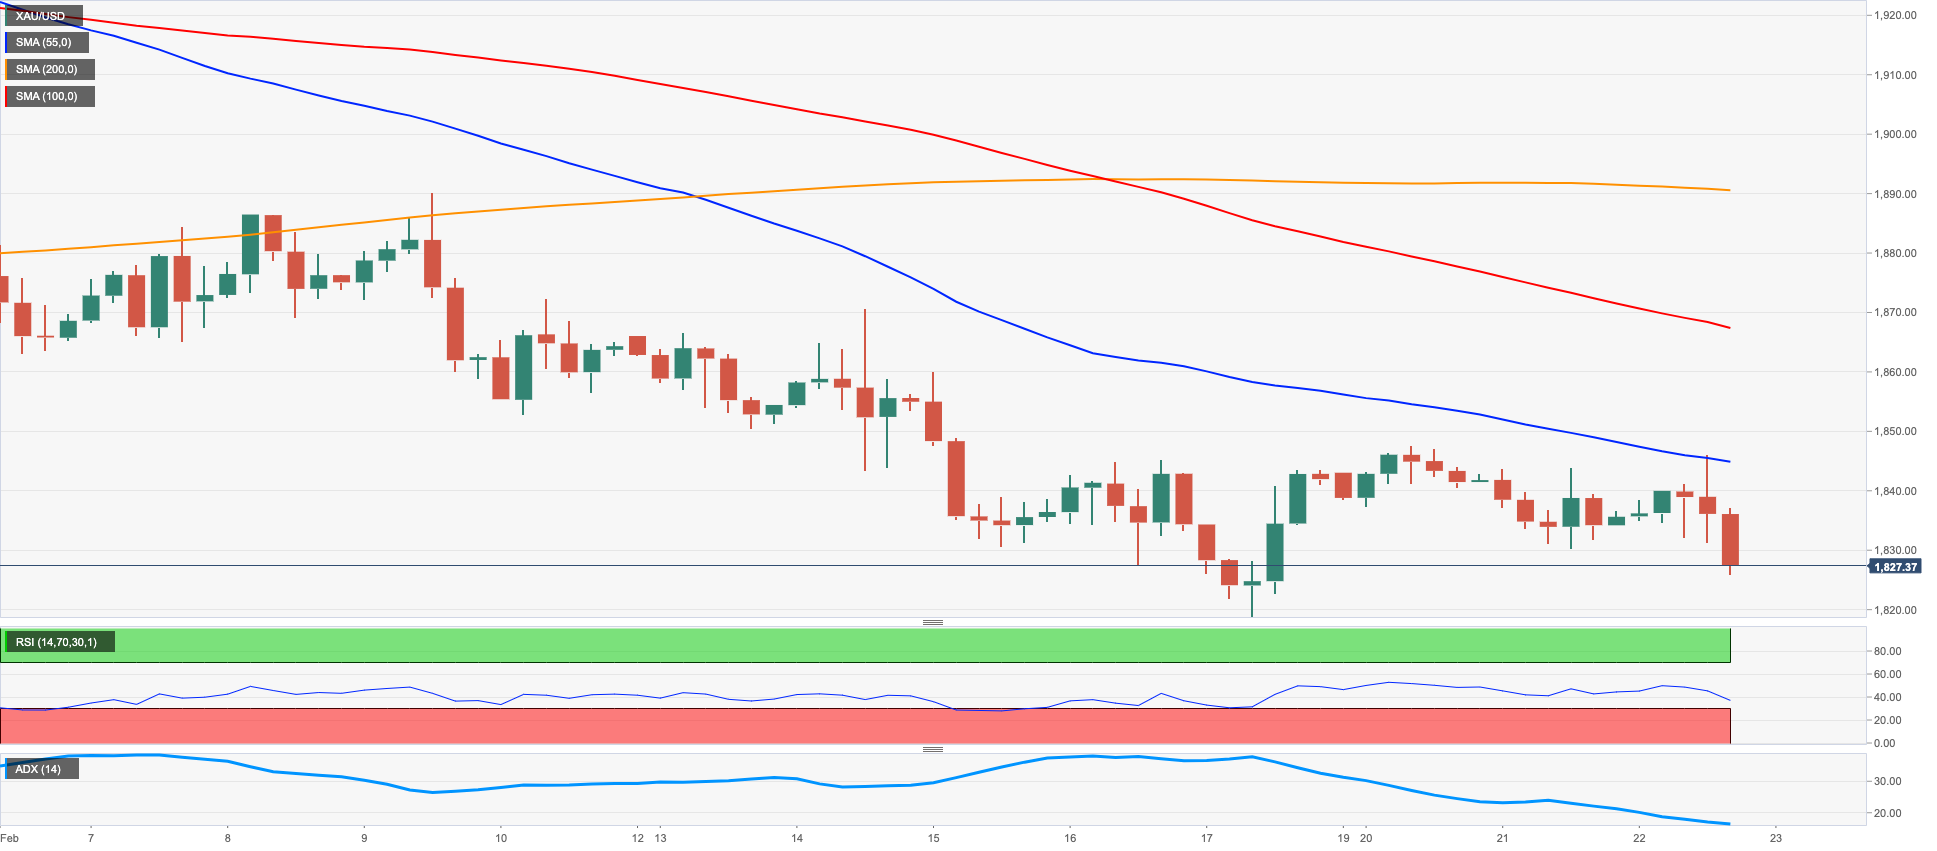
GOLD
Gold prices extended the weekly consolidative mood around the $1830/25 region on the back of the firm recovery in the dollar on Wednesday.
The loss of momentum in US yields, however, seems to have limited the downside in the precious metal, although the prospects for extra tightening by the Federal Reserve – as per the FOMC Minutes – are expected to keep the yellow metal under scrutiny for the time being.
Further downside pressure in gold should prompt a test of the 2023 low at $1818 (February 17) to emerge on the horizon ahead of the key $1800 zone. The breach of the latter could pave the way for a test of the interim 100-day SMA at $1788 just prior to the key 200-day SMA at $1776 and the weekly low at $1727 (November 23). Just the opposite, the provisional 55-day SMA at $1856 offers some initial resistance ahead of the weekly peak at $1890 (February 9) and the 2023 top at $1959 (February 2). The surpass of this level should lead up to a visit to the April 2022 peak at $1998 (April 18) just ahead of the psychological $2000 mark and the 2022 high at $2070 (March 8).
Resistance levels: $1847 $1870 $1889 (4H chart)
Support levels: $1825 $1818 $1797 (4H chart)
CRUDE WTI
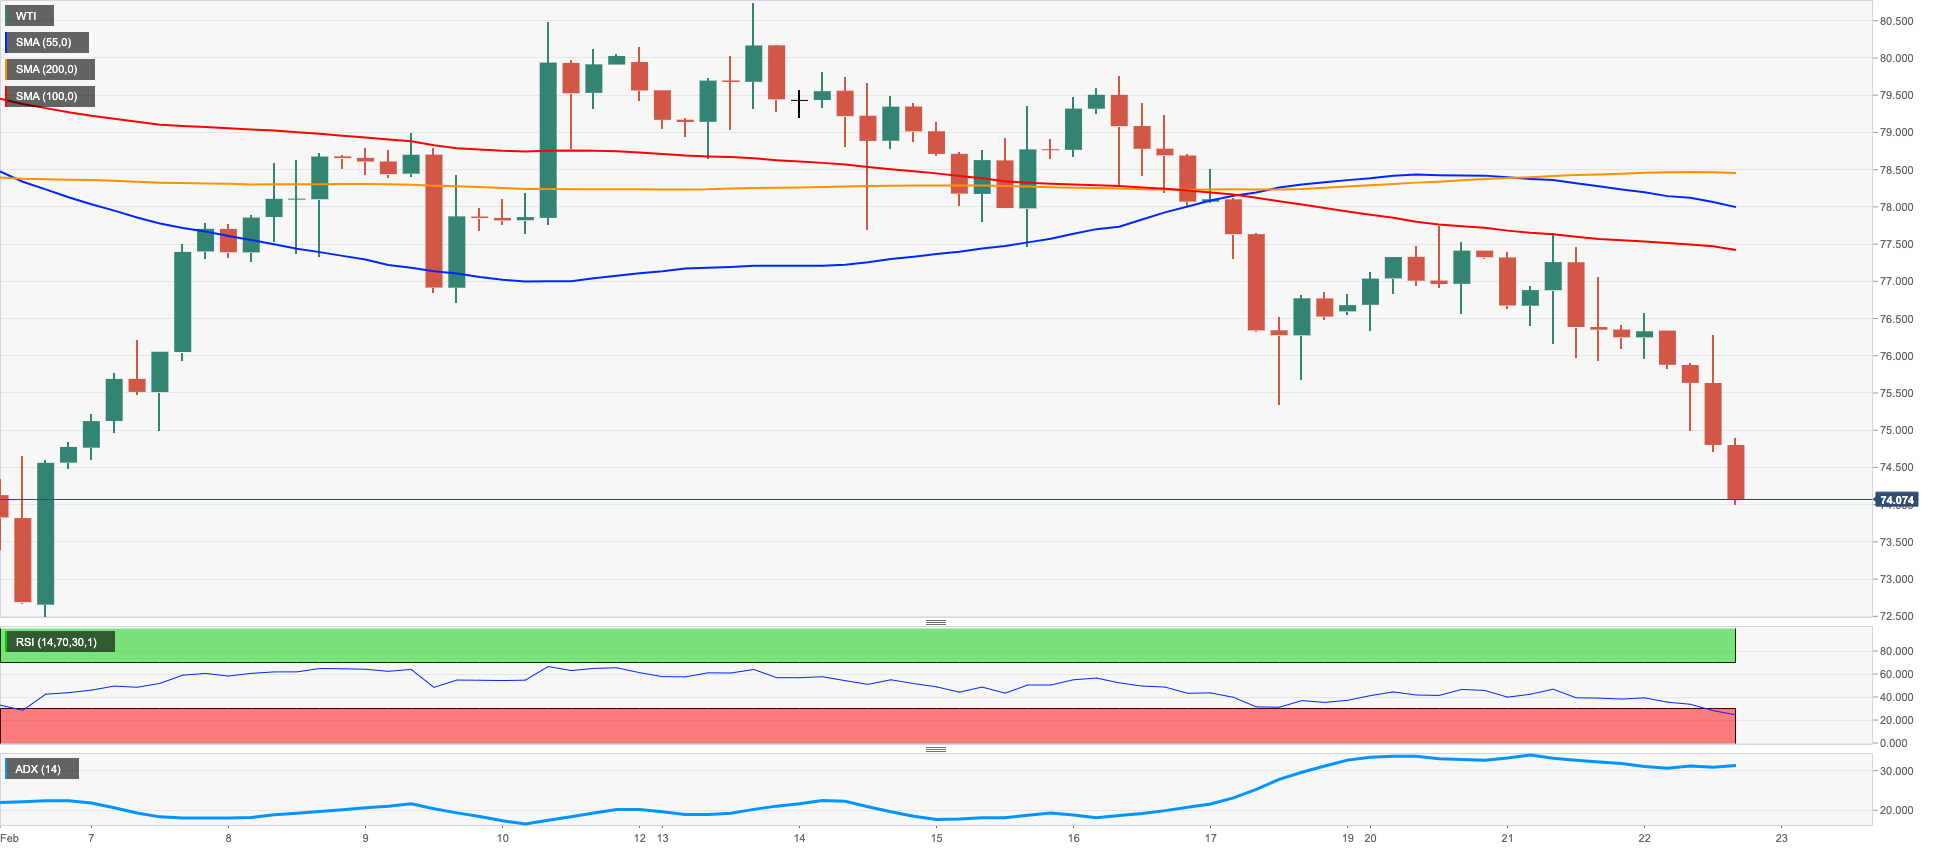
WTI prices sunk to fresh 2-week lows near the $74.00 mark per barrel on Wednesday, retreating for the second session in a row and extending further the pullback from monthly tops north of the $80.00 mark recorded on February 13.
This time, demand concerns picked up pace on the back of renewed fears around a probable economic slowdown in response to the continuation of the tightening cycle by major central banks. These jitters were exacerbated further following the release of the FOMC Minutes late on Wednesday.
Also weighing on traders’ sentiment appeared the strong note in the dollar ahead of the release of the weekly report on US crude oil inventories by the EIA (Thursday).
Next on the downside for WTI comes the 2023 low at $72.30 (February 6) seconded by the 2022 low at $70.10 (December 9), which turns up just ahead of the key round level at $70.00 and the weekly low at $66.15 (December 20 2021). In the opposite direction, there are no hurdles of note until the February peak at $80.57 (February 13), which looks underpinned by the temporary 100-day SMA at $80.80. Once this region is cleared, the commodity could confront the 2023 high at $82.60 (January 23) followed by the December 2022 top at $83.32 (December 1) and the $90.08 level (November 11 2022).
Resistance levels: $77.69 $78.16 $79.50 (4H chart)
Support levels: $73.97 $72.22 $70.07 (4H chart)
GER40
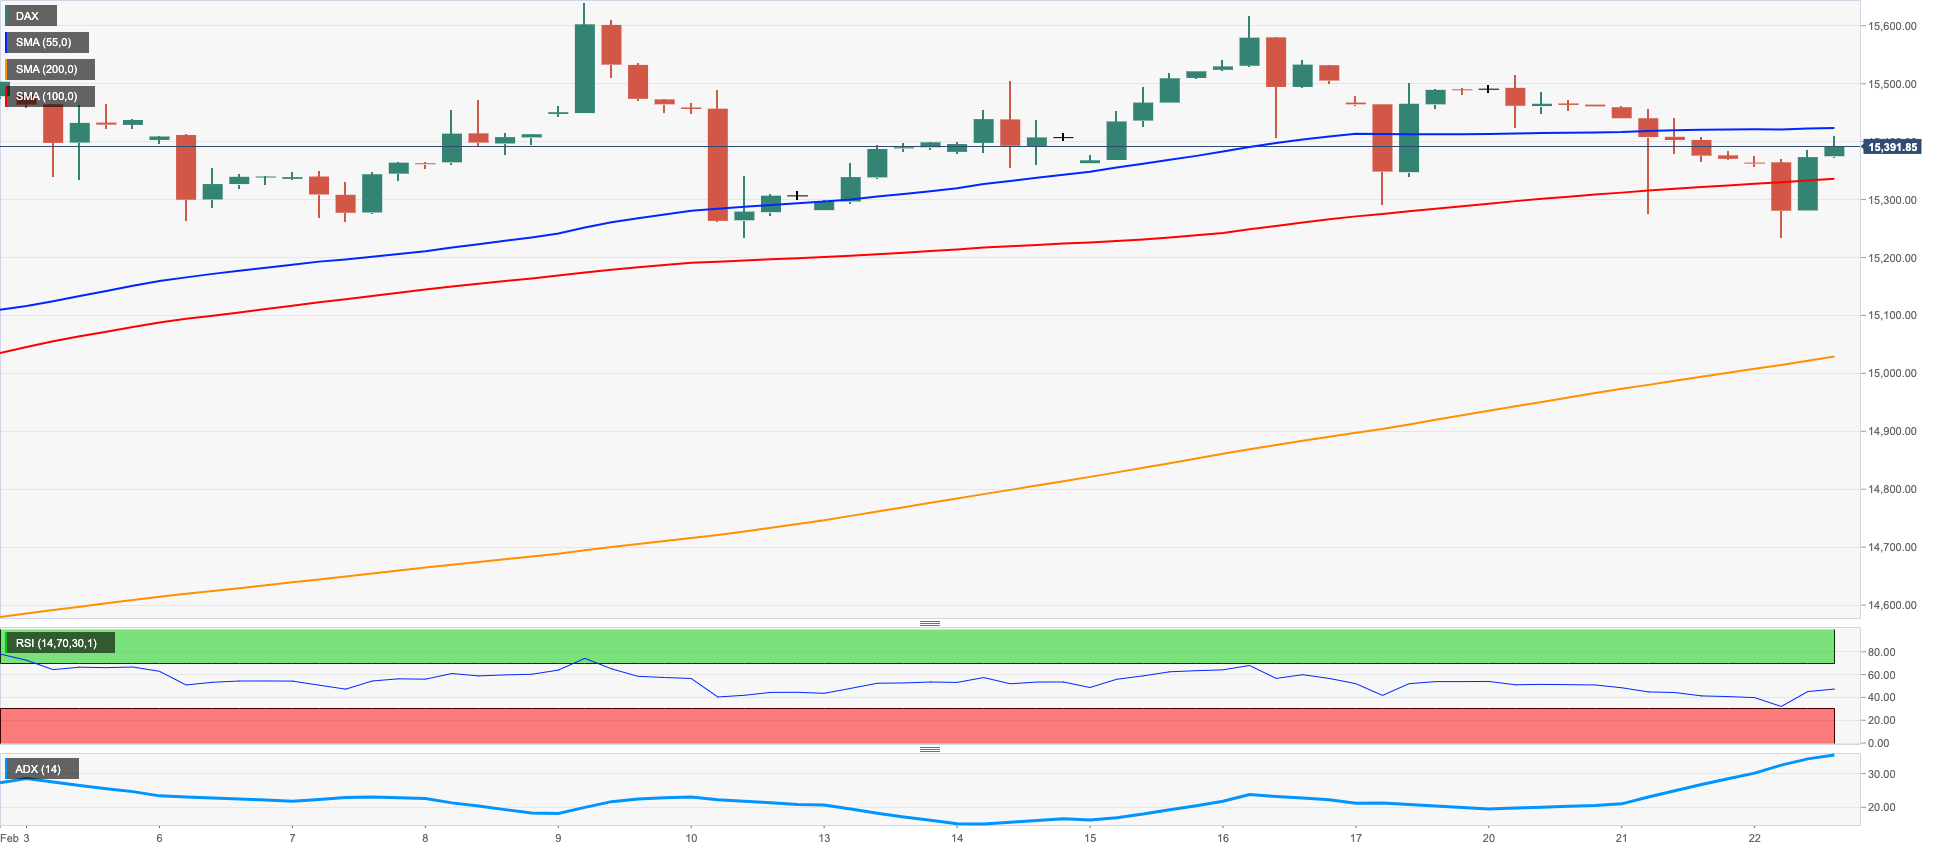
German equities tracked by the DAX40 maintained the monthly range bound theme well in place and advanced marginally to the 15400 region on Wednesday.
The index navigated a tight range as market participants remained cautious following final inflation figures in Germany during January, which showed a rebound in inflationary pressures, all in a context where Chairwoman Lagarde reiterated once again the bank’s intention to hike rates by 50 bps at the March event.
Th sour mood in markets around the old continent also found support in response to further disappointing corporate earnings results.
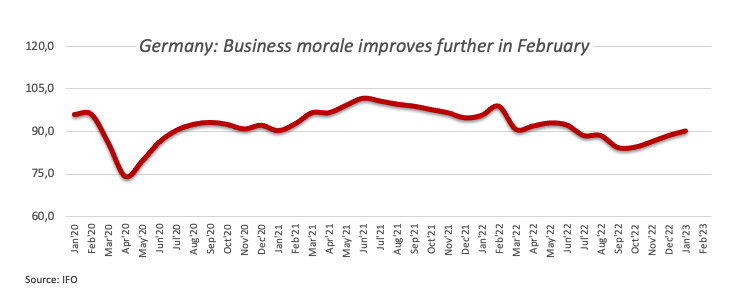
In Germany then, final figures saw the CPI rise 8.7% in the year to January (from 8.1%) and 1.0% vs. the previous month. On a more positive side, the Business Climate tracked by the IFO institute rose modestly to 91.1 in February (from 90.1).
The German 10-year Bund yields, in the meantime, dropped a tad and revisited the 2.50% zone.
The breach of the weekly low at 15246 (February 10) should put the DAX40 en route to a potential visit to another weekly low at 14906 (January 19) ahead of the interim 55-day SMA at 14801. Down from here aligns the December 2022 low at 13791 (December 20) seconded by the key 200-day SMA at 13748. On the flip side, the immediate hurdle is expected at the 2023 top at 15658 (February 9) followed by the February 2022 peak at 15736 (February 2 2022). If the index clears the latter, it could then challenge the round level at 16000 ahead of the 2022 high at 16285 (January 5). The daily RSI appeared stable around 58.
Best Performers: Fresenius Medical Care KGAA ST, Adidas, Symrise AG
Worst Performers: Fresenius SE, Deutsche Boerse, Zalando SE
Resistance levels: 15634 15658 15736 (4H chart)
Support levels: 15246 15185 14906 (4H chart)
NASDAQ
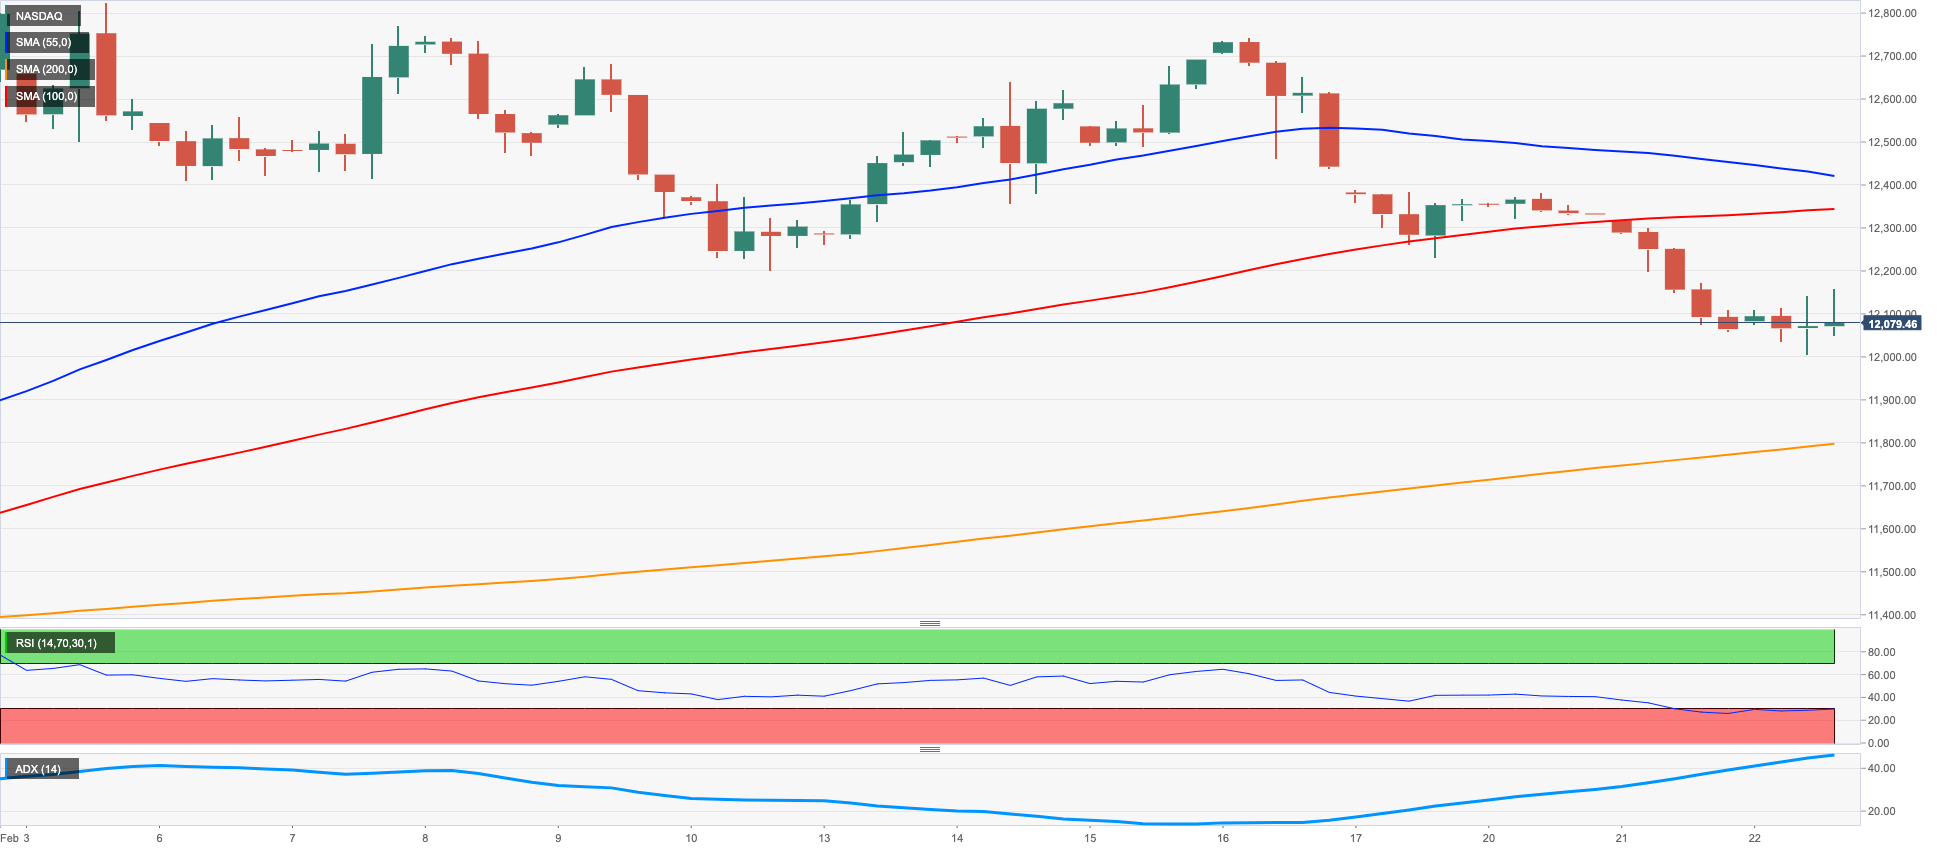
The benchmark tech index Nasdaq 100 managed to bounce off the earlier drop to the 12000 zone and picked up decent upside traction on Wednesday.
The recovery in the tech sector followed the corrective decline in US yields despite the dollar remaining on a strong foot in the wake of the release of the FOMC Minutes of the February gathering.
The Nasdaq 100 still appears under pressure despite Wednesday’s rebound. That said, the breakdown of the February low at 12006 (February 22) could put a test of the key 200-day SMA at 11908 back on the investors’ radar prior to weekly lows at 11550 (January 25) and 11251 (January 19). Down from here comes the January low at 10696 (January 6) followed by the December 2022 low at 10671 (December 22), all ahead of the November 2022 low at 10632 (November 4). In the opposite direction, there are no up barriers of note before the 2023 top at 12880 (February 2) prior to the round level at 13000 and the weekly peak at 13175 (August 26 2022). The daily RSI bounced to the boundaries of the 50 region.
Top Gainers: Palo Alto Networks, Crowdstrike Holdings Inc, Warner Bros Discovery Inc
Top Losers: Constellation Energy, O’Reilly Automotive, DexCom
Resistance levels: 12689 12771 12880 (4H chart)
Support levels: 12006 11906 11550 (4H chart)
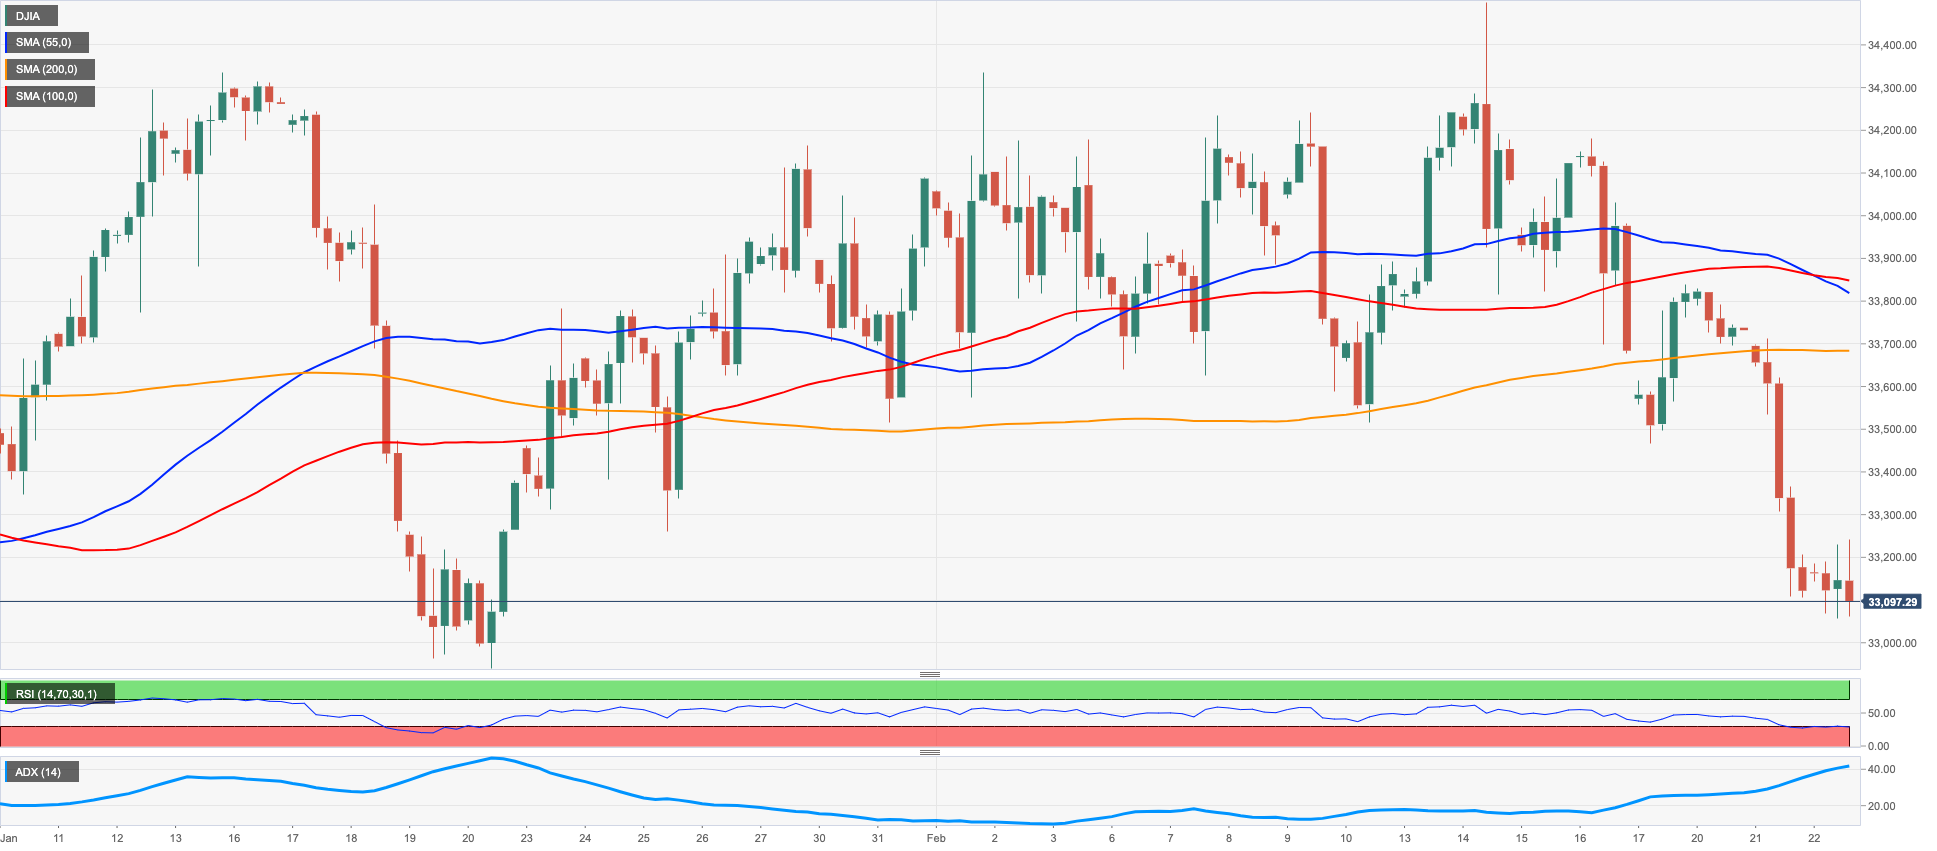
DOW JONES
US stocks measured by the Dow Jones reversed the initial pessimism and returned to Tuesday’s closing levels near the 33100 region on Wednesday.
Indeed, investors perceived the release of the FOMC Minutes as broadly in line with previous estimates, leaving no room for surprises in either direction. The spectre of a Fed’s tighter-for-longer stance, however, kept hovering around investors and kept fresh buying interest at bay.
All in all, the Dow Jones gained 0.01% to 33128, the S&P500 advanced 0.06% to 3999 and the tech-reference Nasdaq Composite rose 0.43% to 11541.
Extra weakness could prompt the Dow Jones to dispute the weekly low at 32948 (January 20), which is closely followed by the 100-day SMA at 32859. Further losses could see the December 2022 low at 32573 (December 22) revisited ahead of the key 200-day SMA at 32343. By contrast, there are no changes to the topside, where the 2023 top at 34342 (January 13) appears as the big magnet for bulls prior to the December 2022 peak at 34712 (December 13) and the April 2022 high at 35492 (April 21). Up from here comes the February 2022 top at 35824 (February 9). The daily RSI gathered marginal upside traction and surpassed the 40 mark.
Top Performers: Salesforce Inc, American Express, Home Depot
Worst Performers: Walmart, Intel, IBM
Resistance levels: 34334 34712 35492 (4H chart)
Support levels: 33064 32948 32767 (4H chart)
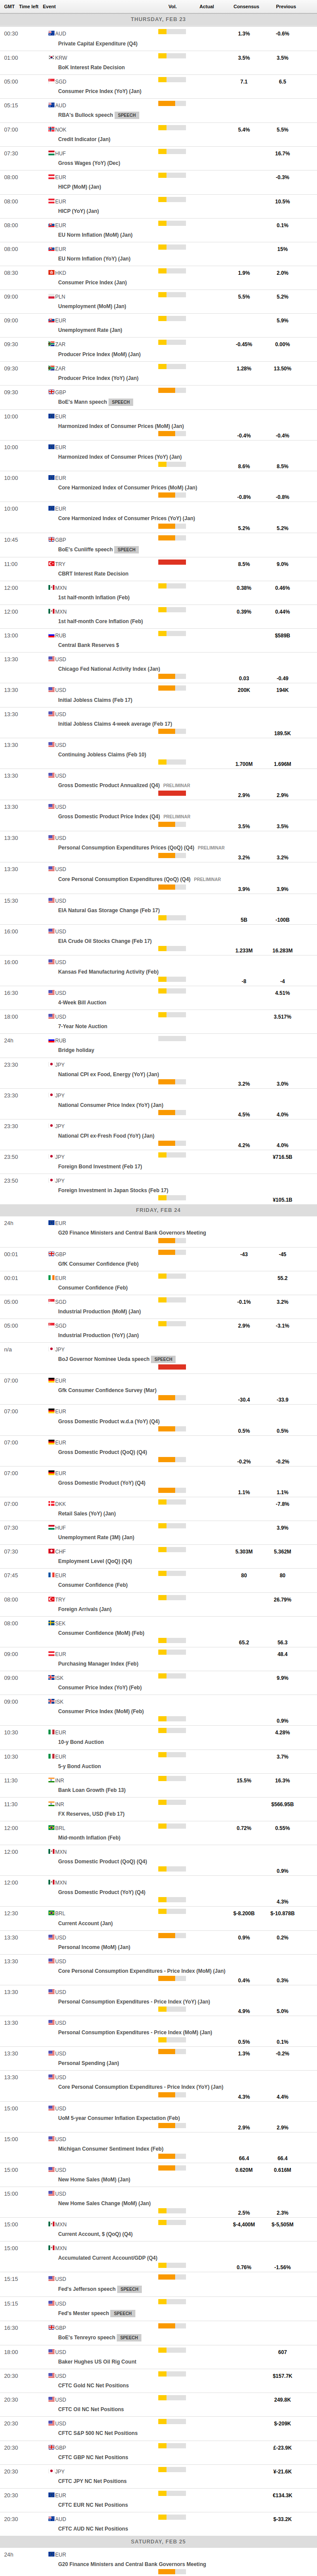
MACROECONOMIC EVENTS
All Information & Updates provided by:

All information relating to the financial markets available on this page has been prepared and issued by FXStreet (Forexstreet SL, Spain, Reg: B62498233) on the basis of publicly available information and all information believed to be reliable and does not conflict with Kuwaiti local laws, and all necessary care has been taken to before the company to ensure that the facts mentioned are correct from the source.
NCM Investment nor any of its directors or employees shall in any way be held responsible for the contents of this news, and the information contained on this page is intended only to provide clients with publicly available information and should not be construed as investment advice, report or analysis and/or constitute an offer or invitation to buy or sell financial instruments of any kind.
RISK WARNING: Forex and CFDs are highly risky leveraged products, as losses can exceed deposits. Please ensure you understand all the risks and take independent advice if necessary. NCM will segregate the clients based on the criteria of the regulator and its bylaws. NCM does not provide any advisory service; the material published does not constitute advice or a recommendation for a transaction in any financial instrument. NCM accepts no responsibility for any use of the content presented and any consequences of that use. Anyone acting on the information provided does so at their own risk.