
- Contact Us:
-

-

-

-


Daily Market Updates
24 Feb 2023
USDJPY
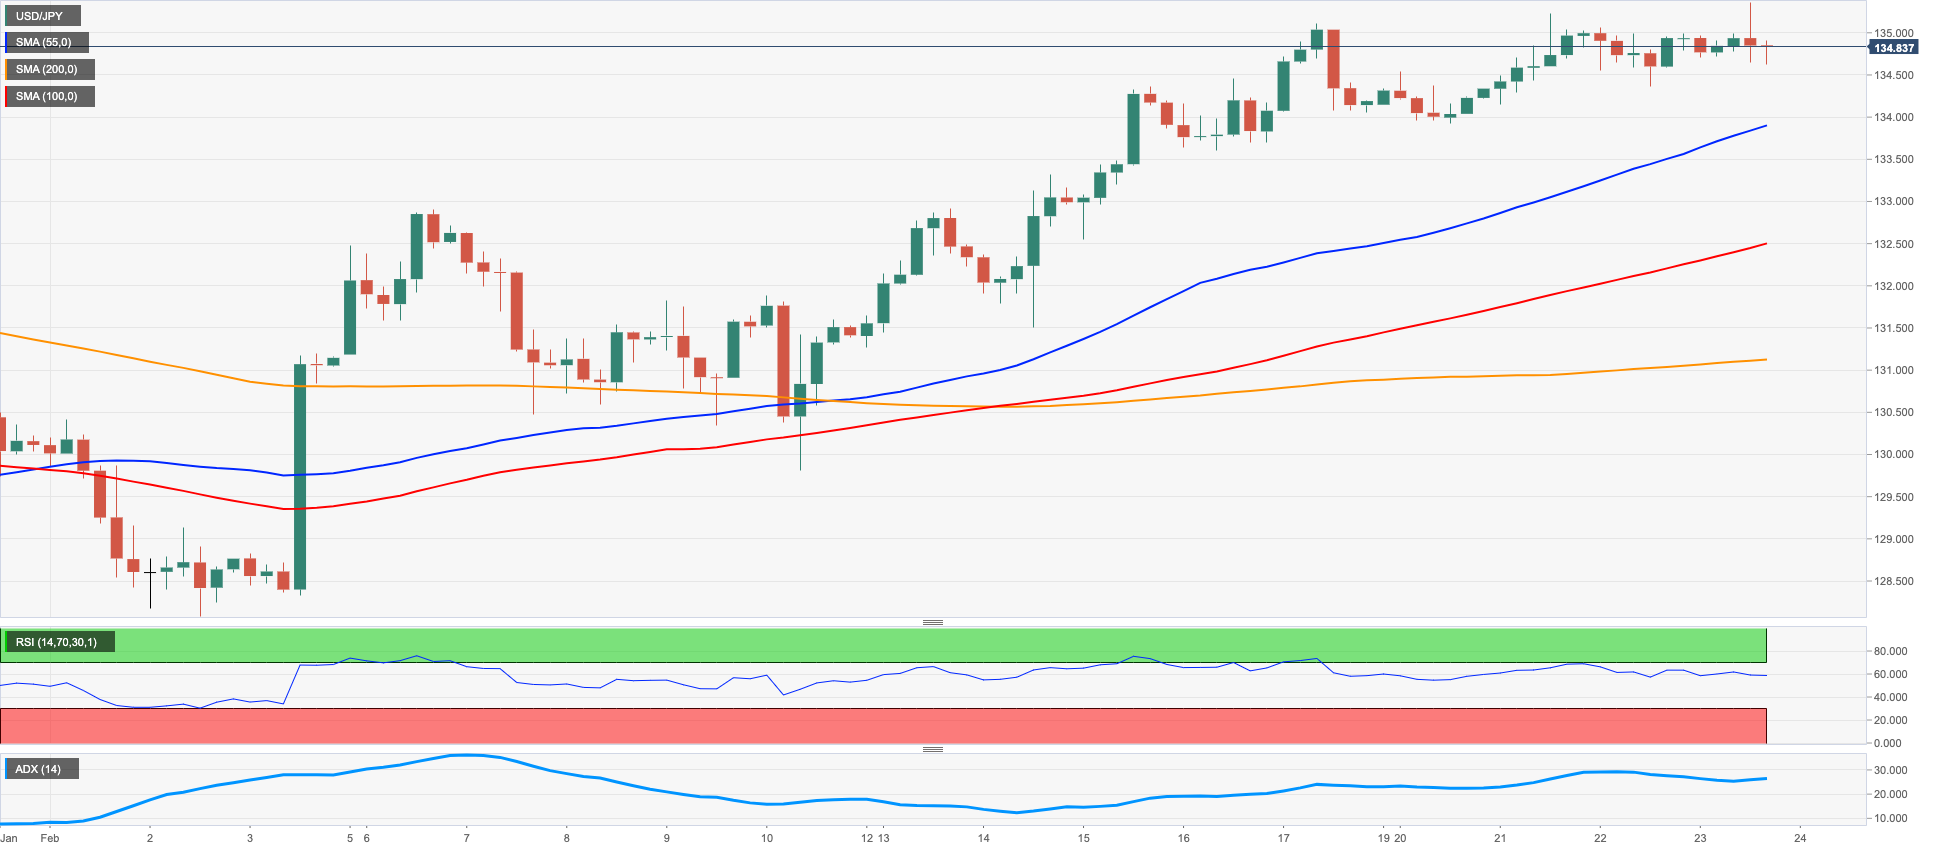
USD/JPY saw another session of vacillating price action on Thursday, this time in the area just below the 135.00 mark.
The strong performance of the greenback in combination with the lack of volatility in US yields across the curve also collaborated with the flattish mood around the pair on Thursday.
Further consolidation, in the meantime, remained well in place in the JGB 10-year yields around the upper end of the YCC band near 0.50%.
There were no data releases in the Japanese docket on Thursday, leaving all the attention to Friday’s publication of inflation figures for the month of January.
The 2023 peak at 135.22 (February 21) remains the immediate target for USD/JPY ahead of the key 200-day SMA at 137.02, which precedes the temporary 100-day SMA at 137.24. North from here turns up weekly tops at 138.17 (December 15 2022) and 139.89 (November 30 2022) prior to the key round level at 140.00. The other way around, the interim 55-day SMA at 132.20 should offer provisional support ahead of the weekly low at 129.79 (February 10) and the February low at 128.08 (February 2). The breach of the latter could pave the way for a move to the 2023 low at 127.21 (January 16) ahead of the May 2022 low at 126.36 (May 24) and the weekly low at 121.27 (March 31 2022). The daily RSI receded marginally to the proximity of the 63 area.
Resistance levels: 135.22 137.47 138.17 (4H chart)
Support levels: 134.36 133.91 133.60 (4H chart)
GBPUSD
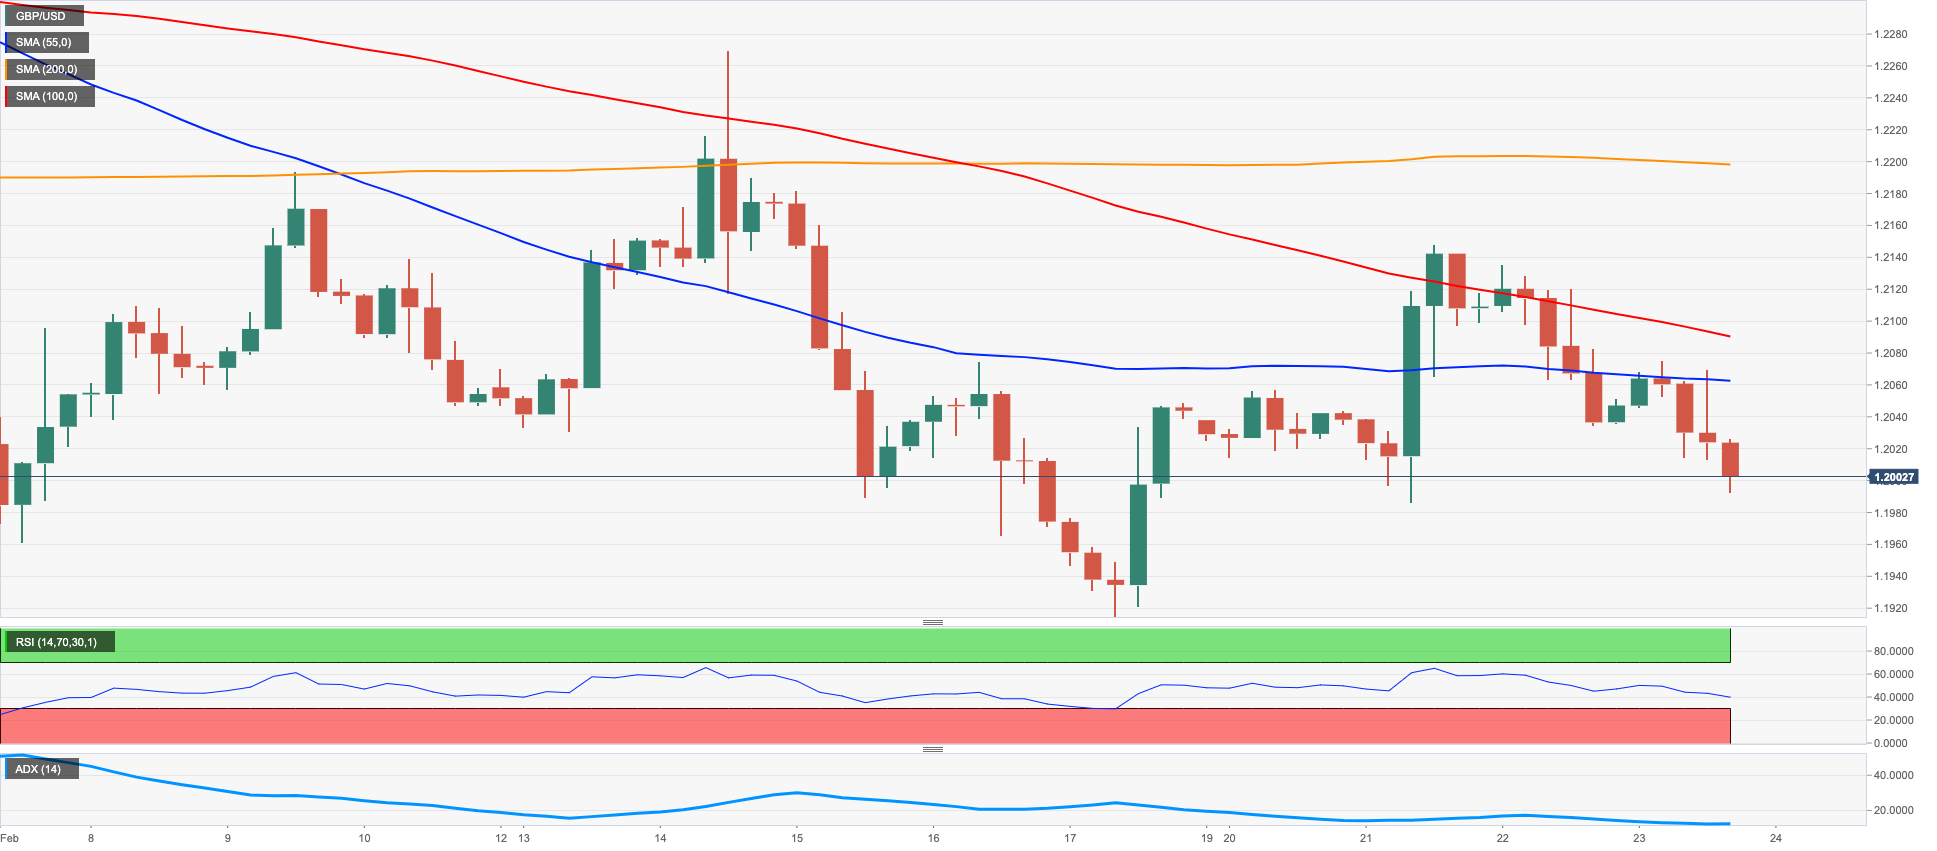
GBP/USD charted a moderate pullback and retreated south of the key 1.2000 barrier on the back of the marked improvement in the greenback on Thursday.
Indeed, the dollar extended the February recovery after the USD Index (DXY) surpassed the steady resistance near 104.50 and US yields traded in a mixed bias amidst the broader strong uptrend in place since the beginning of the month.
From the BoE, MPC member C.Mann (hawk) advocated for the continuation of the tightening process at the next meetings and discarded any chances of a pivot in the bank’s monetary stance for the time being. She also warned against the risks of not tightening enough, as this would mean staying in the restrictive territory for longer. Mann also suggested that persistent inflation could extend this year and into the next one.
In the UK bond market, the 10-year Gilt yields prolonged the consolidative theme in the upper end of the monthly range near 3.60%.
In the UK, the CBI Distributive Trades climbed to 2 in February (from -23) in what was the only scheduled release on Thursday.
GBP/USD appears side-lined so far and continues to face a provisional hurdle at the 55-day SMA at 1.2164 prior to the weekly peak at 1.2269 (February 14) and the 2023 high at 1.2447 (January 23). The surpass of this level could open the door to the May 2022 top at 1.2666 (May 27) ahead of the 200-week SMA at 1.2887 and the psychological 1.3000 yardstick. Having said that, there is an immediate support at the 200-day SMA at 1.1930 just ahead of the February low at 1.1914 (February 17). Down from here emerges the 2023 low at 1.1841 (January 6) followed by the November 2022 low at 1.1142 (November 4). The daily RSI dropped further and revisited the 42 region.
Resistance levels: 1.2147 1.2198 1.2269 (4H chart)
Support levels: 1.1985 1.1914 1.1841 (4H chart)
AUDUSD
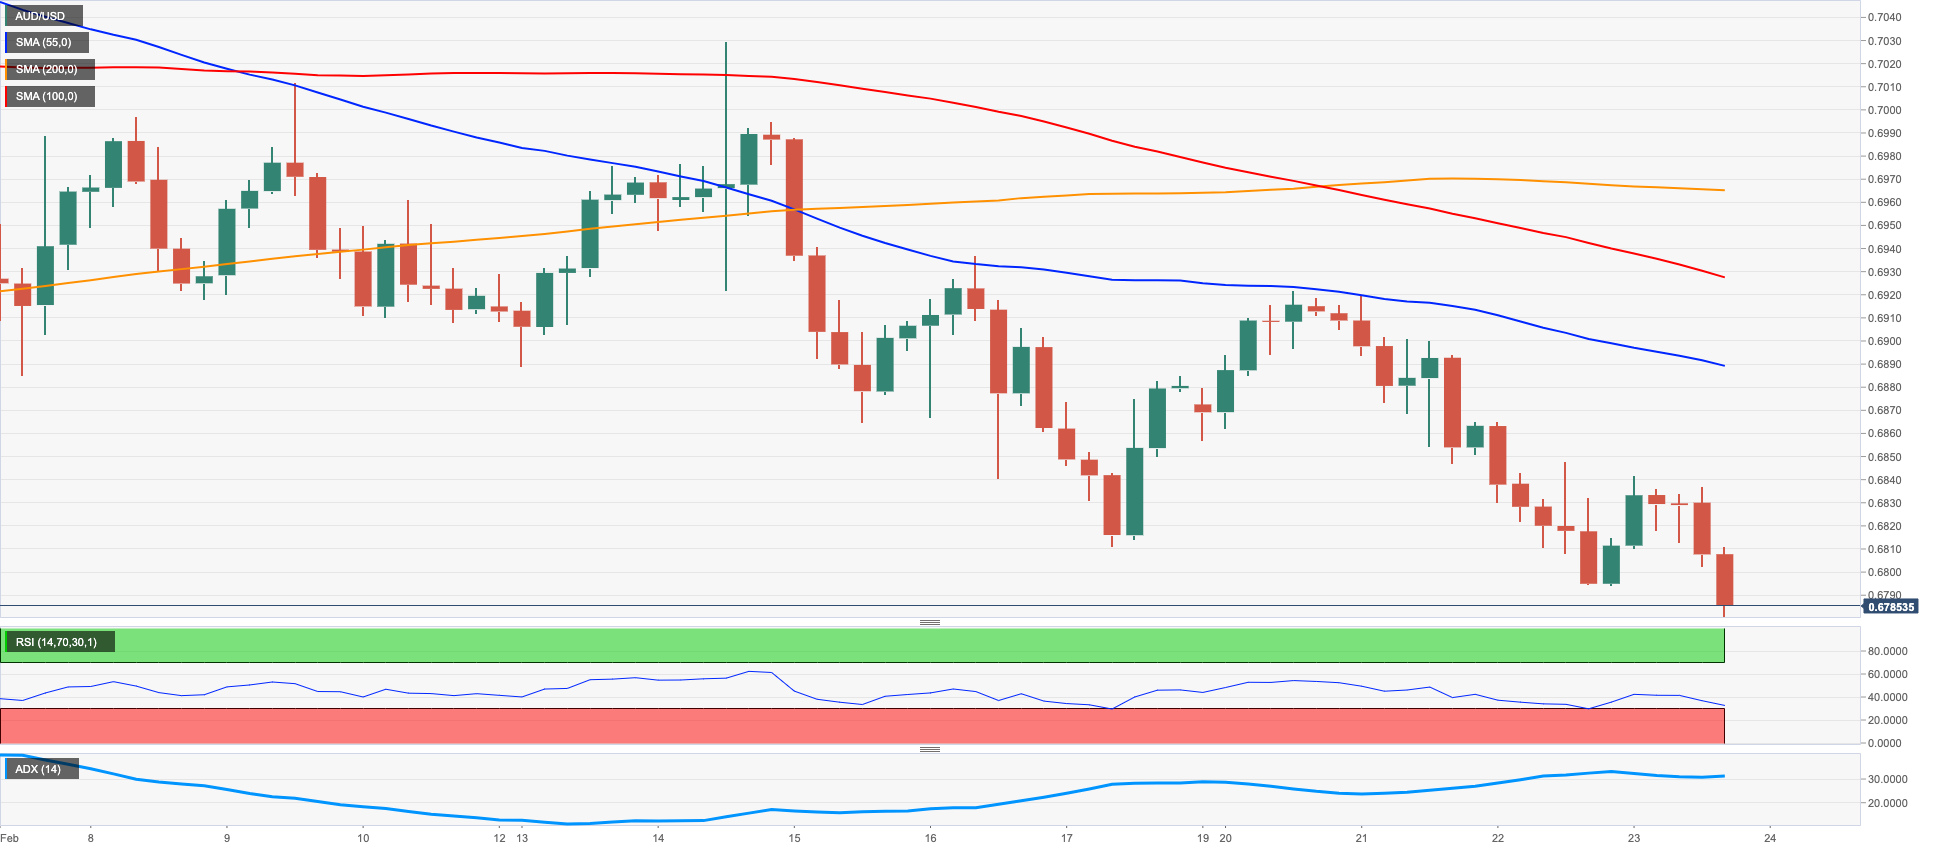
AUD/USD reversed the initial optimism and eventually succumbed to the better tone in the US dollar on Thursday, this time breaching the 0.6800 mark and leaving behind at the same time the key 200-day SMA.
In fact, the pair regained downside traction in response to another solid performance of the greenback and the broad-based downbeat mood surrounding the commodity universe, where copper prices and the iron ore added to recent losses.
In the Australian calendar, Building Capital Expenditure expanded 3.6% QoQ in Q4 and Private Capital Expenditure rose 2.2% vs. the previous quarter.
If AUD/USD breaches the February low at 0.6781 (February 22) it could then put the 2023 low at 0.6688 (January 3) to the test prior to the December 2022 low at 0.6629 (December 20). On the opposite side, there is an interim hurdle at the 55-day SMA at 0.6881 ahead of the weekly peak at 0.7029 (February 14) and the 2023 high at 0.7157 (February 2). The surpass of this level exposes the round level at 0.7200 before the June 2022 top at 0.7282 (June 3). The daily RSI retreated to the sub-40 area.
Resistance levels: 0.6920 0.6964 0.7029 (4H chart)
Support levels: 0.6781 0.6722 0.6688 (4H chart)
GOLD
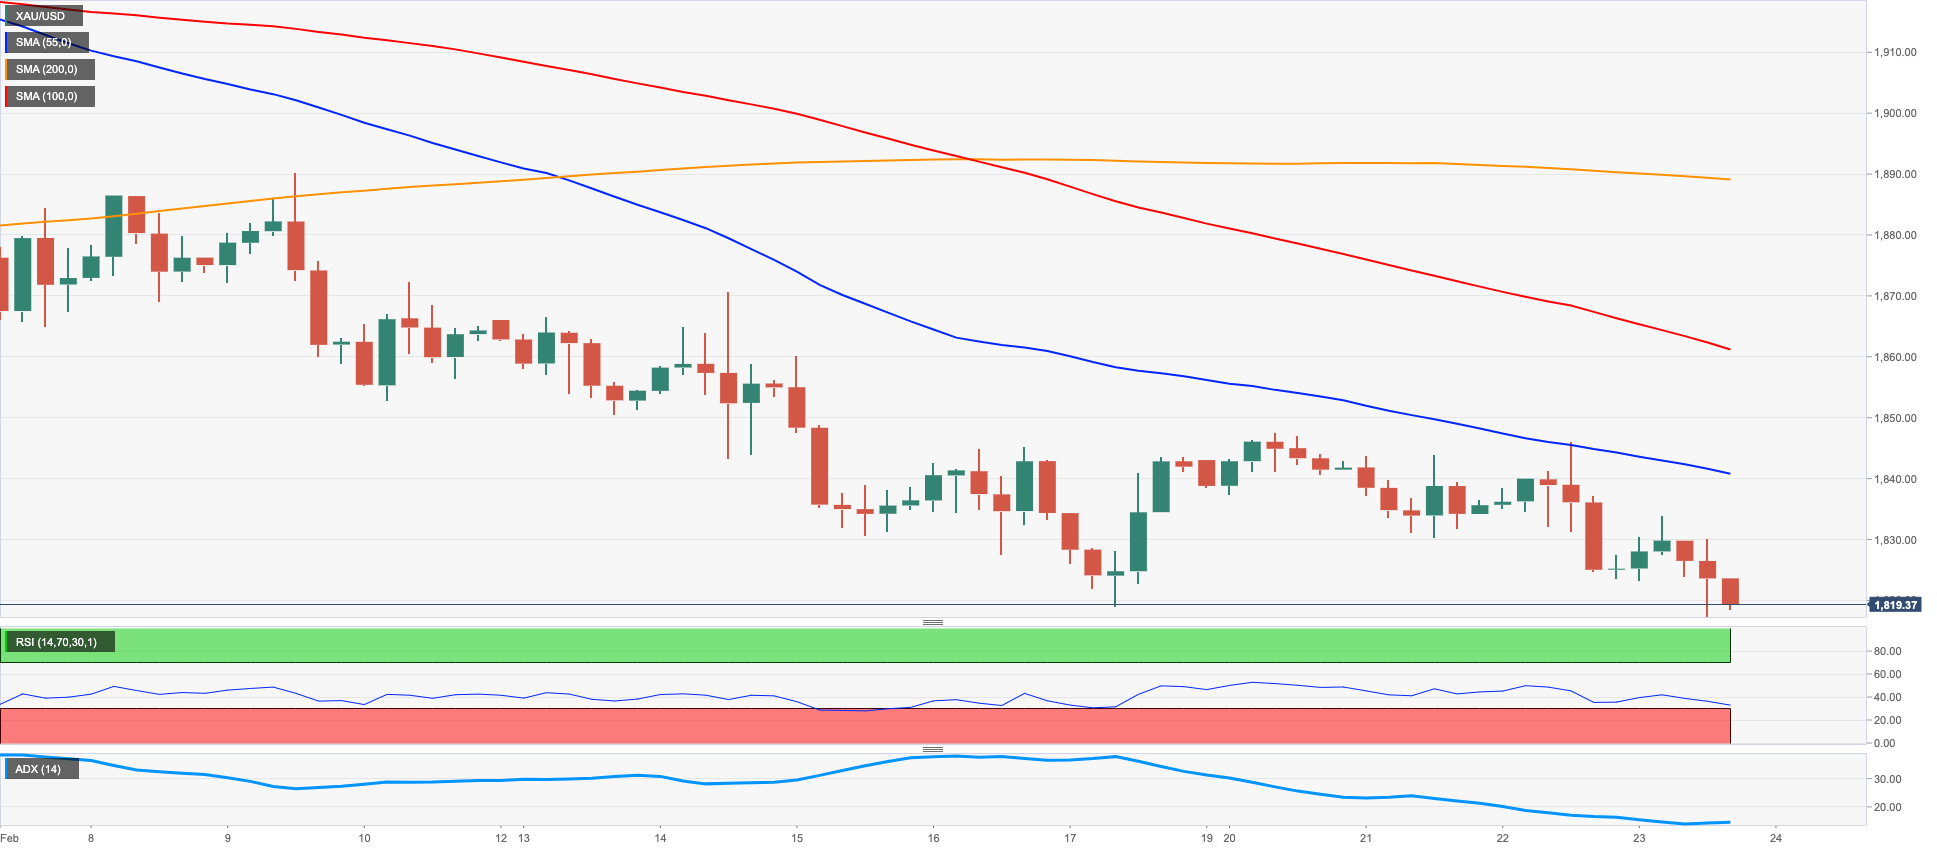
Prices of the ounce troy of gold retreated for the third session in a row and poked once again with the 2023 lows in the sub-$1820 area per ounce troy on Thursday.
The yellow metal extended the downward bias on the back of the relentless move north in the greenback, while the mixed developments in US yields across the curve added to the decline in the metal.
Moving forward, bullion could face some bouts of volatility in the next hours in light of the release of the US inflation figures gauged by the PCE on Friday, the Fed’s preferred measure. In addition, scheduled Fedspeak is also expected to maintain the hawkish tone, which could in turn put the precious metal under some extra pressure.
Immediately to the downside in gold appears the 2023 low at $1817 (February 22) seconded by the key $1800 zone. Down from here emerges the temporary 100-day SMA at $1789 followed by the key 200-day SMA at $1776 and the weekly low at $1727 (November 23). For all that, there is an interim up barrier at the 55-day SMA at $1857 before the weekly high at $1890 (February 9) and the 2023 peak at $1959 (February 2). Once the latter is cleared, a probable test of the April 2022 high at $1998 (April 18) could start shaping up prior to the psychological $2000 mark and the 2022 top at $2070 (March 8).
Resistance levels: $1847 $1870 $1889 (4H chart)
Support levels: $1817 $1797 $1784 (4H chart)
CRUDE WTI
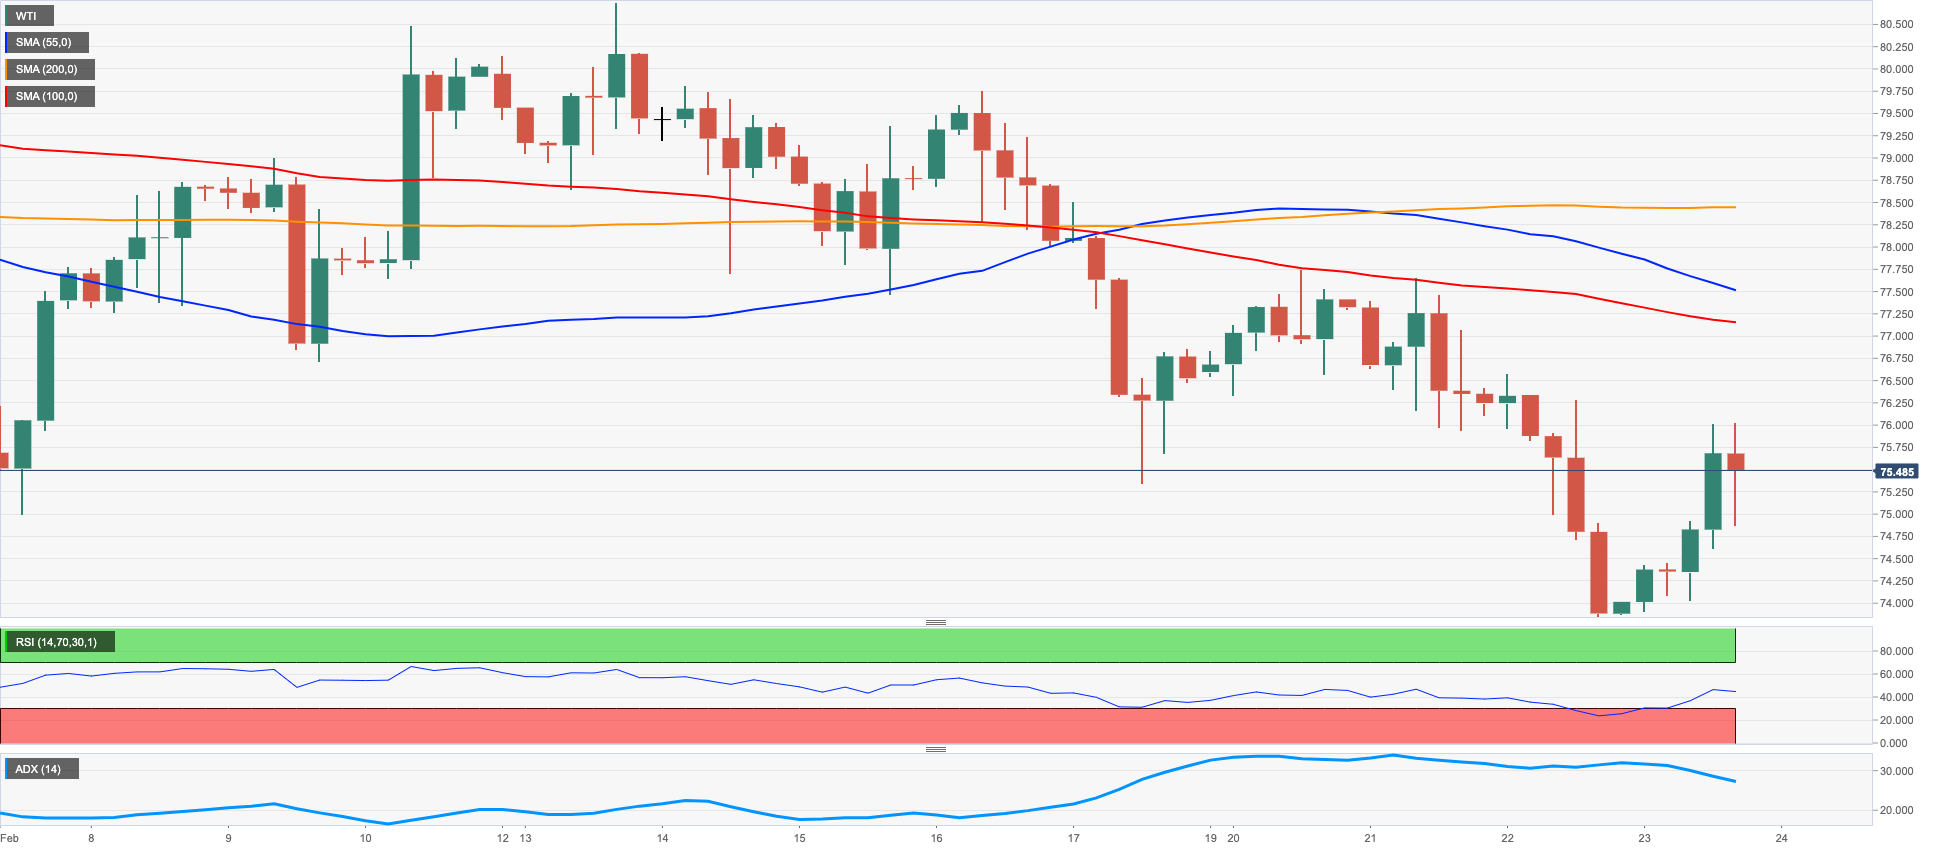
Prices of the WTI rebounded markedly from 2-week lows in the sub-$74.00 area on the back of recent news that Russia will reduce exports of crude oil from its western ports by around 25%, surpassing the previous plans to trim exports by 500 kbpd.
The commodity, in the meantime, managed well to weather another positive session in the greenback, as market participants remained cautious ahead of the release of the US inflation figures measured by the PCE on Friday.
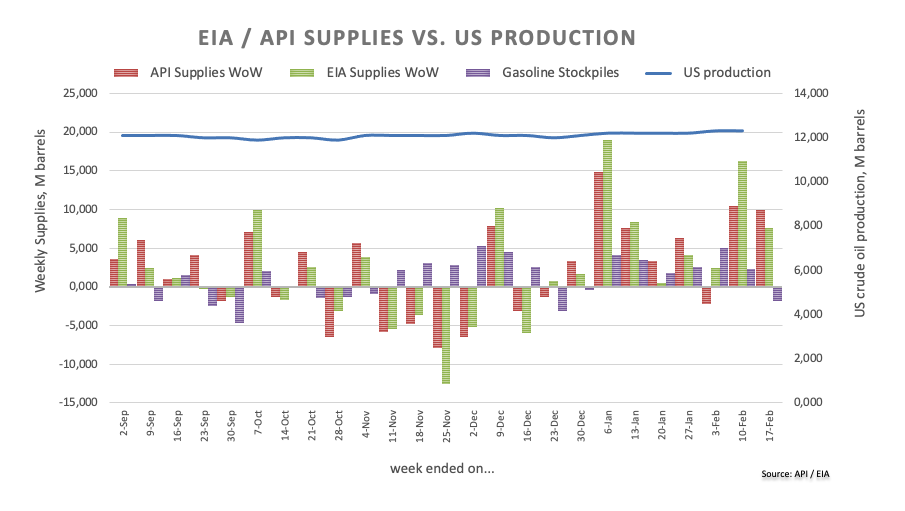
The upside potential in WTI, however, was clouded by the EIA report after US crude oil inventories increased by 7.648M barrels in the week to February 17, while supplies at Cushing rose by 0.700M barrels, Distillate Stocks went up by 2.698M barrels and gasoline stockpiles dropped by 1.856M barrels.
If WTI breaks below the weekly low at $73.83 (February 22), then it could pave the way for a move to the 2023 low at $72.30 (February 6) ahead of the 2022 low at $70.10 (December 9) and the key round level at $70.00. A deeper drop could retest the weekly low at $66.15 (December 20 2021). On the other hand, the 55-day SMA at $77.24 emerges as the initial temporary obstacle for bulls’ intentions prior to the February high at $80.57 (February 13) and the interim 100-day SMA at $80.68. Beyond this level emerges the 2023 top at $82.60 (January 23) before the December 2022 peak at $83.32 (December 1) and the $90.08 level (November 11 2022).
Resistance levels: $77.69 $78.16 $79.50 (4H chart)
Support levels: $73.77 $72.22 $70.07 (4H chart)
GER40
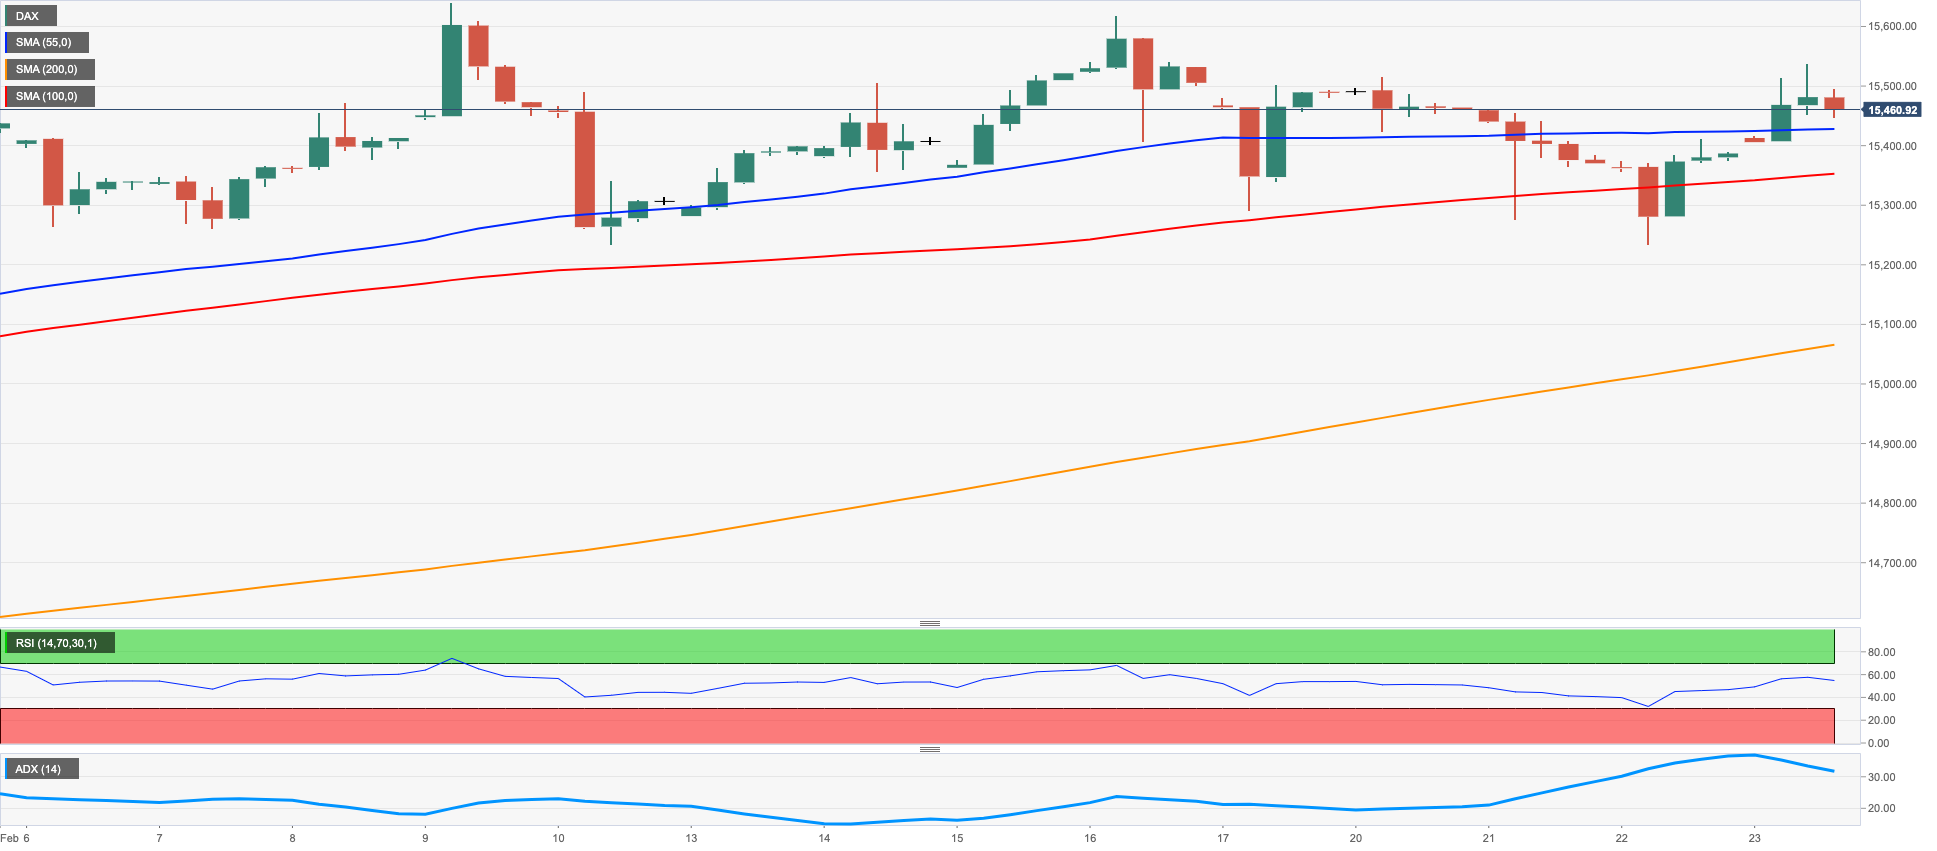
The German benchmark index DAX40 added to Wednesday’s gains and rose to 3-day highs past the 15500 mark on Thursday.
In fact, German equities kept the broad monthly range bounce theme well in place amidst flat risk appetite trends and swelling prudence ahead of the release of the US PCE/Core PCE on Friday.
No data releases in the German docket on Thursday left all the attention to Friday’s publication of the final Q4 GDP Growth Rate and the Consumer Confidence gauge tracked by GfK.
In the bonds market, the 10-year Bund yields maintained the monthly gradual uptrend and advanced modestly past the 2.55% level.
Next on the upside for the DAX40 comes the 2023 peak at 15658 (February 9) just before the February 2022 high at 15736 (February 2 2022). The breakout of this level could see the round level at 16000 revisited prior to the 2022 top at 16285 (January 5). By contrast, initial contention aligns at the weekly low at 15246 (February 10) seconded by another weekly low at 14906 (January 19). Once the latter is cleared, the index could then challenge the temporary 55-day SMA at 14824 ahead of the December 2022 low at 13791 (December 20) and the key 200-day SMA at 13755. The daily RSI improved past the 61 hurdle.
Best Performers: Siemens Energy AG, Infineon, Zalando SE
Worst Performers: Fresenius SE, Fresenius Medical Care KGAA ST, Munich Re Group
Resistance levels: 15527 15634 15658 (4H chart)
Support levels: 15247 15185 14906 (4H chart)
NASDAQ
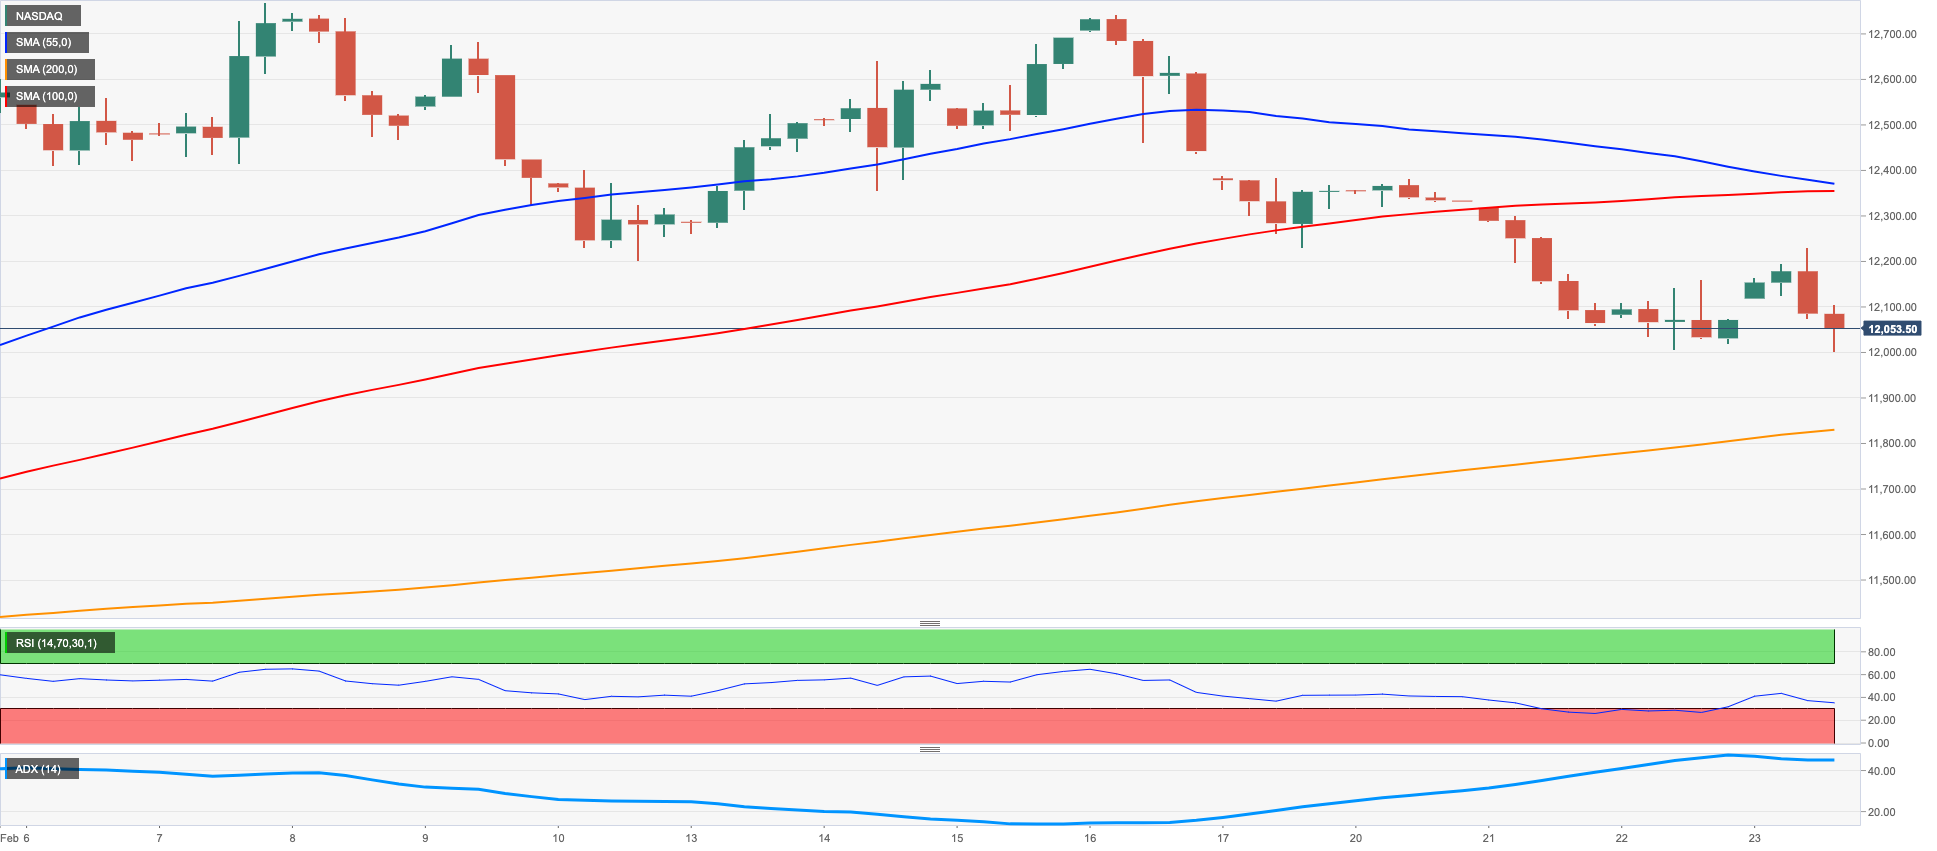
US tech equities measured by the Nasdaq 100 flirted once again with the key support around 12000 on Thursday, amidst the broad-based bearish note in the US markets.
The stronger dollar and the renewed risk-off note coupled with the mixed performance of US yields all collaborated with the resumption of the downside pressure in the tech sector on Thursday.
Considering the ongoing price action, further decline should not be ruled out in the Nasdaq 100. Against that, the next support of note emerges at the key 200-day SMA at 11908 ahead of weekly lows at 11550 (January 25) and 11251 (January 19). Once the latter is cleared, the index could refocus on the January low at 10696 (January 6) prior to the December 2022 low at 10671 (December 22) and the November 2022 low at 10632 (November 4). On the flip side, the resumption of the bullish bias is expected to meet the next hurdle at the 2023 peak at 12880 (February 2) before the round level at 13000 and followed by the weekly high at 13175 (August 26 2022). The daily RSI advanced marginally north of the 48 yardstick.
Top Gainers: NVIDIA, ANSYS, PDD Holdings DRC
Top Losers: Lucid Group, Moderna, eBay
Resistance levels: 12689 12771 12880 (4H chart)
Support levels: 12003 11906 11550 (4H chart)
DOW JONES
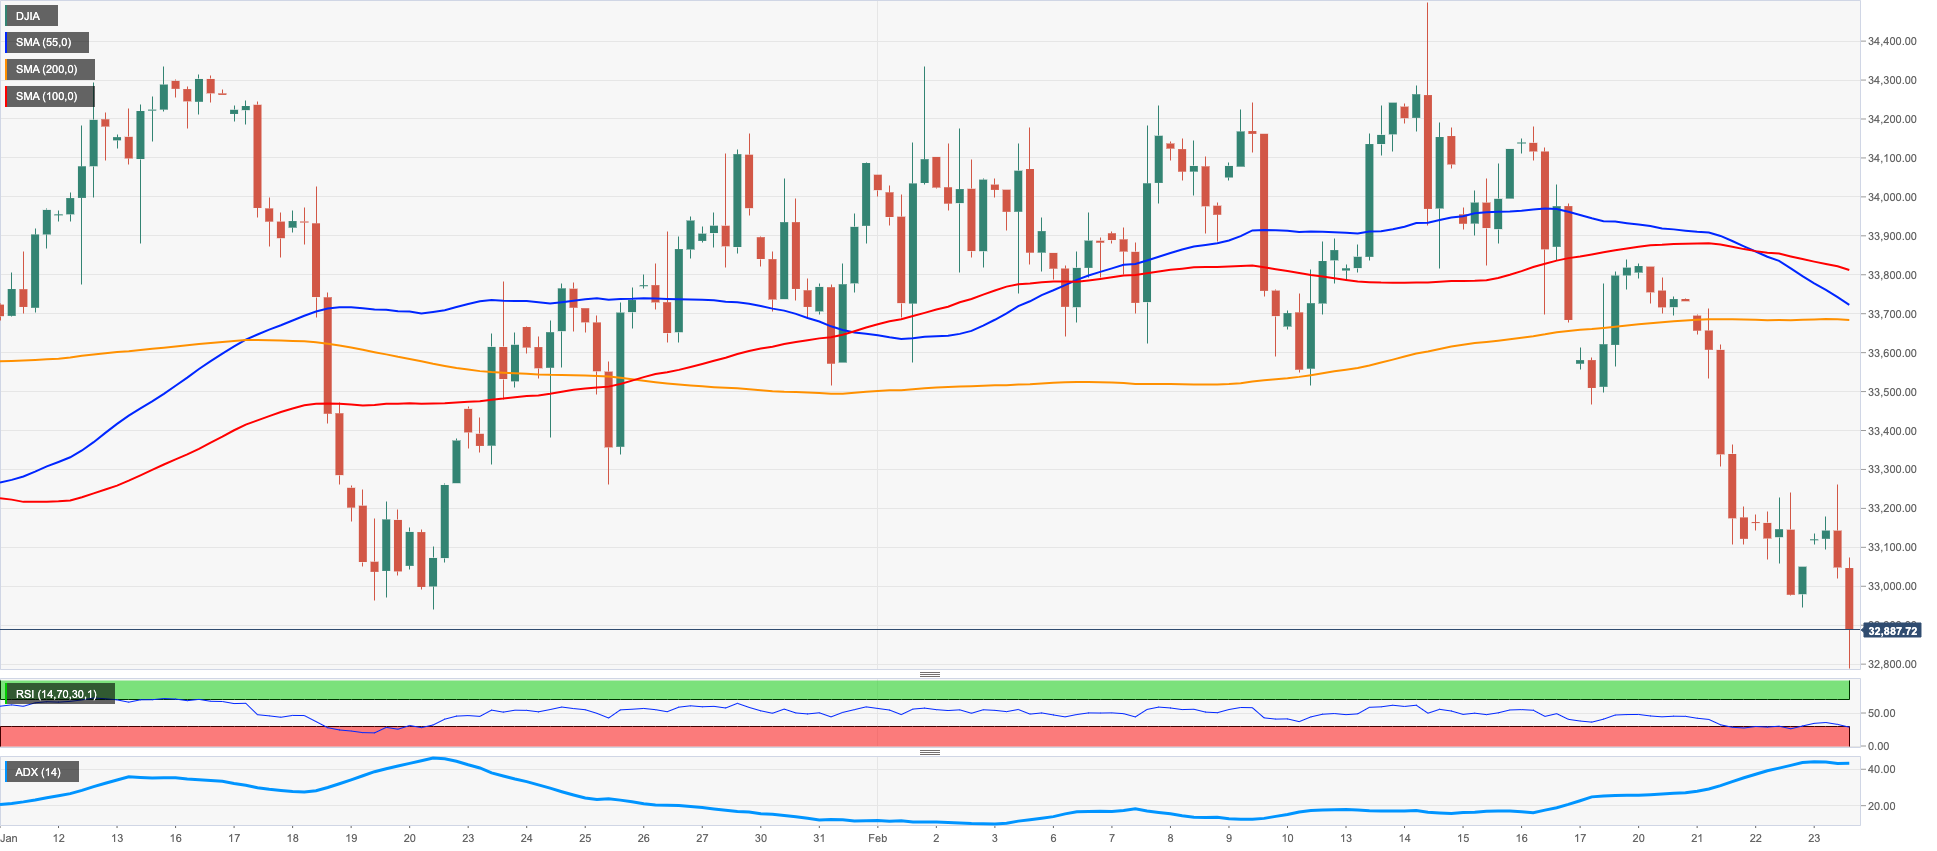
US equities navigated a “sea of red” on Thursday as all three major stock indices added to the weekly leg lower and the Dow Jones hitting new lows for the year so far.
Once again, concerns around further tightening by the Fed for longer than anticipated – reinforced by persevering hawkish Fedspeak and strong fundamentals - spooked buyers and left stocks vulnerable to further weakness.
Overall, the Dow Jones dropped 0.53% to 32870, the S&P500 deflated 0.30% to 3979 and the tech-heavy Nasdaq Composite retreated 0.30% to 11472.
The continuation of the current bearish note could force the Dow Jones to test the p December 2022 low at 32573 (December 22) ahead of the key 200-day SMA at 32342. In the opposite direction, the interim 55-day SMA at 33601 should emerge as an initial up barrier followed by the 2023 peak at 34342 (January 13) and the December 2022 high at 34712 (December 13). Further north appears the April 2022 top at 35492 (April 21) before the February 2022 peak at 35824 (February 9). The daily RSI grinded lower to the vicinity of the 36 region.
Top Performers: Chevron, Merck&Co, Boeing
Worst Performers: Walmart, Walt Disney, Verizon
Resistance levels: 33593 33794 34334 (4H chart)
Support levels: 32795 32573 31727 (4H chart)
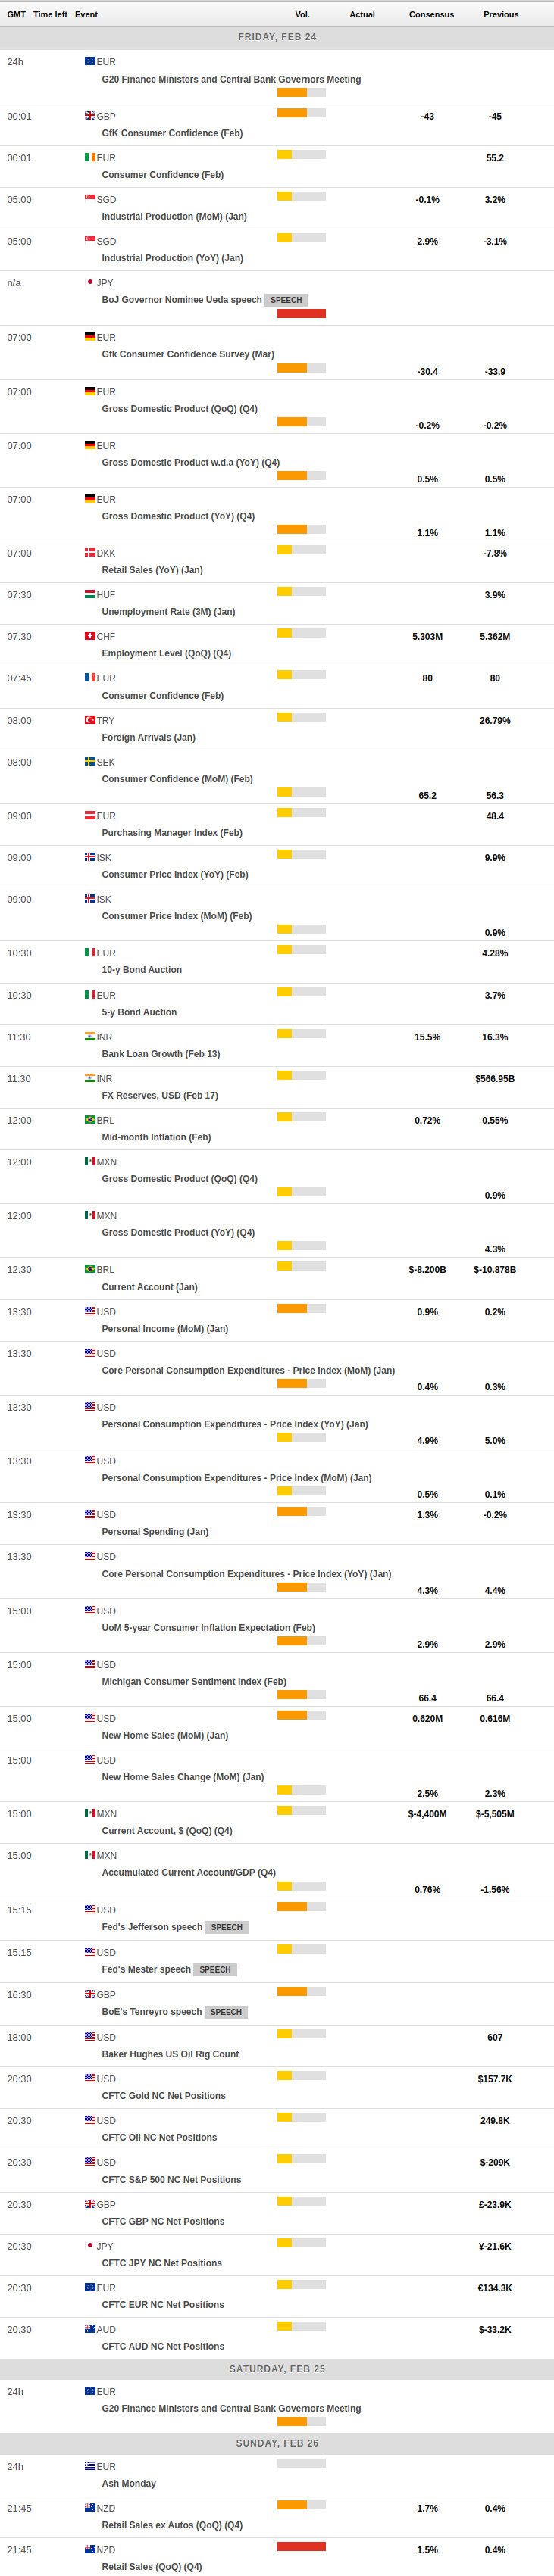
MACROECONOMIC EVENTS
All Information & Updates provided by:

All information relating to the financial markets available on this page has been prepared and issued by FXStreet (Forexstreet SL, Spain, Reg: B62498233) on the basis of publicly available information and all information believed to be reliable and does not conflict with Kuwaiti local laws, and all necessary care has been taken to before the company to ensure that the facts mentioned are correct from the source.
NCM Investment nor any of its directors or employees shall in any way be held responsible for the contents of this news, and the information contained on this page is intended only to provide clients with publicly available information and should not be construed as investment advice, report or analysis and/or constitute an offer or invitation to buy or sell financial instruments of any kind.
RISK WARNING: Forex and CFDs are highly risky leveraged products, as losses can exceed deposits. Please ensure you understand all the risks and take independent advice if necessary. NCM will segregate the clients based on the criteria of the regulator and its bylaws. NCM does not provide any advisory service; the material published does not constitute advice or a recommendation for a transaction in any financial instrument. NCM accepts no responsibility for any use of the content presented and any consequences of that use. Anyone acting on the information provided does so at their own risk.