
- Contact Us:
-

-

-

-


Daily Market Updates
27 Feb 2023
USDJPY
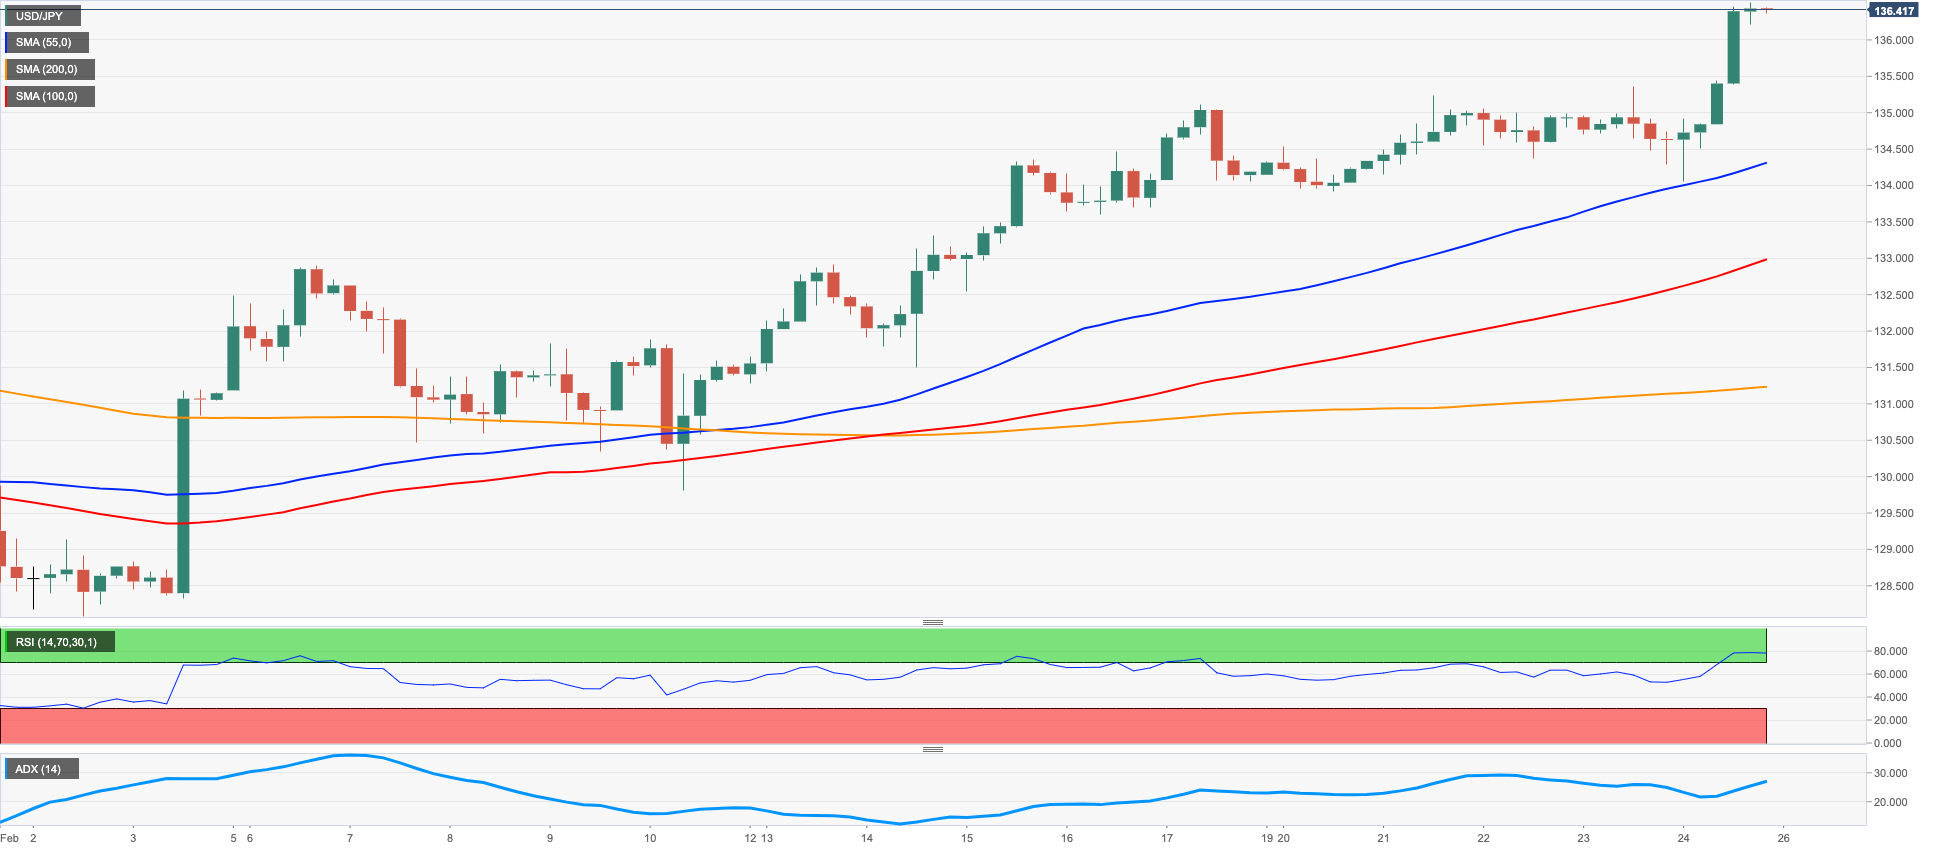
USD/JPY leapt to fresh 2-month highs north of the 136.00 mark on Friday, leaving behind two consecutive daily declines and returning to an area last seen in mid-December.
The firmer tone in the greenback in combination with the so far unabated monthly rally in US yields across the curve propped up the strong advance of more than 1% in the pair at the end of the week.
In Japan, the JGB 10-year yields prolonged the range bound theme around the 0.50% level, the upper end of the YCC band.
In the Japanese calendar, the Inflation Rate climbed to 4.3% YoY in January (from 4.0%), while the Core Inflation Rate rose to 4.2% YoY (also from 4.0%) and the Inflation Rate Ex-Food and Energy gained 3.2% over the last twelve months (from 3.0%). Finally, Foreign Bond Investment rose to ¥2693.3B in the week to February 18.
USD/JPY clocked a new 2023 high at 136.51 (February 24). The surpass of this level could put a potential test of the key 200-day SMA at 137.06 back on the investors’ radar just before the interim 100-day SMA at 137.15. The continuation of the uptrend should then face weekly tops at 138.17 (December 15 2022) and 139.89 (November 30 2022) prior to the key round level at 140.00. Having said that, there is a temporary support at the 55-day SMA at 132.20 seconded by the weekly low at 129.79 (February 10) and the February low at 128.08 (February 2). A drop below this level exposes the 2023 low at 127.21 (January 16) ahead of the May 2022 low at 126.36 (May 24) and the weekly low at 121.27 (March 31 2022). The daily RSI trespassed the 69 level and approached the overbought territory.
Resistance levels: 136.51 137.47 138.17 (4H chart)
Support levels: 134.05 132.82 131.49 (4H chart)
GBPUSD
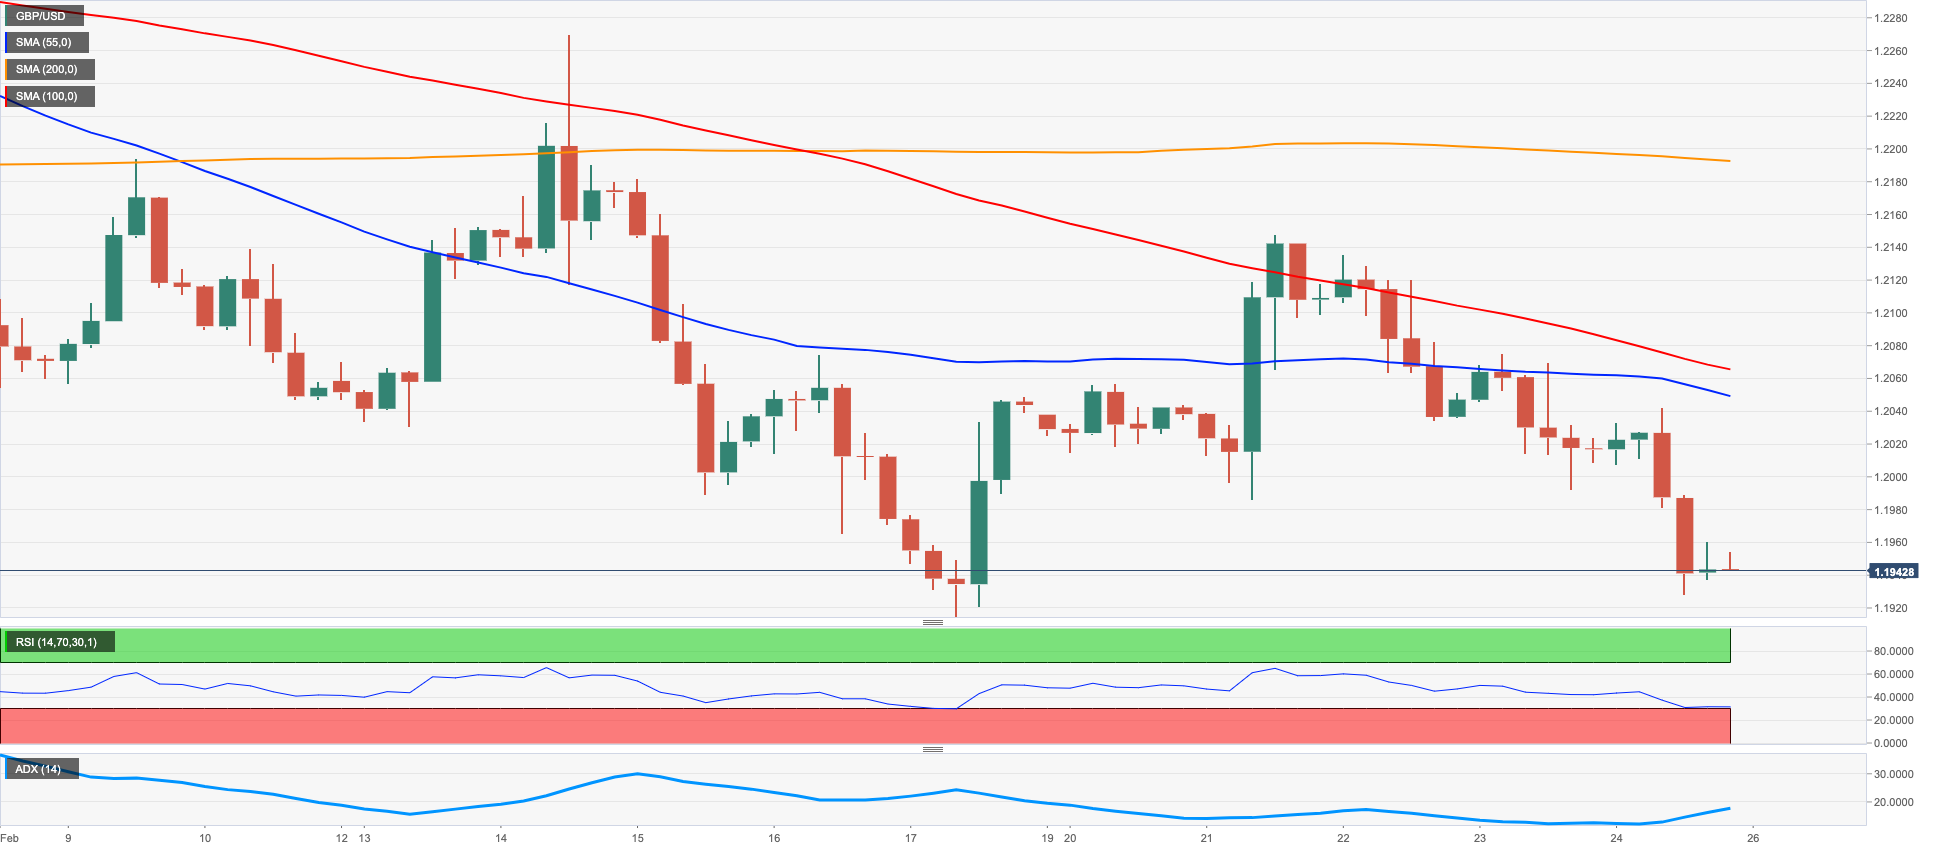
The intense advance in the greenback kept the price action among the risk-related assets well depressed for yet another session on Friday, and this time forced GBP/USD to flirt with the monthly lows near 1.1930.
Indeed, Cable dropped for the third session in a row and poked once again with the key 200-day SMA well south of the key 1.2000 the figure amidst rising buying interest in the greenback and the move to multi-week tops in the USD Index (DXY).
In the UK debt market, the 10-year Gilt yields followed the rest of their G10 peers and rose to levels last seen back in late October 2022 past 3.75%.
Data wise in the UK, Consumer Confidence tracked by Gfk ticked higher to -38 in February, while Car Production contracted 0.3% in the year to January.
From the BoE, MPC member S.Tenreyro warned against risks of overtightening rates, at the time when she suggested that inflation is expected to fall and the financial situation has deteriorated.
Considering the recent price action, the door appears open for GBP/USD to dispute the February low at 1.1914 (February 17) prior to the 2023 low at 1.1841 (January 6) and the November 2022 low at 1.1142 (November 4). In the opposite direction, the weekly peak at 1.2147 (February 21) appears underpinned by the provisional 55-day SMA at 1.1257 and is followed by the weekly high at 1.2269 (February 14). North from here emerges the 2023 top at 1.2447 (January 23) seconded by the May 2022 peak at 1.2666 (May 27). Further up comes the 200-week SMA at 1.2886, which precedes the psychological 1.3000 mark. The daily RSI deflated below the 40 yardstick.
Resistance levels: 1.2053 1.2147 1.2190 (4H chart)
Support levels: 1.1927 1.1914 1.1841 (4H chart)
AUDUSD
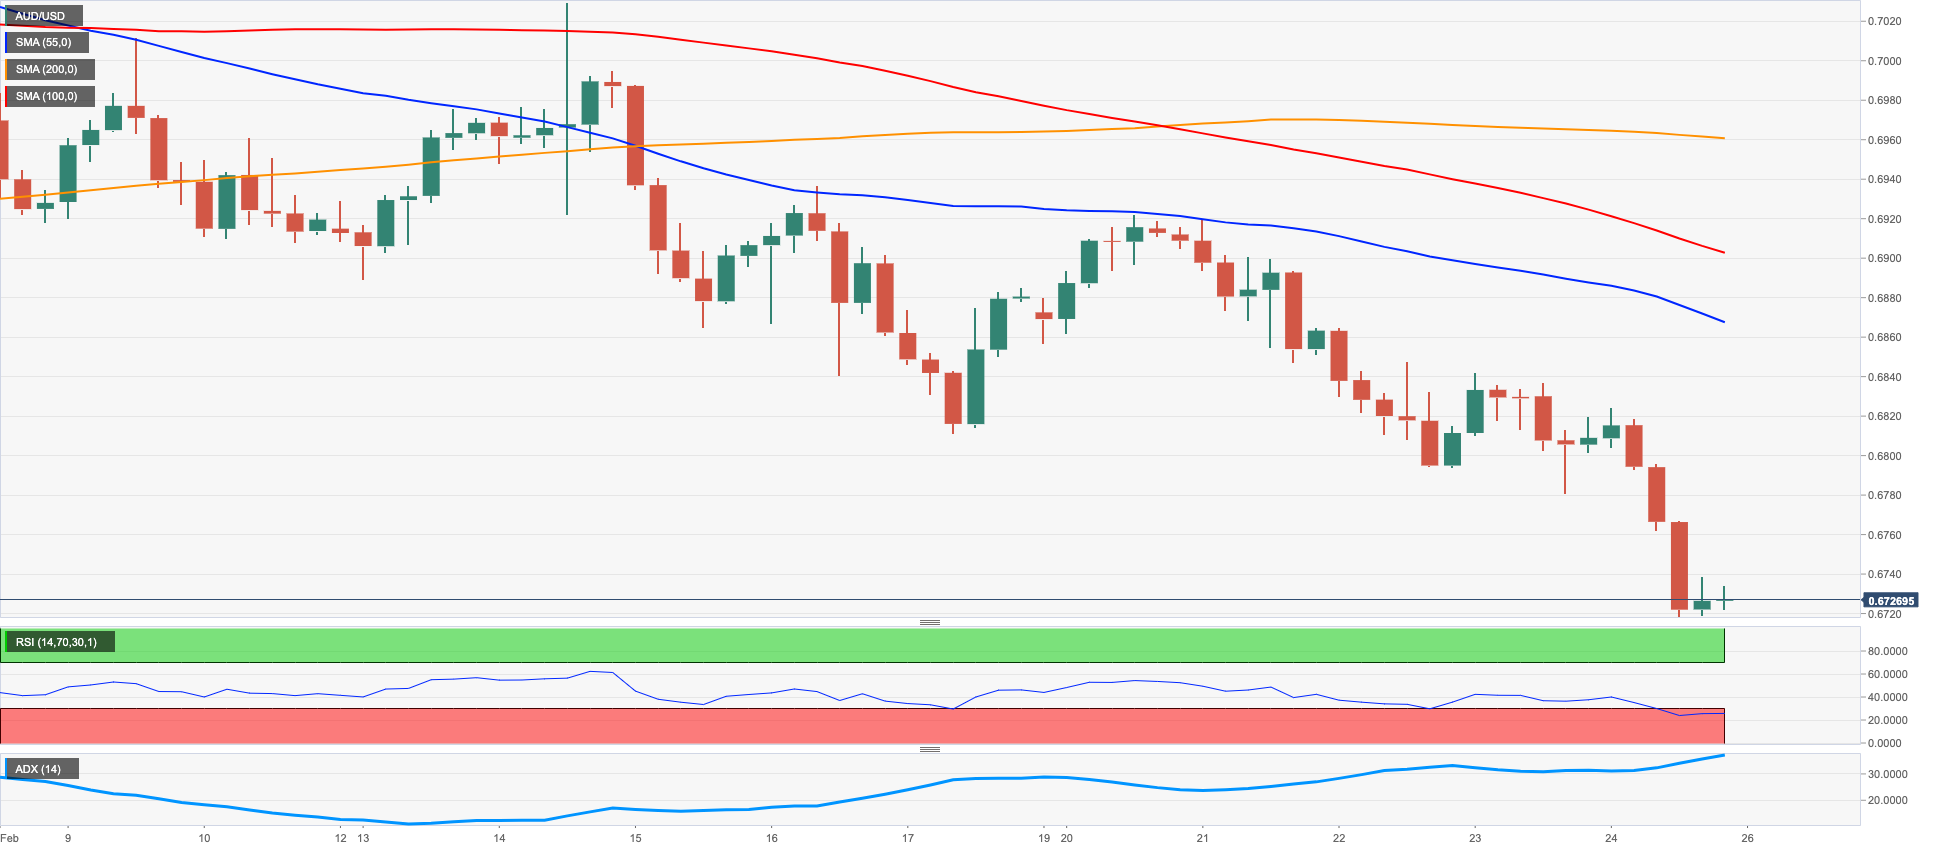
AUD/USD extended the bearish tone and dropped to multi-week lows near the 0.6700 neighbourhood at the end of the week.
The Aussie dollar, therefore, extended the negative performance for the fourth consecutive week and closed Friday’s session over 4 cents lower than the 2023 peak recorded on February 2 (0.7157).
Once again, the pronounced retracement in the pair came in response to the equally strong move higher in the greenback, while the generalized bearish mood in the risk complex added to the daily drop.
In fact, the pair regained downside traction in response to another solid performance of the greenback and the broad-based downbeat mood surrounding the commodity universe, where copper prices and the iron ore added to recent losses.
There were no data releases Down Under on Friday.
The loss of the February low at 0.6718 could motivate AUD/USD to confront the 2023 low at 0.6688 (January 3) ahead of the December 2022 low at 0.6629 (December 20) and the weekly low at 0.6584 (November 21 2022). The other way around, the 55-day SMA at 0.6880 offers provisional resistance just ahead of the weekly peak at 0.6920 (February 20) and another weekly high at 0.7029 (February 14). The surpass of this level could prompt a probable visit to the 2023 top at 0.7157 (February 2) to emerge on the horizon ahead of the round level at 0.7200 and the June 2022 peak at 0.7282 (June 3). The daily RSI deflated to the vicinity of 34.
Resistance levels: 0.6871 0.6920 0.6959 (4H chart)
Support levels: 0.6718 0.6688 0.6650 (4H chart)
GOLD
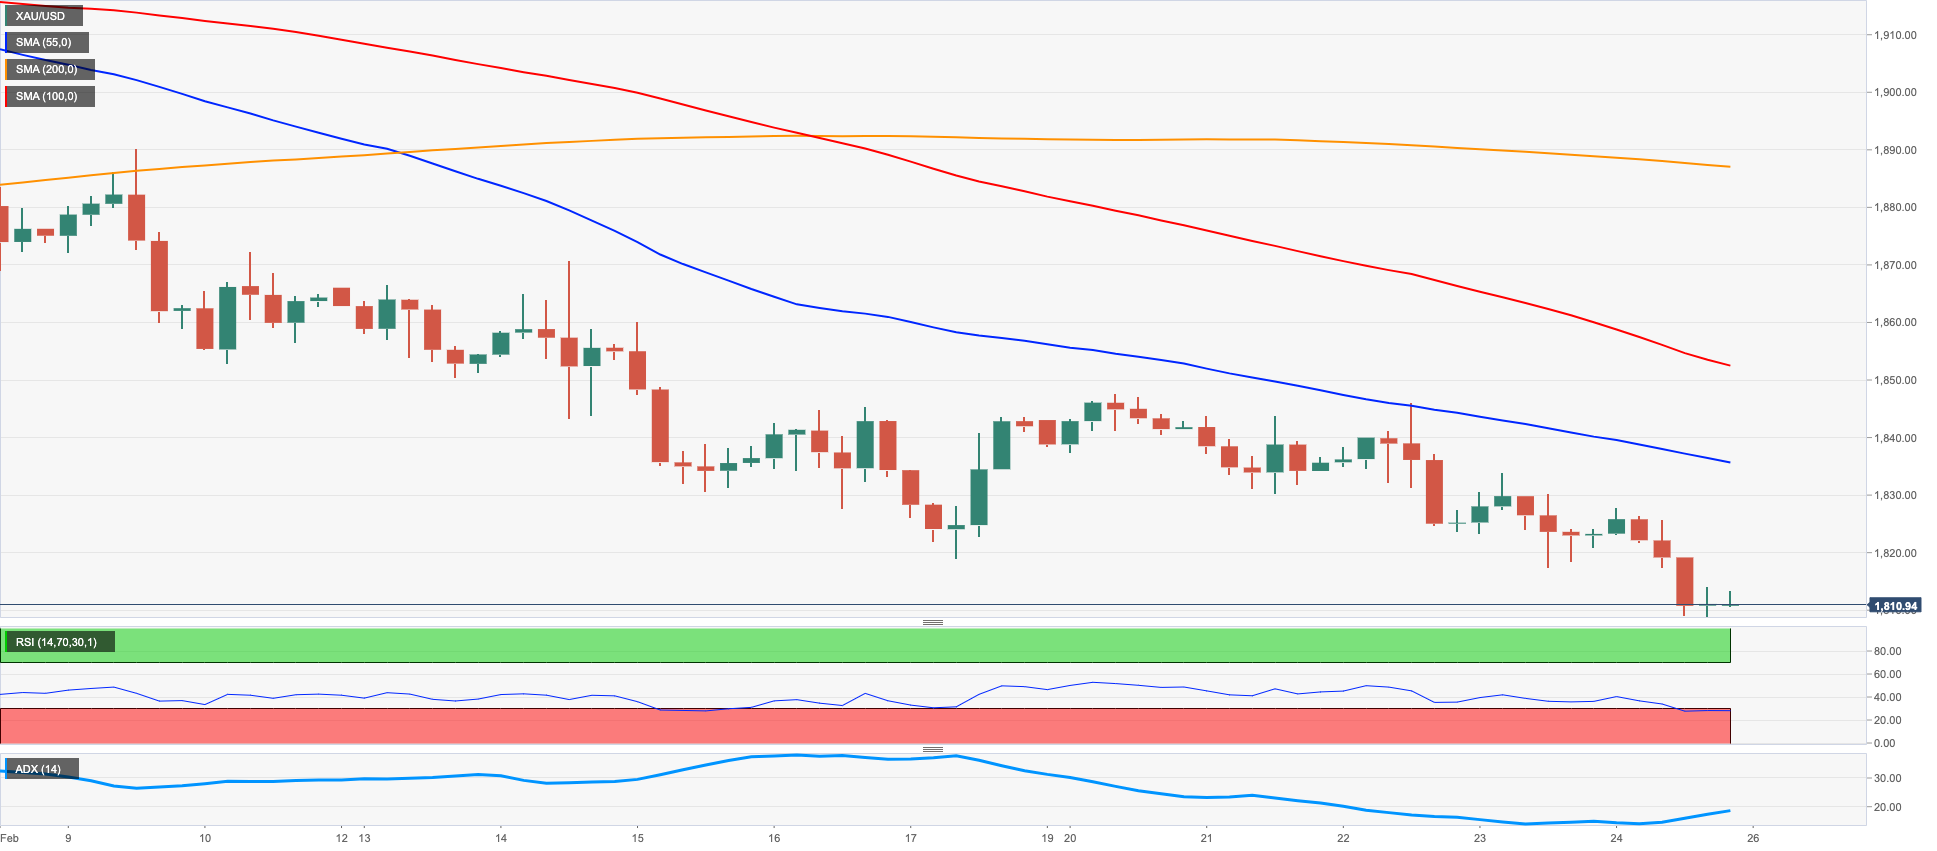
Gold prices extended the weekly leg lower and approached the critical $1800 mark per ounce troy at the end of the week.
Indeed, prices of the yellow metal retreated for the fourth session in a row on Friday in response to the strong pick-up in the demand for the greenback and the relentless march north in US yields across the curve.
Meanwhile, bullion is expected to remain under scrutiny pari passu with rising speculation that the Federal Reserve might contemplate a terminal rate near 5.5% and keeping the restrictive monetary stance for longer than previously estimated.
Next on the downside for gold comes the key $1800 zone followed by the interim 100-day SMA at $1790 and by the always-significant 200-day SMA at $1776. Once this region is breached, the precious metal could accelerate the decline to the weekly low at $1727 (November 23) before the November 2022 low at $1616 (November 3). On the opposite side, the 55-day SMA at $1858 emerges as a temporary hurdle ahead of the weekly top at $1890 (February 9) and the 2023 high at $1959 (February 2). If gains pick up extra impulse, then a visit to the April 2022 top at $1998 (April 18) could emerge on the horizon closely followed by the psychological $2000 level and the 2022 peak at $2070 (March 8).
Resistance levels: $1836 $1846 $1870 (4H chart)
Support levels: $1809 $1797 $1784 (4H chart)
CRUDE WTI
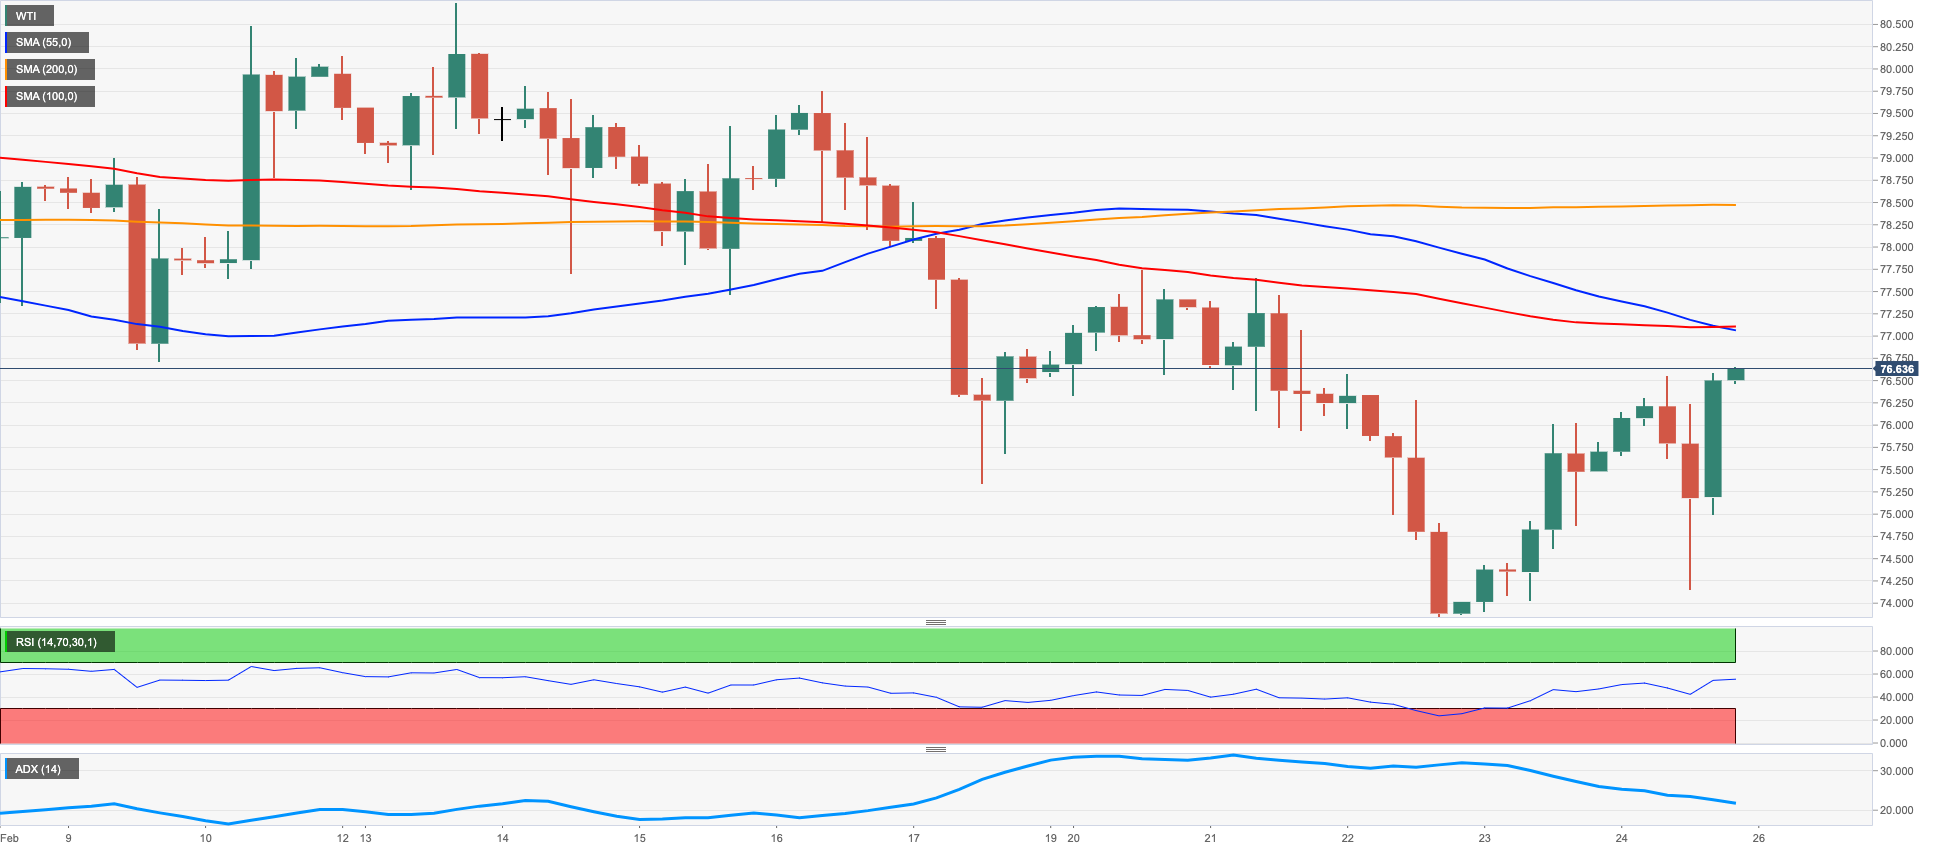
Prices of the American benchmark for the sweet light crude oil extended the optimism seen in the second half of the week and closed Friday’s session with decent gains beyond the $76.00 mark per barrel.
On a weekly basis, the WTI remained largely flat amidst speculation of a reduction of Russian oil exports, another build-up in US crude oil stockpiles and concerns over a potential economic slowdown fuelled by the monetary tightening from major central banks.
In the calendar, driller Baker Hughes reported the US oil rig count went down by 7 in the week to February 24 to a total of 600 US active oil rigs.
WTI faces an immediate up-barrier at the provisional 55-day SMA at $77.33 ahead of the February top at $80.57 (February 13), which now appears propped up by the temporary 100-day SMA. The breakout of this region could open the door to a test of the 2023 peak at $82.60 (January 23) ahead of the December 2022 high at $83.32 (December 1) and the $90.08 level (November 11 2022). Just the opposite, a deeper drop from the weekly low at $73.83 (February 22), should put the 2023 low at $72.30 (February 6) to the test prior to the 2022 low at $70.10 (December 9) and the key round level at $70.00.
Resistance levels: $76.58 $77.69 $78.19 (4H chart)
Support levels: $73.77 $72.22 $70.07 (4H chart)
GER40
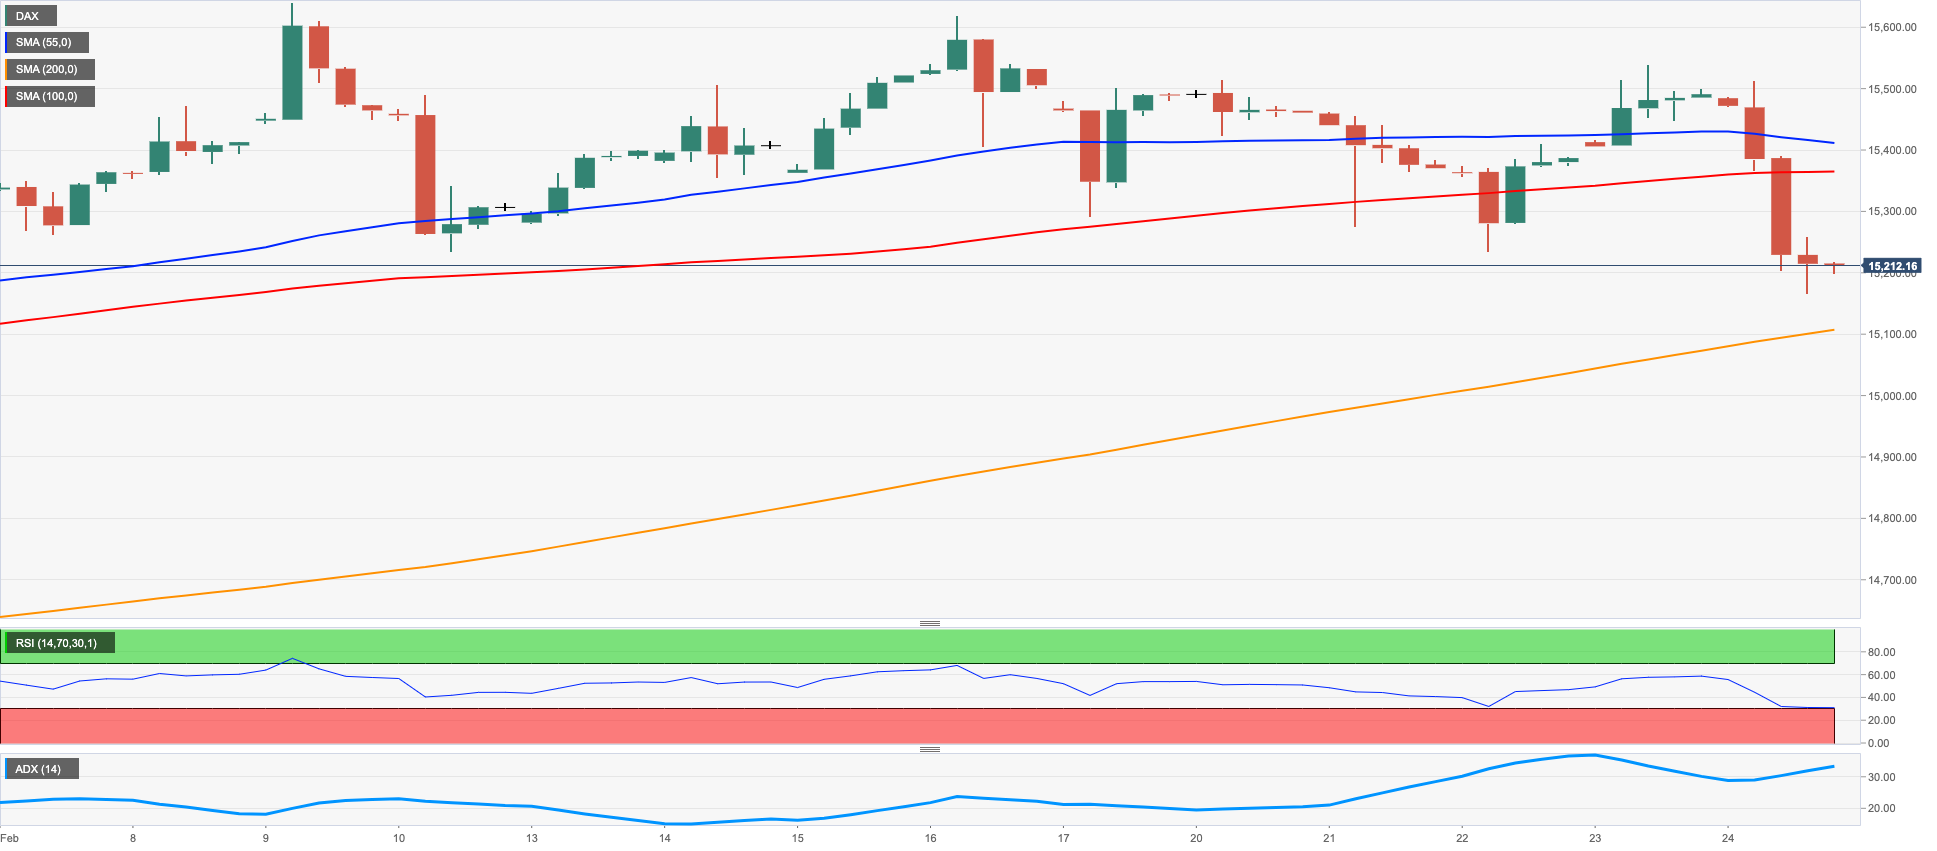
German equities measured by the benchmark DAX40 retreated to multi-day lows and closed Friday’s session at shouting distance from the monthly lows around the 15200 zone.
The daily pullback in the DAX40 fell in line with the rest of its European peers against the backdrop of a persistent risk-off sentiment in the global markets, which continued to find support in the prospects for further tightening of the monetary conditions in the region and the US.
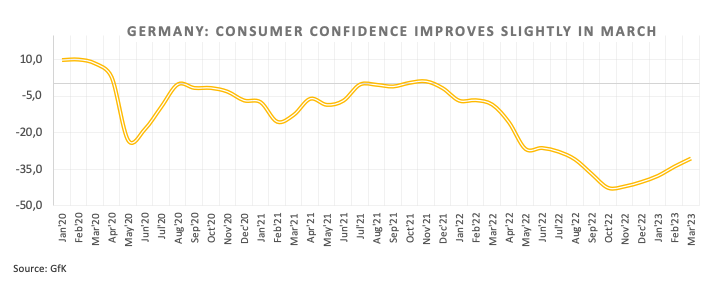
Despite Germany’s Consumer Confidence edging a tad higher for the month of March (-30.5), disheartening prints from the final Q4 GDP Growth Rate kept the mood subdued.
On the latter, the economy expanded 0.9% YoY in Q4 2022 and contracted 0.4% vs. the previous quarter.
In the domestic money market, the 10-year Bund yields kept the range bound theme unchanged around the 2.55% region.
The next support for the DAX40 is expected at the weekly low at 14906 (January 19) ahead of the interim 55-day SMA at 14841. Down from here comes the December 2022 low at 13791 (December 20) before the key 200-day SMA at 13762. In the opposite direction, no changes to the topside, as the initial hurdle emerges at the 2023 high at 15658 (February 9) followed by the February 2022 top at 15736 (February 2 2022) and the round level at 16000. Further gains could then retest the 2022 peak at 16285 (January 5). The daily RSI plummeted to the boundaries of the 48 area.
Best Performers: Linde PLC, Deutsche Boerse, Munich Re Group
Worst Performers: BASF, Vonovia, Infineon
Resistance levels: 15552 15634 15658 (4H chart)
Support levels: 15162 14906 14766 (4H chart)
NASDAQ
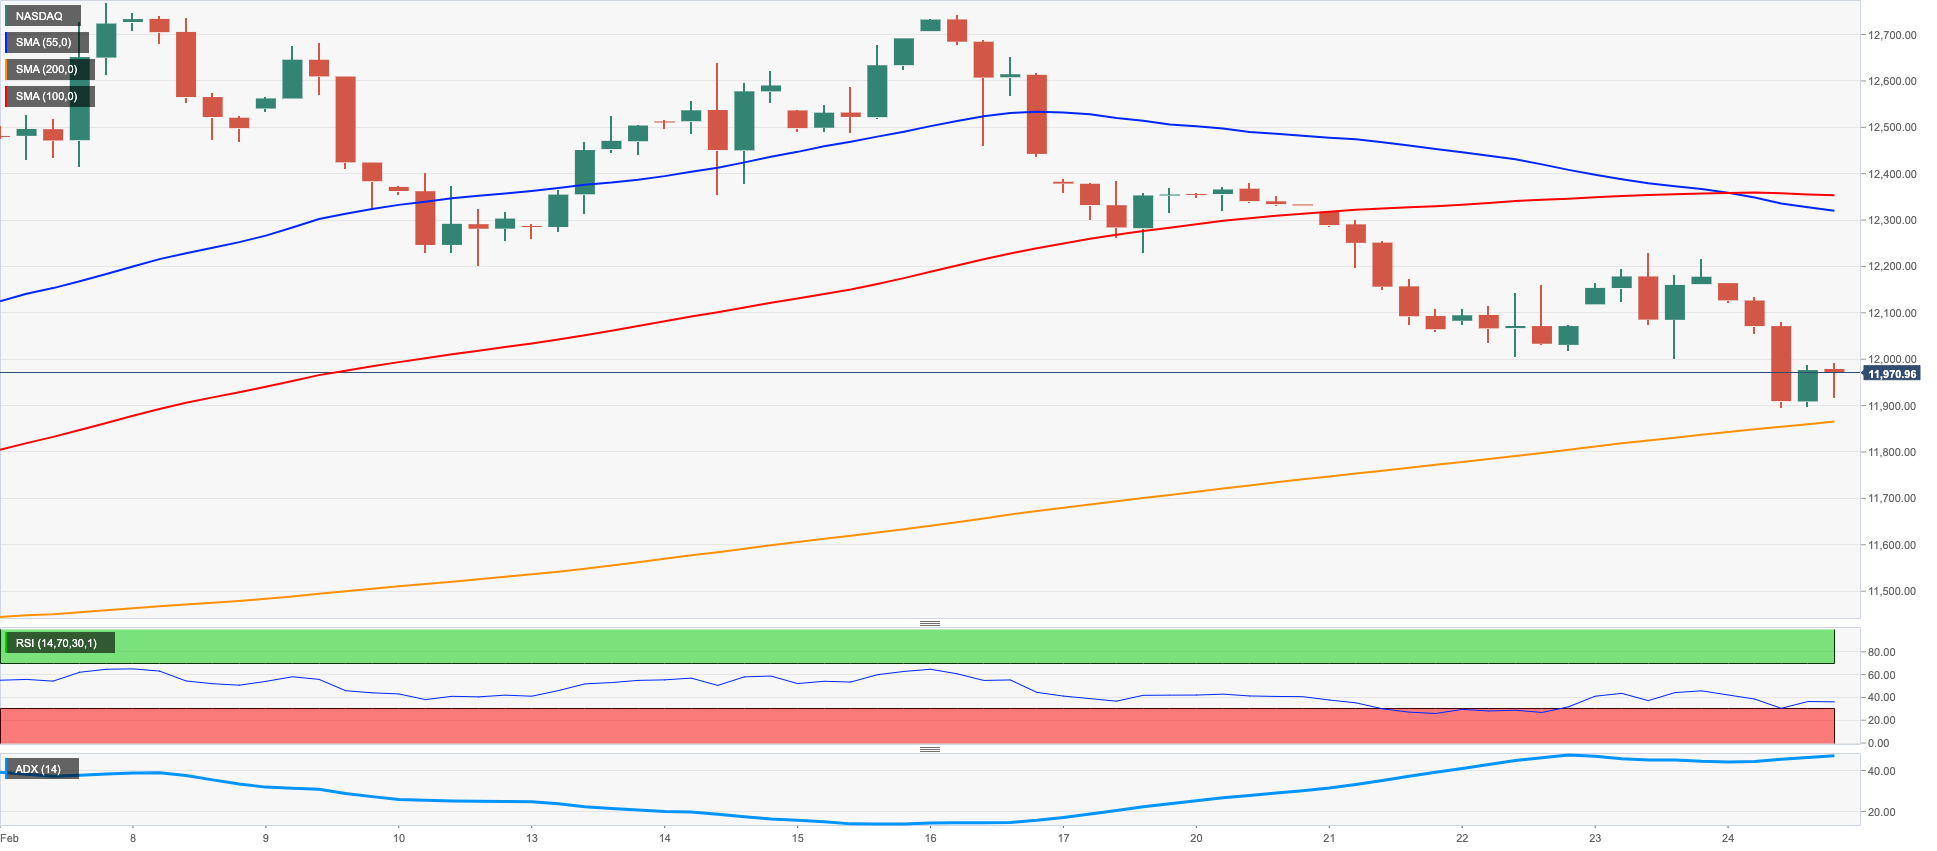
Tech equities gauged by the Nasdaq 100 lost further ground and recorded new 4-week lows around 11900 at the end of the week, a region also coincident with the key 200-day SMA.
The firm risk-off sentiment in combination with extra advance in the greenback and the persevering monthly march north in US yields across the curve, all kept the tech sector under heavy pressure on Friday.
In addition, firmer conviction that the Fed could hike rates beyond the 5% threshold and stay around those levels for a while also weighed on investors’ mood and drag prices lower.
The February low at 11900 (February 24) appears underpinned by the key 200-day SMA at 11904. If the Nasdaq 100 breaks below the latter, it could spark a deeper drop to weekly lows at 11550 (January 25) and 11251 (January 19) prior to the January low at 10696 (January 6) and the December 2022 low at 10671 (December 22). By contrast, there are no resistance levels of note until the 2023 high at 12880 (February 2) followed by the round level at 13000 and ahead of the weekly top at 13175 (August 26 2022). The daily RSI eased to the proximity of 46.
Top Gainers: Intuit, Dollar Tree, MercadoLibre
Top Losers: Autodesk, Adobe, Moderna
Resistance levels: 12689 12771 12880 (4H chart)
Support levels: 11900 11550 11251 (4H chart)
DOW JONES
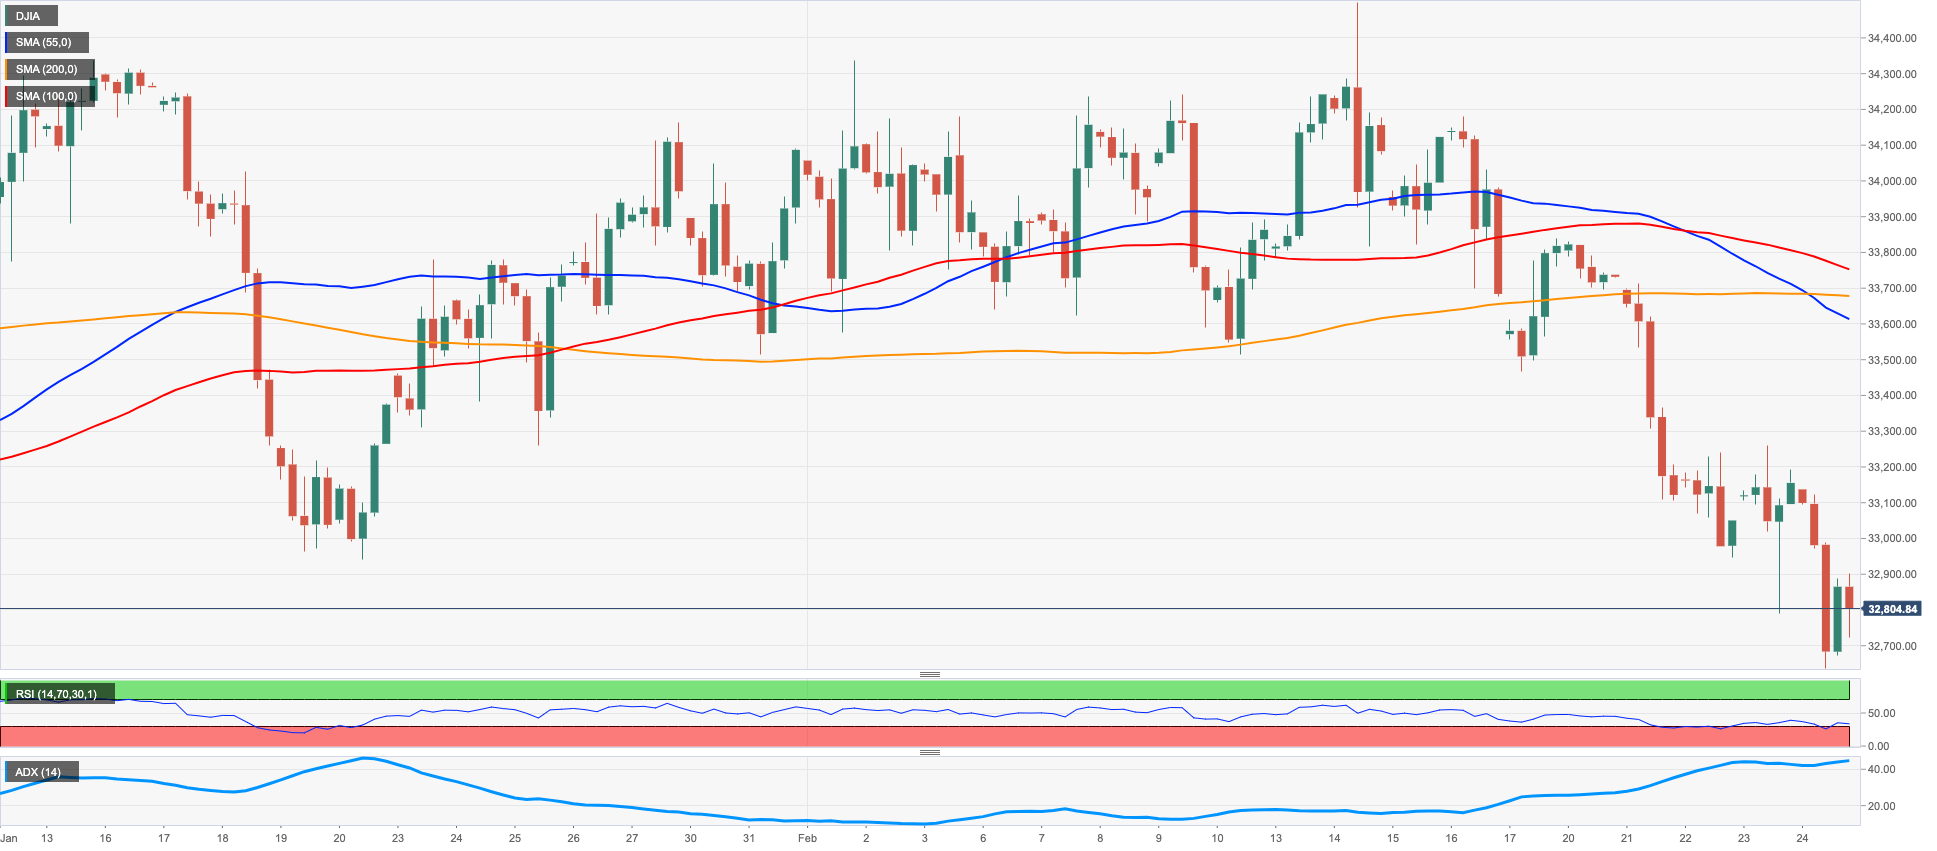
Equities tracked by the Dow Jones dropped further and recorded new yearly lows near the 32600 region on Friday, extending the negative streak for the fourth week in a row at the same time.
In fact, stronger-than-expected results from key US fundamentals on Friday lent further oxygen to the prospect for the Fed’s tighter-for-longer stance, while supporting at the same time the idea that the terminal rate could hit the 5.5%, all adding to the already sour mood among investors.
Supporting the latter, FOMC’s Collins advocated for extra rate hikes to fight a too high inflation, adding that this view is reinforced by recent US data results. In the same line, Cleveland Fed Mester suggested the need to hike rates beyond 5% and stay there for a while.
Collaborating with the decline in stocks appeared another solid performance of the dollar in combination with further upside in US yields.
All in all, the Dow Jones retreated 1.02% to 32816 the S&P500 dropped 1.05% to 3970 and the tech-reference Nasdaq Composite deflated 1.69% to 11394.
The loss of the 2023 low at 32643 (February 24) could force the Dow to challenge the December 2022 low at 32573 (December 22) prior to the key 200-day SMA at 32346. On the other hand, an initial up-barrier comes at the temporary 55-day SMA at 33586 seconded by the 2023 high at 34342 (January 13) and the December 2022 top at 34712 (December 13). Extra gains could see the April 2022 peak at 35492 (April 21) revisited prior to the February 2022 high at 35824 (February 9). The daily RSI lost further ground and broke below the 37 level.
Top Performers: Dow, JPMorgan, Verizon
Worst Performers: Boeing, Microsoft, Intel
Resistance levels: 33272 33703 34334 (4H chart)
Support levels: 32643 32573 31727 (4H chart)
MACROECONOMIC EVENTS

All Information & Updates provided by:

All information relating to the financial markets available on this page has been prepared and issued by FXStreet (Forexstreet SL, Spain, Reg: B62498233) on the basis of publicly available information and all information believed to be reliable and does not conflict with Kuwaiti local laws, and all necessary care has been taken to before the company to ensure that the facts mentioned are correct from the source.
NCM Investment nor any of its directors or employees shall in any way be held responsible for the contents of this news, and the information contained on this page is intended only to provide clients with publicly available information and should not be construed as investment advice, report or analysis and/or constitute an offer or invitation to buy or sell financial instruments of any kind.
RISK WARNING: Forex and CFDs are highly risky leveraged products, as losses can exceed deposits. Please ensure you understand all the risks and take independent advice if necessary. NCM will segregate the clients based on the criteria of the regulator and its bylaws. NCM does not provide any advisory service; the material published does not constitute advice or a recommendation for a transaction in any financial instrument. NCM accepts no responsibility for any use of the content presented and any consequences of that use. Anyone acting on the information provided does so at their own risk.