
- Contact Us:
-

-

-

-


Daily Market Updates
28 Feb 2023
USDJPY
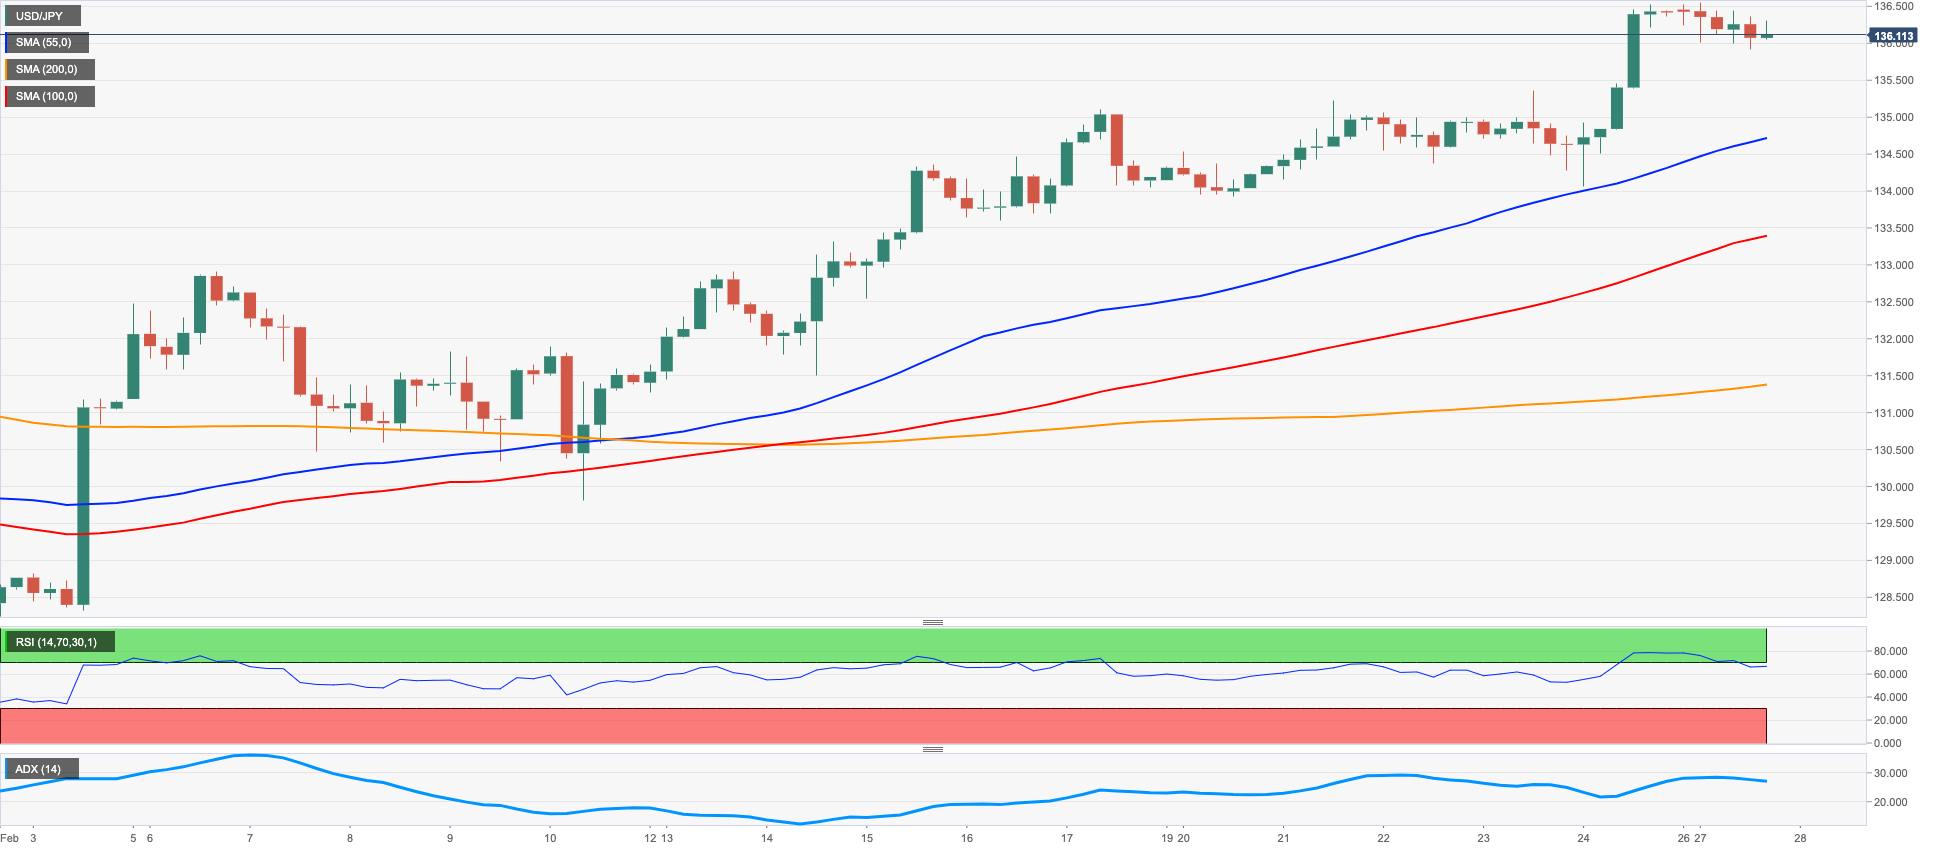
USD/JPY could not sustain the initial bullish attempt to new 2023 highs around 136.55 and slipped back to the 136.00 neighbourhood at the beginning of the week.
Indeed, the pair came under pressure after US yields changed course and reversed the initial bid bias. The knee-jerk in US yields, in the meantime, accompanied the renewed selling pressure in the greenback. In Japan, further consolidation around the 0.50% level in the JGB 10-year yields remained well in place on Monday.
In the Japanese docket, final figures for the month of December saw the Coincident Index at 99.1 and the Leading Economic Index at 97.2, both down from 99.3 and 97.7, respectively.
From the BoJ, Governor nominee K.Ueda said that the current monetary policy stance remains appropriate and added that the central bank did not intend to exit back in December 2022, at the time when he also ruled out any changes to the 2% inflation goal.
A move beyond the 2023 top at 136.55 (February 27) could motivate USD/JPY to confront the key 200-day SMA at 137.11 followed by weekly peaks at 138.17 (December 15 2022) and 139.89 (November 30 2022), all ahead of the key round level at 140.00. In the opposite direction, there is a minor support at 134.05 (February 24) ahead of the interim 55-day SMA at 132.17 and the weekly low at 129.79 (February 10). The breakdown of this level could pave the way for a visit to the February low at 128.08 (February 2) followed by the 2023 low at 127.21 (January 16) and the May 2022 low at 126.36 (May 24). The daily RSI lost the grip and approached the 67 yardstick.
Resistance levels: 136.55 137.47 138.17 (4H chart)
Support levels: 134.05 132.82 131.49 (4H chart)
GBPUSD
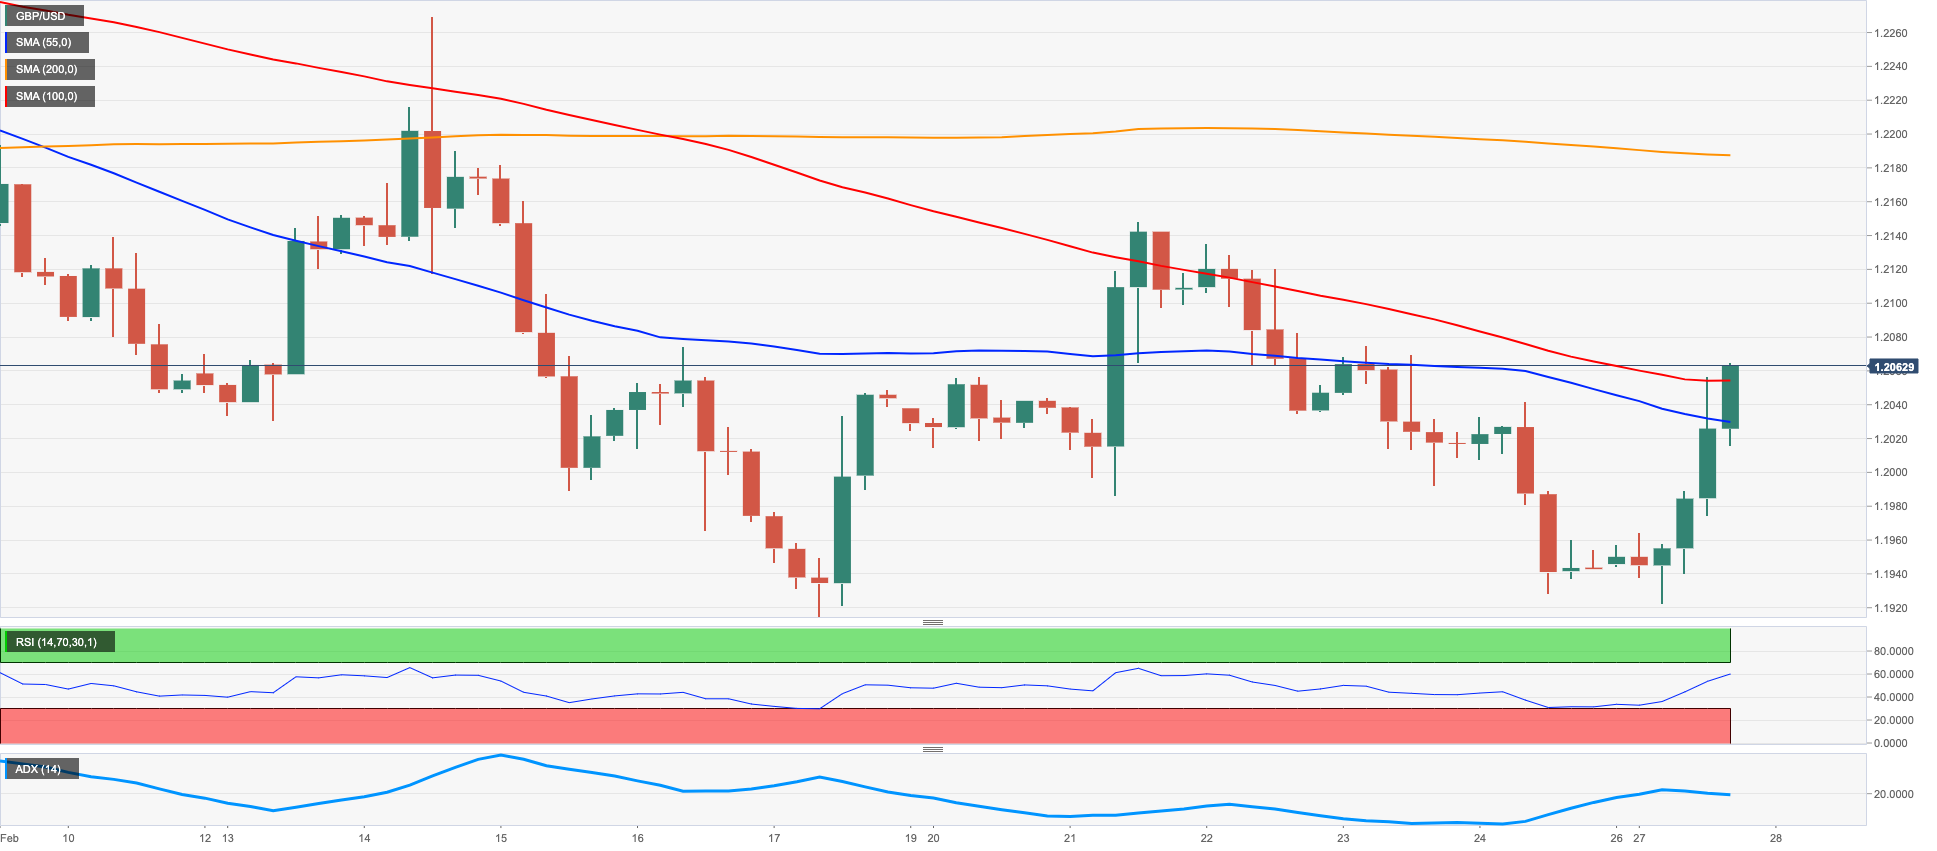
The corrective decline in the dollar gave some much-needed oxygen to the risk-associated universe and lifted GBP/USD back above the key 1.2000 region on Monday.
Indeed, Cable left behind three consecutive daily pullbacks and regained strong upside traction following an initial decline and test of the critical 200-day SMA near 1.1925 at the beginning of the week.
The daily bounce in the British pound also came on the back of further upside in the 10-year Gilt yields, this time testing the area above the 3.80% level for the first time since late October 2022.
The UK docket was empty on Monday.
GBP/USD faces the next up barrier at the weekly high at 1.2147 (February 21), which seems reinforced by the interim 55-day SMA at 1.2153. The breakout of this level exposes a move to the weekly top at 1.2269 (February 14) prior to the 2023 peak at 1.2447 (January 23) and the May 2022 high at 1.2666 (May 27). Once the latter is cleared, then a test of the 200-week SMA at 1.2881 could start shaping up prior to the psychological 1.3000 yardstick. On the flip side, the weekly low at 1.1922 (February 27) looks propped up by the 200-day SMA (1.1925) and precedes the February low at 1.1914 (February 17). Further losses could put the 2023 low at 1.1841 (January 6) back on the investors’ radar ahead of the November 2022 low at 1.1142 (November 4). The daily RSI picked up pace and flirted with 47.
Resistance levels: 1.2061 1.2147 1.2186 (4H chart)
Support levels: 1.1922 1.1914 1.1841 (4H chart)
AUDUSD
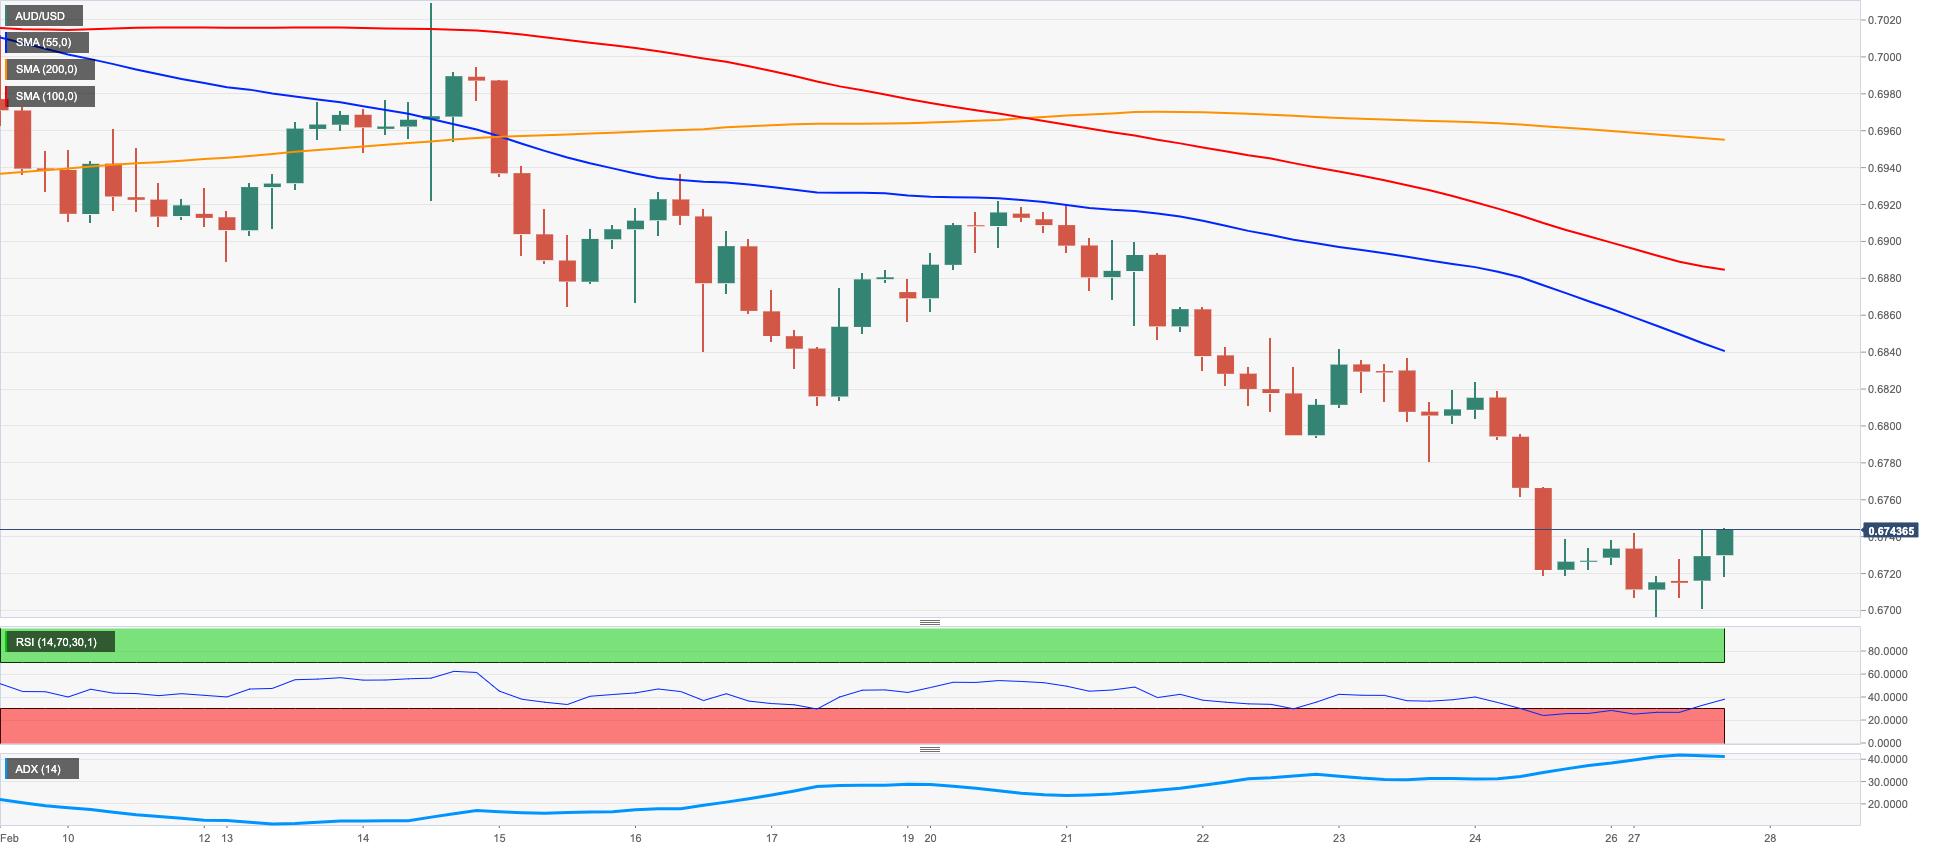
AUD/USD bounced off the sub-0.6700 levels and managed to advance decently on the back of the marked move lower in the dollar at the beginning of the week.
Indeed, the Aussie dollar regained balance and faded part of Friday’s sharp retracement in response to increased selling pressure surrounding the greenback, while the generalized upbeat mood in the risk complex and the commodity space also lent wings to the pair.
In Oz, Business Inventories shrank 0.2% QoQ in Q4 and Company Gross Profits expanded 10.6% inter-quarter.
AUD/USD could see its losses accelerate on a breach of the February low at 0.6698 (February 27). Soon after the latter emerges the 2023 low at 0.6688 (January 3) prior to the December 2022 low at 0.6629 (December 20) and the weekly low at 0.6584 (November 21 2022). Having said that, there is an immediate up-barrier at the 200-day SMA at 0.6797 before the weekly high at 0.6920 (February 20) and another weekly top at 0.7029 (February 14). Further up aligns the 2023 peak at 0.7157 (February 2) ahead of the round level at 0.7200 and the June 2022 high at 0.7282 (June 3). The daily RSI bounced to the area north of the 36 mark.
Resistance levels: 0.6848 0.6920 0.6954 (4H chart)
Support levels: 0.6698 0.6688 0.6650 (4H chart)
GOLD
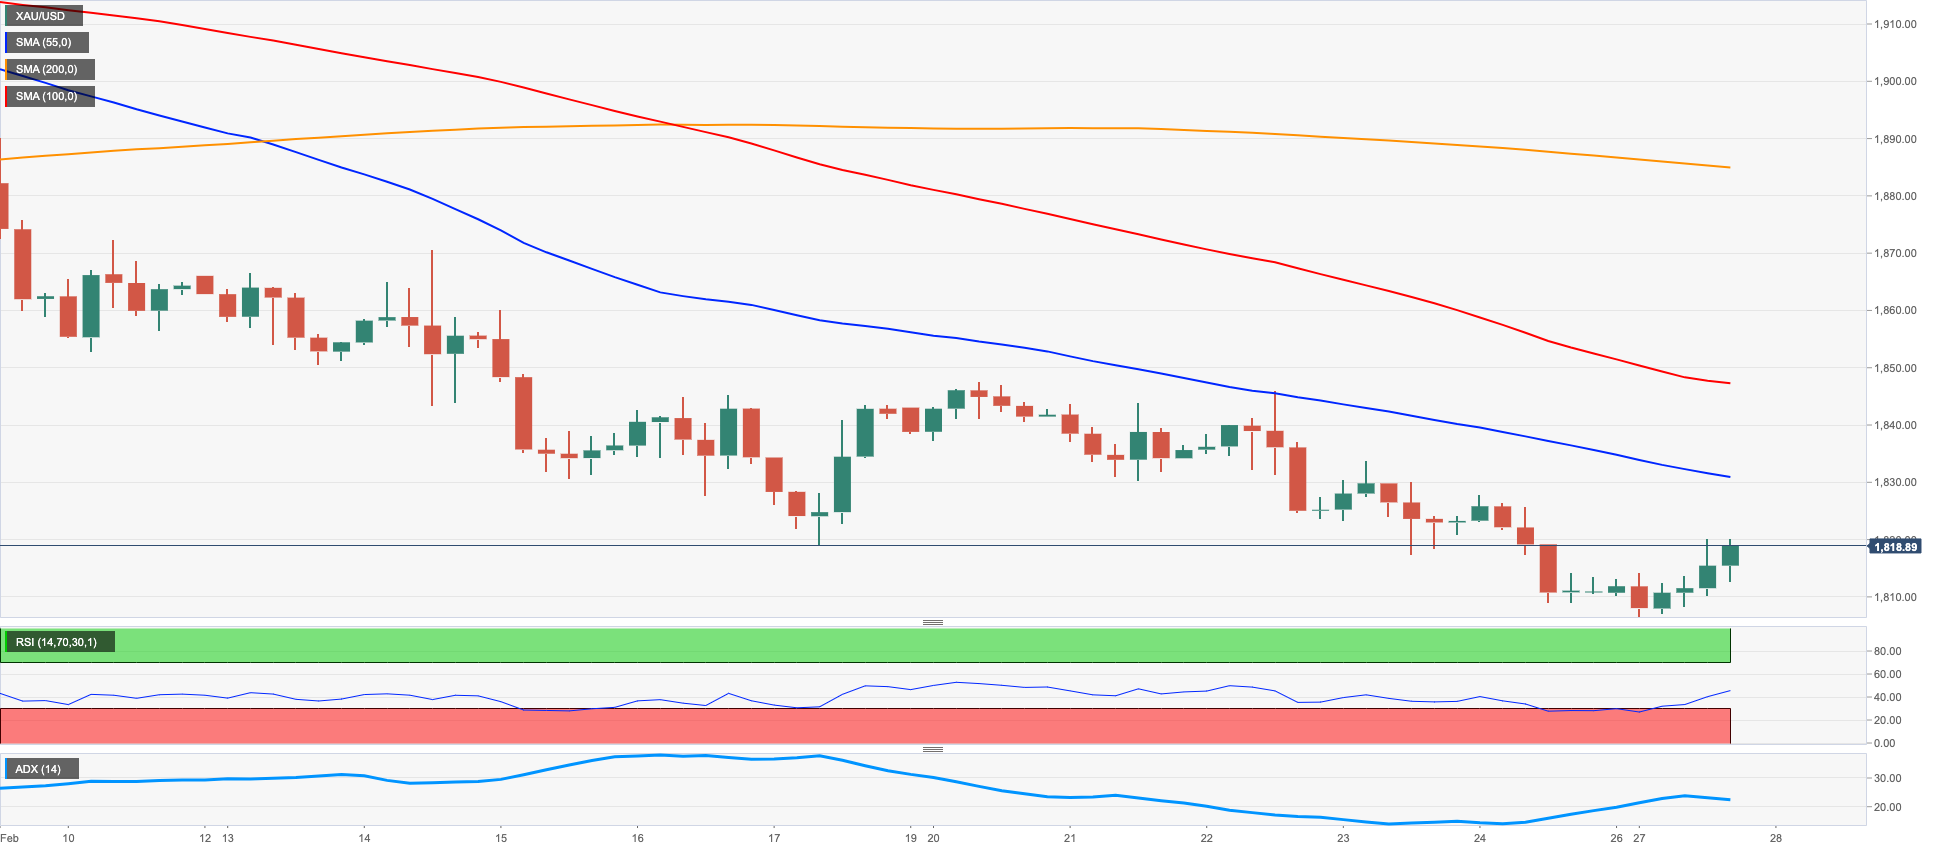
The renewed weakness in the greenback sponsored a marked rebound in prices of the yellow metal and supported the decent recovery in the risk complex at the same time.
In fact, the fresh offered bias forced the USD Index (DXY) to abandon the area of multi-week highs and return to the sub-105.00 region, while the change of direction in US yields across the curve also sustained the daily bounce in the precious metal following four consecutive daily pullbacks.
So far, USD dynamics and expectations around the probable moves by the Federal Reserve when it comes to its ongoing normalization cycle as well as views from Fed’s rate setters should continue to rule the sentiment around bullion for the time being.
Gold clocked a new 2023 low at $1806 (February 27) before regaining some composure on Monday. The loss of this level exposes the key $1800 zone ahead of the provisional 100-day SMA at $1791 and the key 200-day SMA at $1776. The breakdown of this zone could put the weekly low at $1727 (November 23) to the test ahead of the November 2022 low at $1616 (November 3). The other way around, the initial up barrier comes at the interim 55-day SMA at $1858 before the weekly peak at $1890 (February 9) and the 2023 high at $1959 (February 2). North from here turns up the April 2022 top at $1998 (April 18) ahead of the psychological $2000 level and the 2022 peak at $2070 (March 8).
Resistance levels: $1819 $1832 $1846 (4H chart)
Support levels: $1806 $1797 $1784 (4H chart)
CRUDE WTI
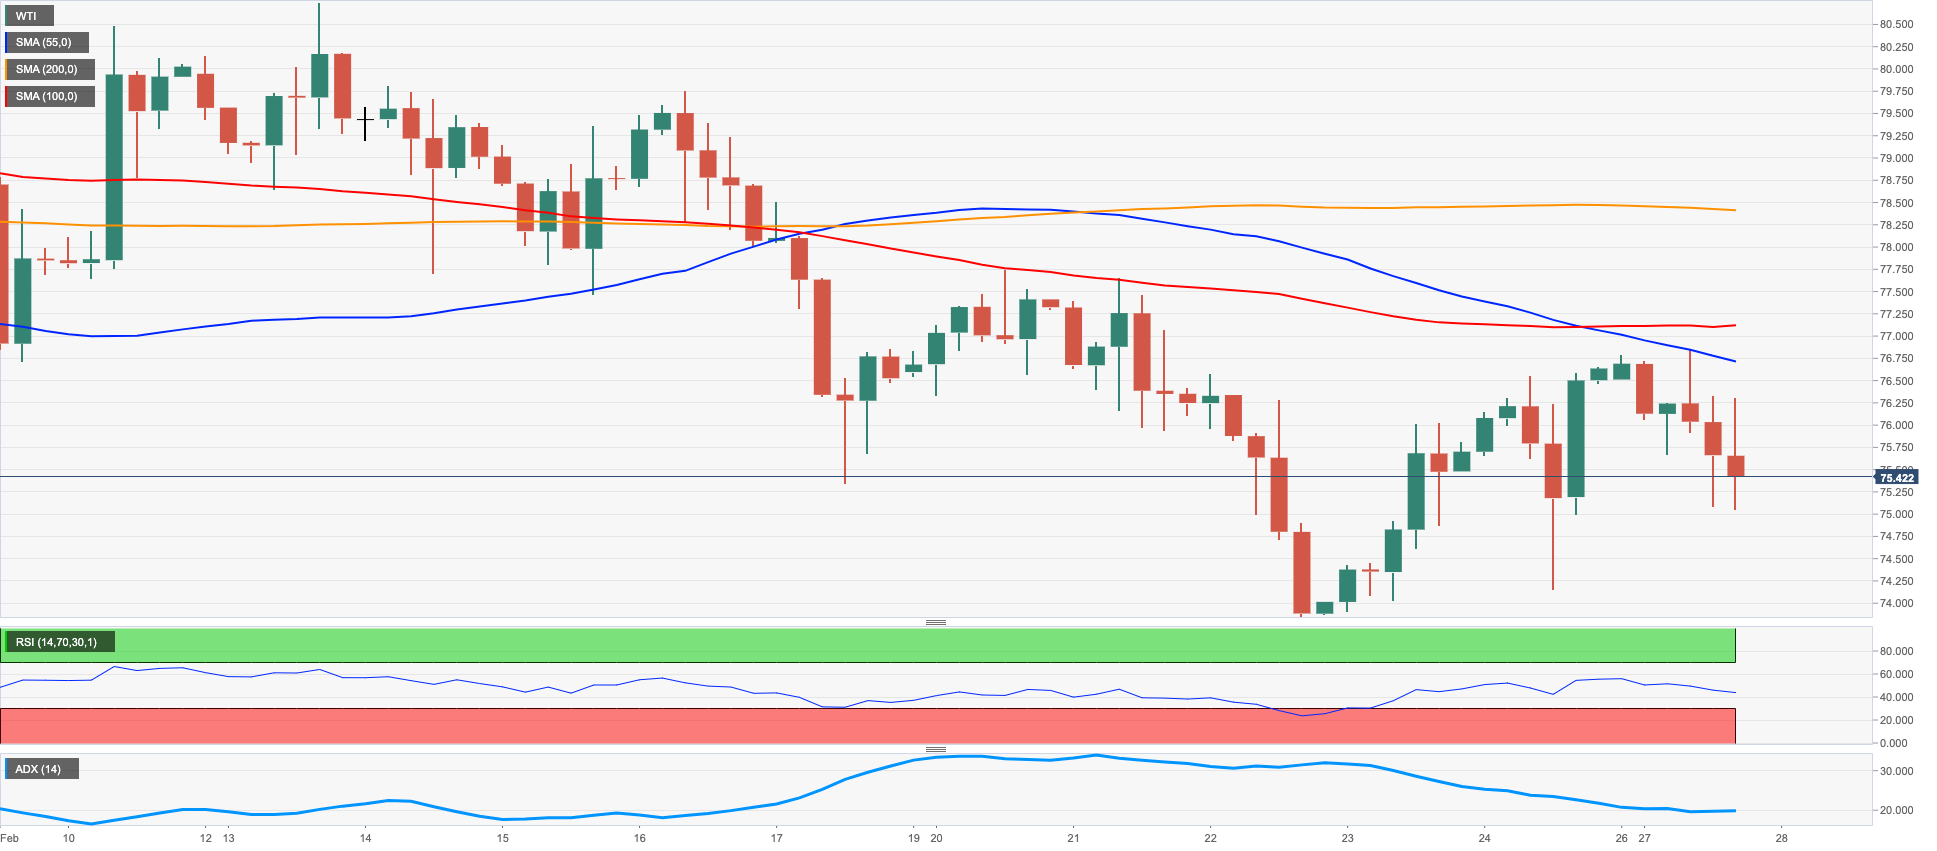
WTI prices reversed two consecutive daily pullbacks and flirted with the $75.00 mark per barrel at the beginning of the week.
Once again, concerns over a probable economic slowdown and its direct impact on the demand for crude oil outweighed supply fears following last week’s news that Russian could trim its crude oil exports by 25%, which is more than the original announcement of around 500 kbpd made in the previous week.
Later in the session, the API and the EIA will report on weekly US crude oil supplies on Tuesday and Wednesday, respectively, ahead of Baker Hughes’ usual report on the US drilling activity.
WTI appears broadly side-lined since the beginning of the new year, with a clear lower end around the $72.00 region. So far, the loss of the weekly low at $73.83 (February 22) could prompt the commodity to dispute the 2023 low at $72.30 (February 6) ahead of the 2022 low at $70.10 (December 9) and the key round level at $70.00. For all that, the 55-day SMA at $77.40 is expected to offer transitory resistance seconded by the February peak at $80.57 (February 13). North from here emerges the 2023 high at $82.60 (January 23) seconded by the December 2022 top at $83.32 (December 1) and ahead of the $90.08 level (November 11 2022).
Resistance levels: $76.77 $77.69 $78.23 (4H chart)
Support levels: $75.00 $74.06 $72.22 (4H chart)
GER40
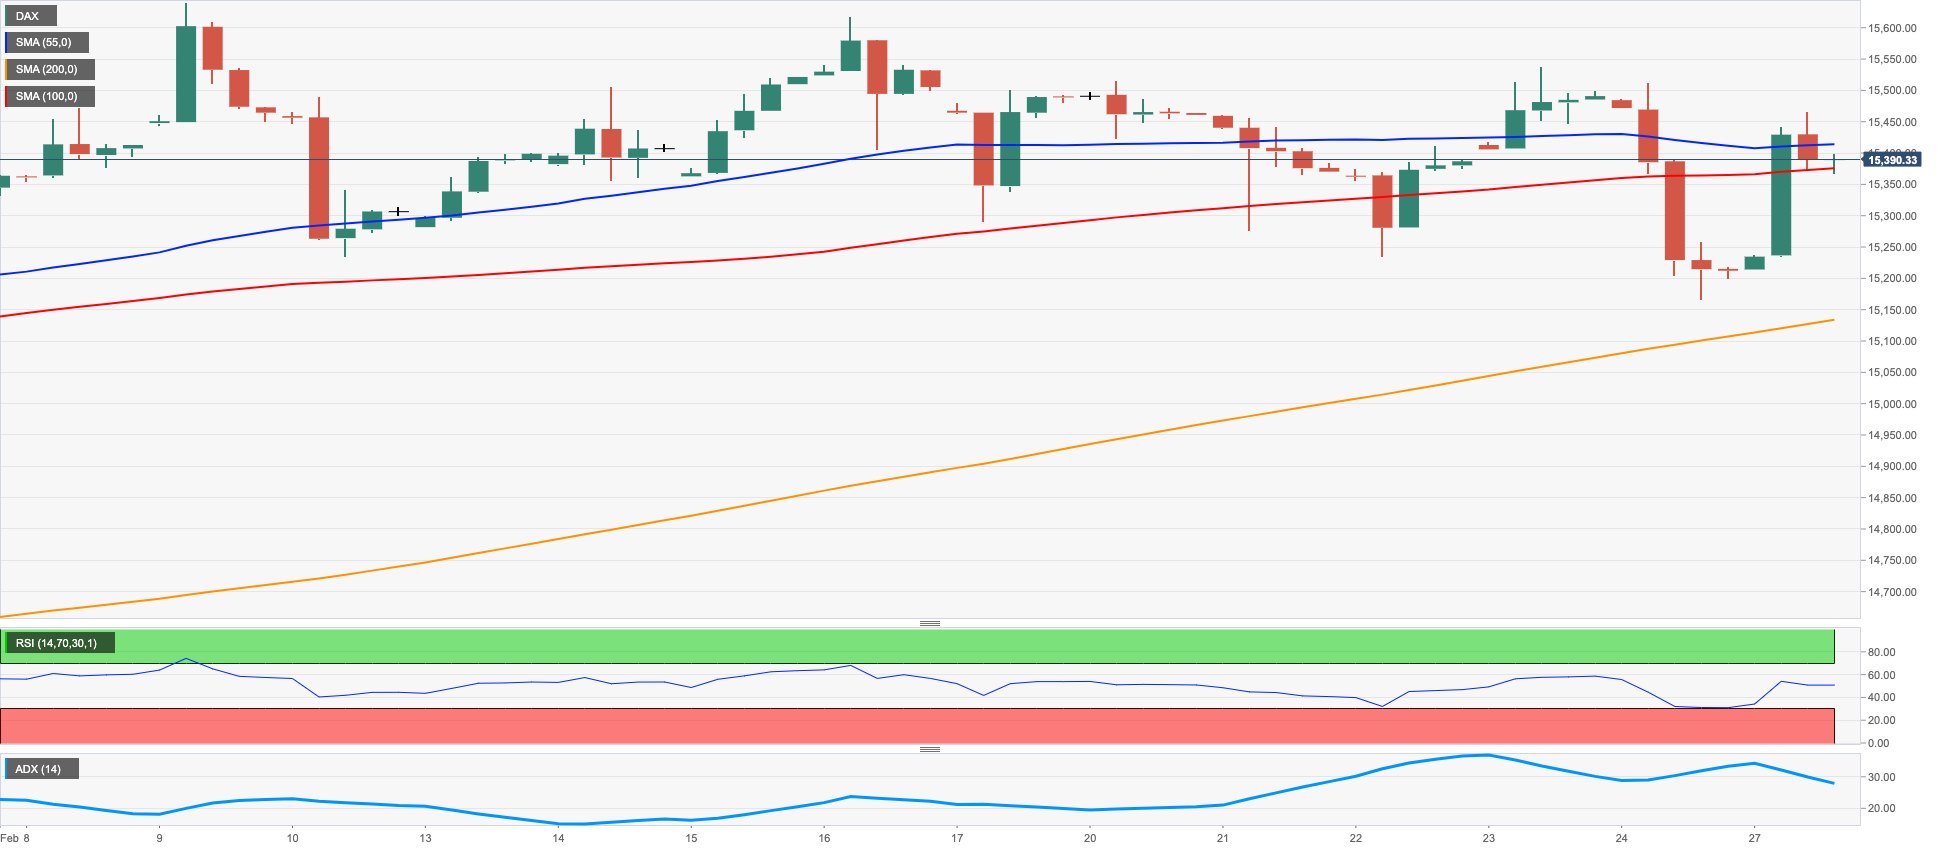
Equities tracked by the German reference index DAX40 followed the rest of its European peers and started the week on a positive note, leaving behind at the same time Friday’s sharp decline.
The generalized optimism among investors lifted spirits in all sectors, while the comeback of the German lender Commerzbank to the blue-chip index also added to the upbeat mood.
Moving forward, market participants are expected to closely follow advanced inflation figures in key economies later in the week, at the time when Chair Lagarde reiterated earlier on Monday that the ECB remains on track to hike rates by half percentage point at the March event.
In the debt market, the 10-year Bund yields added to Friday’s gains and poked with yearly highs around 2.60%.
While further consolidation appears the name of the game for the DAX40 in the near term, the immediate contention emerges at the weekly low at 15162 (February 24) ahead of another weekly low at 14906 (January 19). Further south emerges the temporary 55-day SMA at 14859 seconded by the December 2022 low at 13791 (December 20) and the key 200-day SMA at 13769. On the other hand, the next up barrier remains at the 2023 top at 15658 (February 9) ahead of the February 2022 peak at 15736 (February 2 2022). The continuation of the uptrend could retest the round level at 16000 prior to the 2022 high at 16285 (January 5). The daily RSI made a U-turn and leapt to the vicinity of 55.
Best Performers: Commerzbank, Continental AG, Siemens Healthineers
Worst Performers: Zalando SE, BASF, Bayer
Resistance levels: 15552 15634 15658 (4H chart)
Support levels: 15162 14906 14766 (4H chart)
NASDAQ
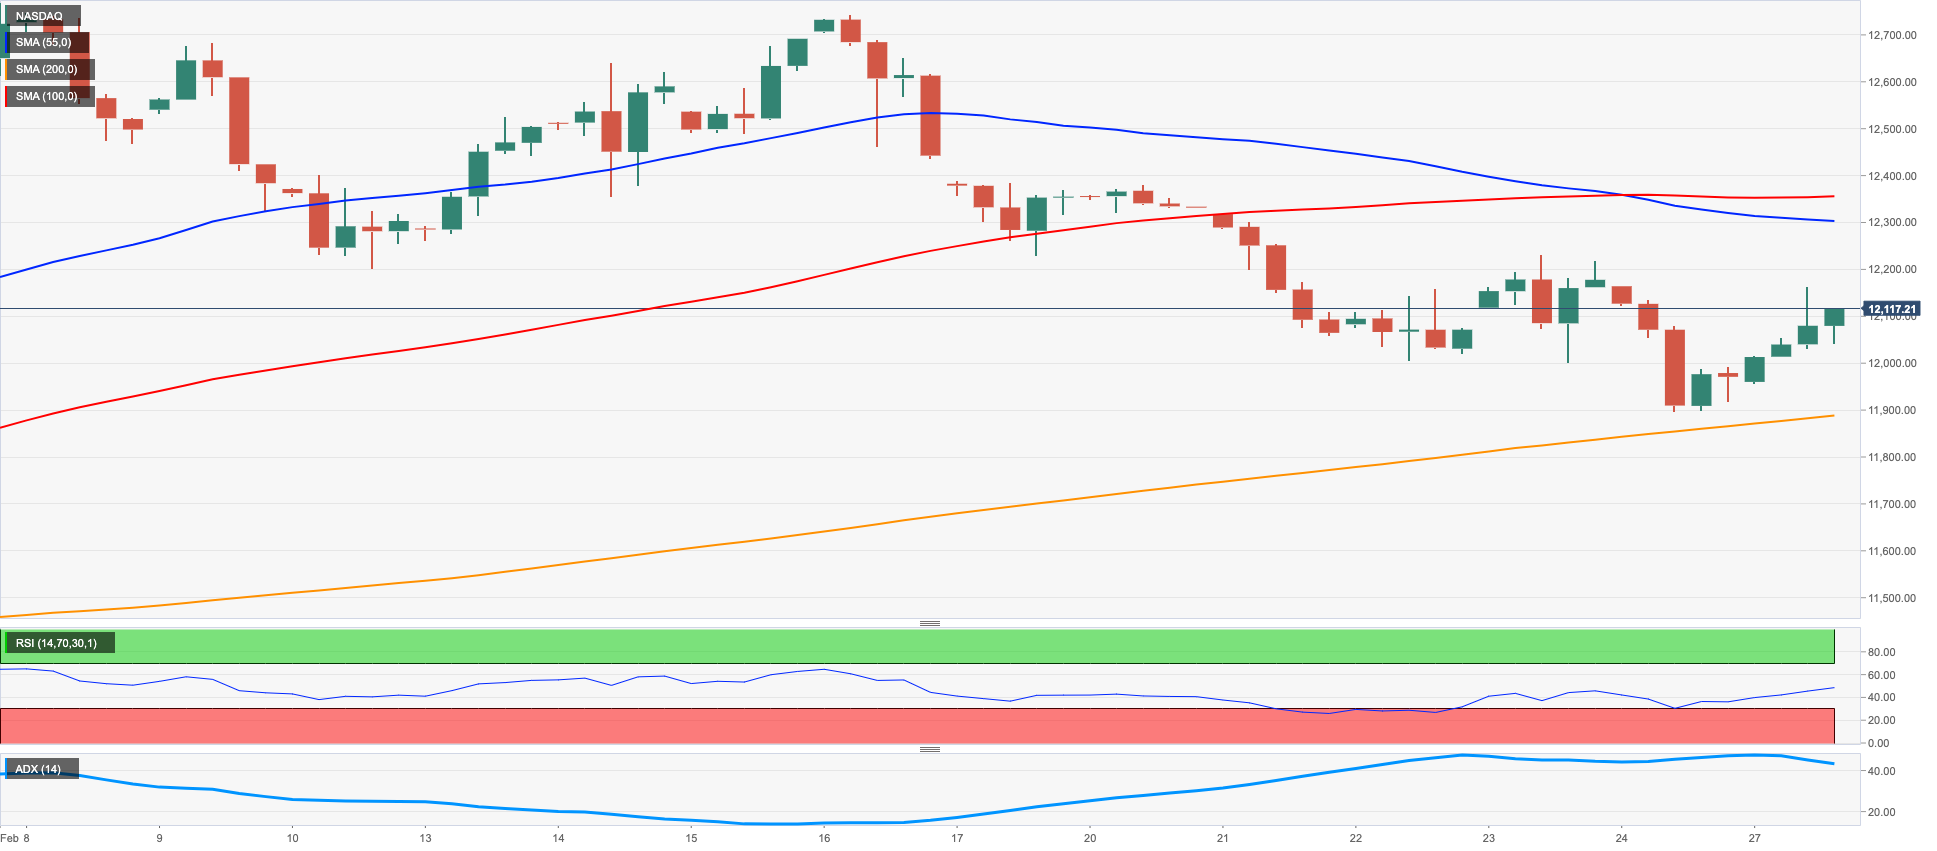
The broad-based optimism in the risk complex coupled with the renewed offered bias in the greenback and the downtick in US yields in the short end and the belly of the curve all sponsored an auspicious start of the week for the Nasdaq 100, which at the same time put further distance from Friday’s multi-week lows.
Indeed, the tech benchmark index regained the smile as well as the 12000 mark, quickly leaving behind recent lows around the 11900 region, where the key 200-day SMA also sits.
Despite the daily bounce, the Nasdaq 100 remains under pressure in the very near term and faces the immediate support at the February low at 11900 (February 24), which is also reinforced by the key 200-day SMA at 11903. The breakdown of this region could open the door to a deeper decline to weekly lows at 11550 (January 25) and 11251 (January 19) ahead of the January low at 10696 (January 6) and the December 2022 low at 10671 (December 22). In the opposite direction, the next significant up-barrier is expected to appear at the 2023 top at 12880 (February 2) ahead of the round level at 13000 and the weekly peak at 13175 (August 26 2022). The daily RSI rebounded to the vicinity of 49.
Top Gainers: Seagen, Rivian Automotive, Enphase
Top Losers: Intuit, Walgreen Boots, PACCAR
Resistance levels: 12689 12771 12880 (4H chart)
Support levels: 11900 11550 11251 (4H chart)
DOW JONES
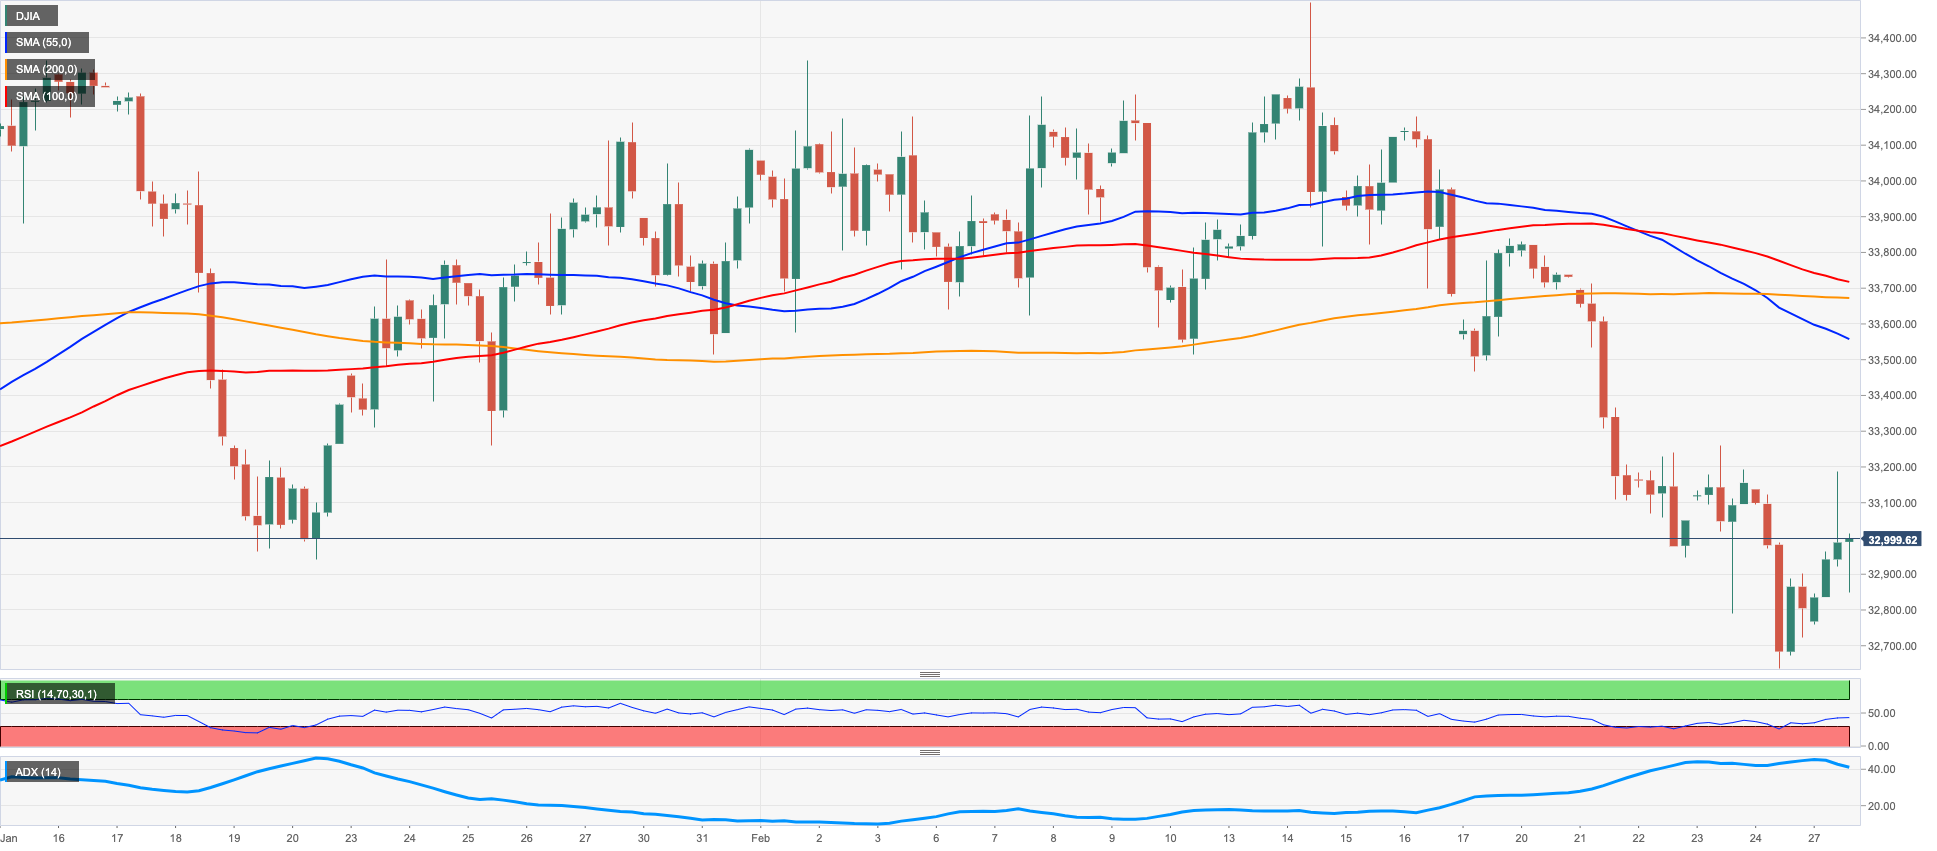
US stocks tracked by the three major indices had an auspicious start of the week and managed to partially leave behind last week’s steep retracement.
Indeed, dip buyers coupled with mixed results from the US calendar on Monday seem to have bolstered the resumption of a mild buying bias among investors, which was also propped up by the weaker dollar and the knee-jerk in US yields.
Overall, the Dow Jones gained 0.55% to 32998 the S&P500 rose 0.73% to 3999 and the tech-benchmark Nasdaq Composite advanced 0.78% to 11484.
A deeper drop from the 2023 low at 32643 (February 24) should force the Dow to quickly revisit the December 2022 low at 32573 (December 22) ahead of the key 200-day SMA at 32350. Just the opposite, the next up barrier aligns at the provisional 55-day SMA at 33573 prior to the 2023 top at 34342 (January 13) and the December 2022 peak at 34712 (December 13). If the index breaks above this level, it could then challenge the April 2022 high at 35492 (April 21) ahead of the February 2022 top at 35824 (February 9). The daily RSI regained some balance and advanced past 38.
Top Performers: Caterpillar, Boeing, JPMorgan
Worst Performers: Walmart, Merck&Co, American Express
Resistance levels: 33272 33685 34334 (4H chart)
Support levels: 32643 32573 31727 (4H chart)
MACROECONOMIC EVENTS

All Information & Updates provided by:

All information relating to the financial markets available on this page has been prepared and issued by FXStreet (Forexstreet SL, Spain, Reg: B62498233) on the basis of publicly available information and all information believed to be reliable and does not conflict with Kuwaiti local laws, and all necessary care has been taken to before the company to ensure that the facts mentioned are correct from the source.
NCM Investment nor any of its directors or employees shall in any way be held responsible for the contents of this news, and the information contained on this page is intended only to provide clients with publicly available information and should not be construed as investment advice, report or analysis and/or constitute an offer or invitation to buy or sell financial instruments of any kind.
RISK WARNING: Forex and CFDs are highly risky leveraged products, as losses can exceed deposits. Please ensure you understand all the risks and take independent advice if necessary. NCM will segregate the clients based on the criteria of the regulator and its bylaws. NCM does not provide any advisory service; the material published does not constitute advice or a recommendation for a transaction in any financial instrument. NCM accepts no responsibility for any use of the content presented and any consequences of that use. Anyone acting on the information provided does so at their own risk.