
- Contact Us:
-

-

-

-


Daily Market Updates
01 Mar 2023
USDJPY
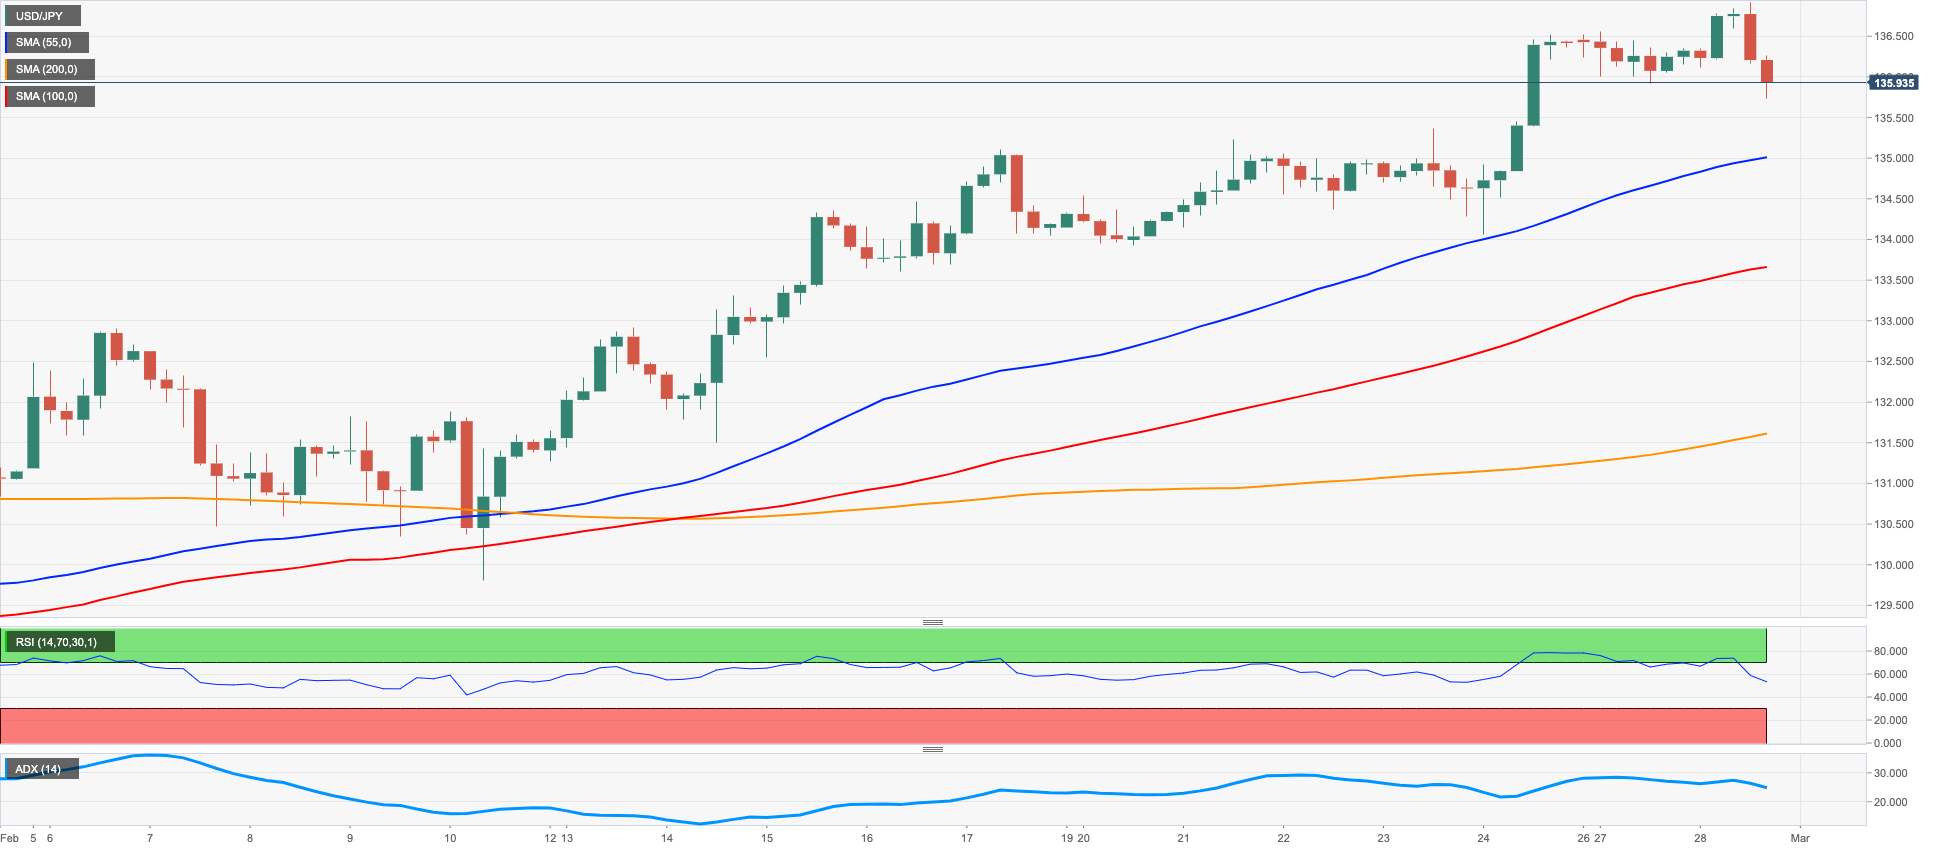
USD/JPY quickly faded a bullish move to the proximity of the key 137.00 mark on Tuesday, an area where the 100- and the 200-day SMA also converge.
The bid stance in the dollar could not prevent the pair from reversing the initial uptick, nor could the continuation of the upside momentum in US yields across the curve.
From the BoJ, Deputy Governor Nominee Uchida reiterated inflation is expected to fall below the 2% target by the middle of FY2023. Uchida also advocated for the continuation of the current ultra-accommodative monetary stance to support the economy for the time being.
In Japan, the JGB 10-year yields remained within the multi-week consolidative theme around the 0.50% level.
In the calendar, January readings saw the advanced Industrial Production expected to contract 3.1% from a year earlier, Retail Sales expand 6.3% over the last twelve months and Housing Starts increase 6.6% YoY.
USD/JPY keeps the march north unabated so far. The 2023 peak at 136.90 (February 28) precedes the key 200-day SMA at 137.16 ahead of weekly highs at 138.17 (December 15 2022) and 139.89 (November 30 2022), all prior to the key round level at 140.00. On the flip side, the 134.05 level (February 24) should offer minor contention prior to the provisional 55-day SMA at 132.19 and the weekly low at 129.79 (February 10). South from here the February low at 128.08 (February 2) seconded by the 2023 low at 127.21 (January 16) and the May 2022 low at 126.36 (May 24). The daily RSI receded to the 65 region.
Resistance levels: 136.91 137.47 138.17 (4H chart)
Support levels: 135.73 134.05 132.82 (4H chart)
GBPUSD
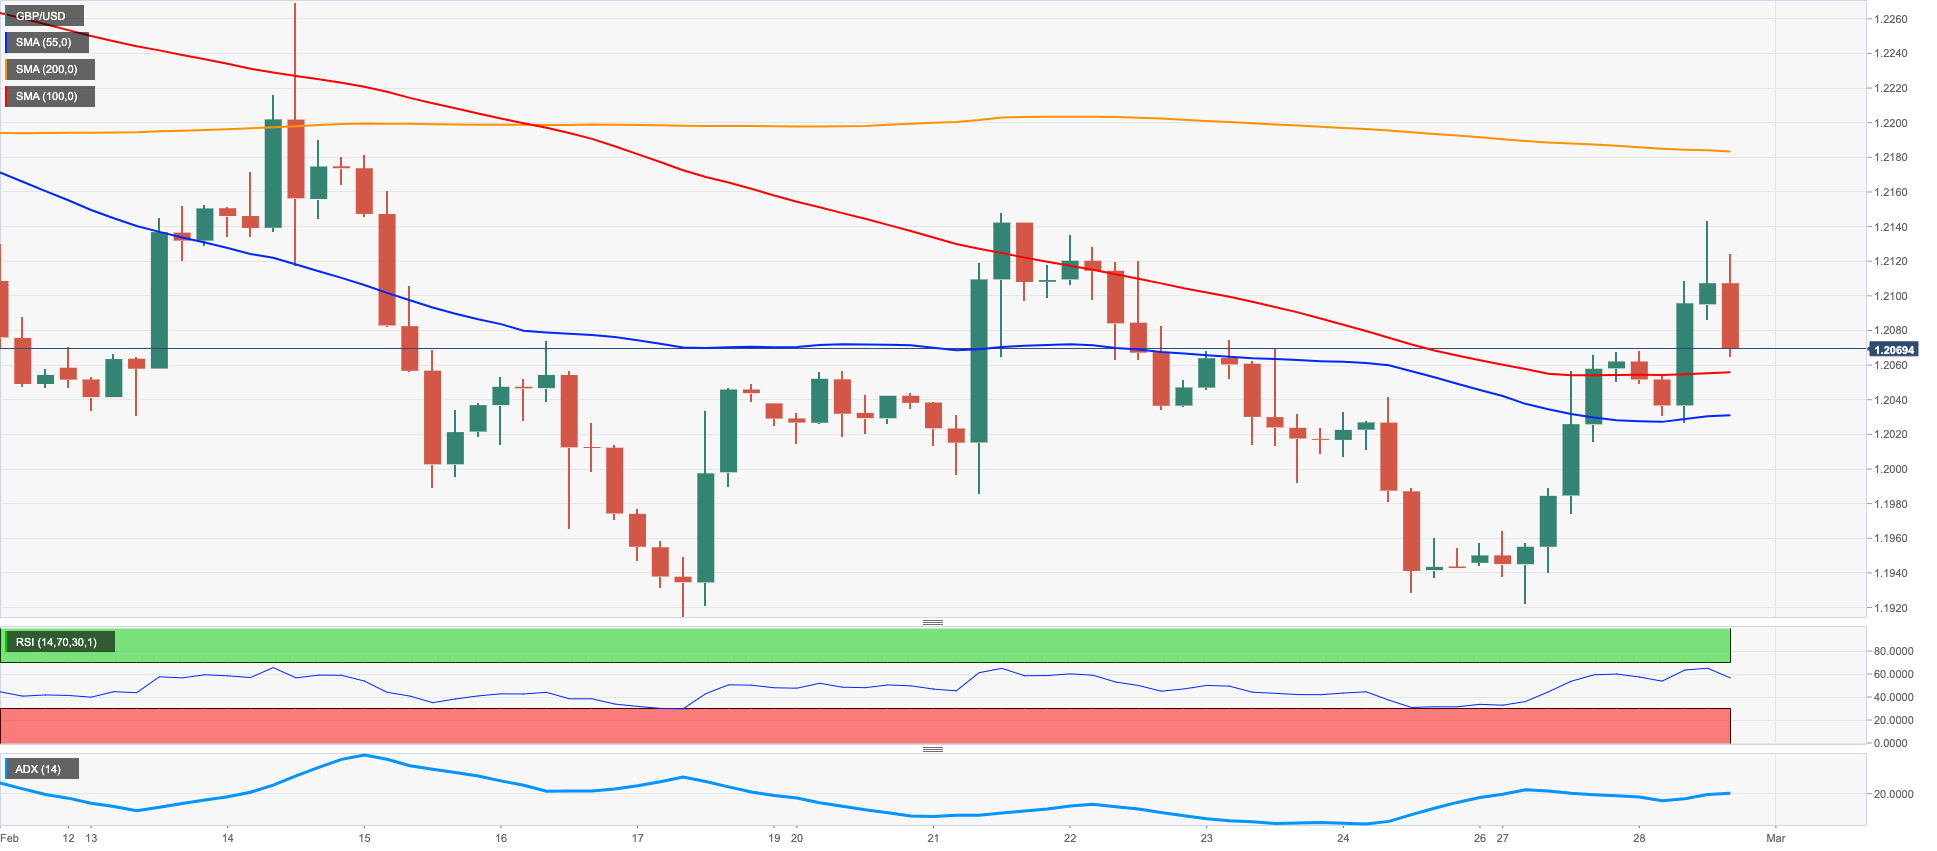
GBP/USD failed to extend the early move north of the 1.2100 mark, coming all the way down to revisit the area of Monday’s close near 1.2060 on Tuesday.
Cable’s price action remained flat towards the end of the session in response to the pick-up in momentum in the greenback, which motivated the USD Index (DXY) to revisit the upper 1104.00s on the back of the resumption of the bid bias in US yields.
In the UK money market, the march north in 10-year Gilt yields remained unabated and gradually approached the key 4.0% level.
The inactivity in the UK docket on Tuesday left all the attention to Wednesday’s release of house prices tracked by Nationwide, Mortgage Approvals, the final Manufacturing PMI and the speech by BoE Governor A.Bailey.
Next on the upside for GBP/USD appears the weekly top at 1.2147 (February 21). This level remains underpinned by the temporary 55-day SMA at 1.2149 and precedes the weekly peak at 1.2269 (February 14) and the 2023 high at 1.2447 (January 23). Once the latter is cleared, the pair could confront the May 2022 top at 1.2666 (May 27) ahead of the 200-week SMA at 1.2881 and the psychological 1.3000 mark. By contrast, the 1.1920 area is expected to offer initial contention, where the weekly low at 1.1922 (February 27) and the 200-day SMA (1.1923) both converge. The loss of this area could put the February low at 1.1914 (February 17) to the test before the 2023 low at 1.1841 (January 6) and the November 2022 low at 1.1142 (November 4). The daily RSI remained flat just above 47.
Resistance levels: 1.2143 1.2183 1.2269 (4H chart)
Support levels: 1.1922 1.1914 1.1841 (4H chart)
AUDUSD
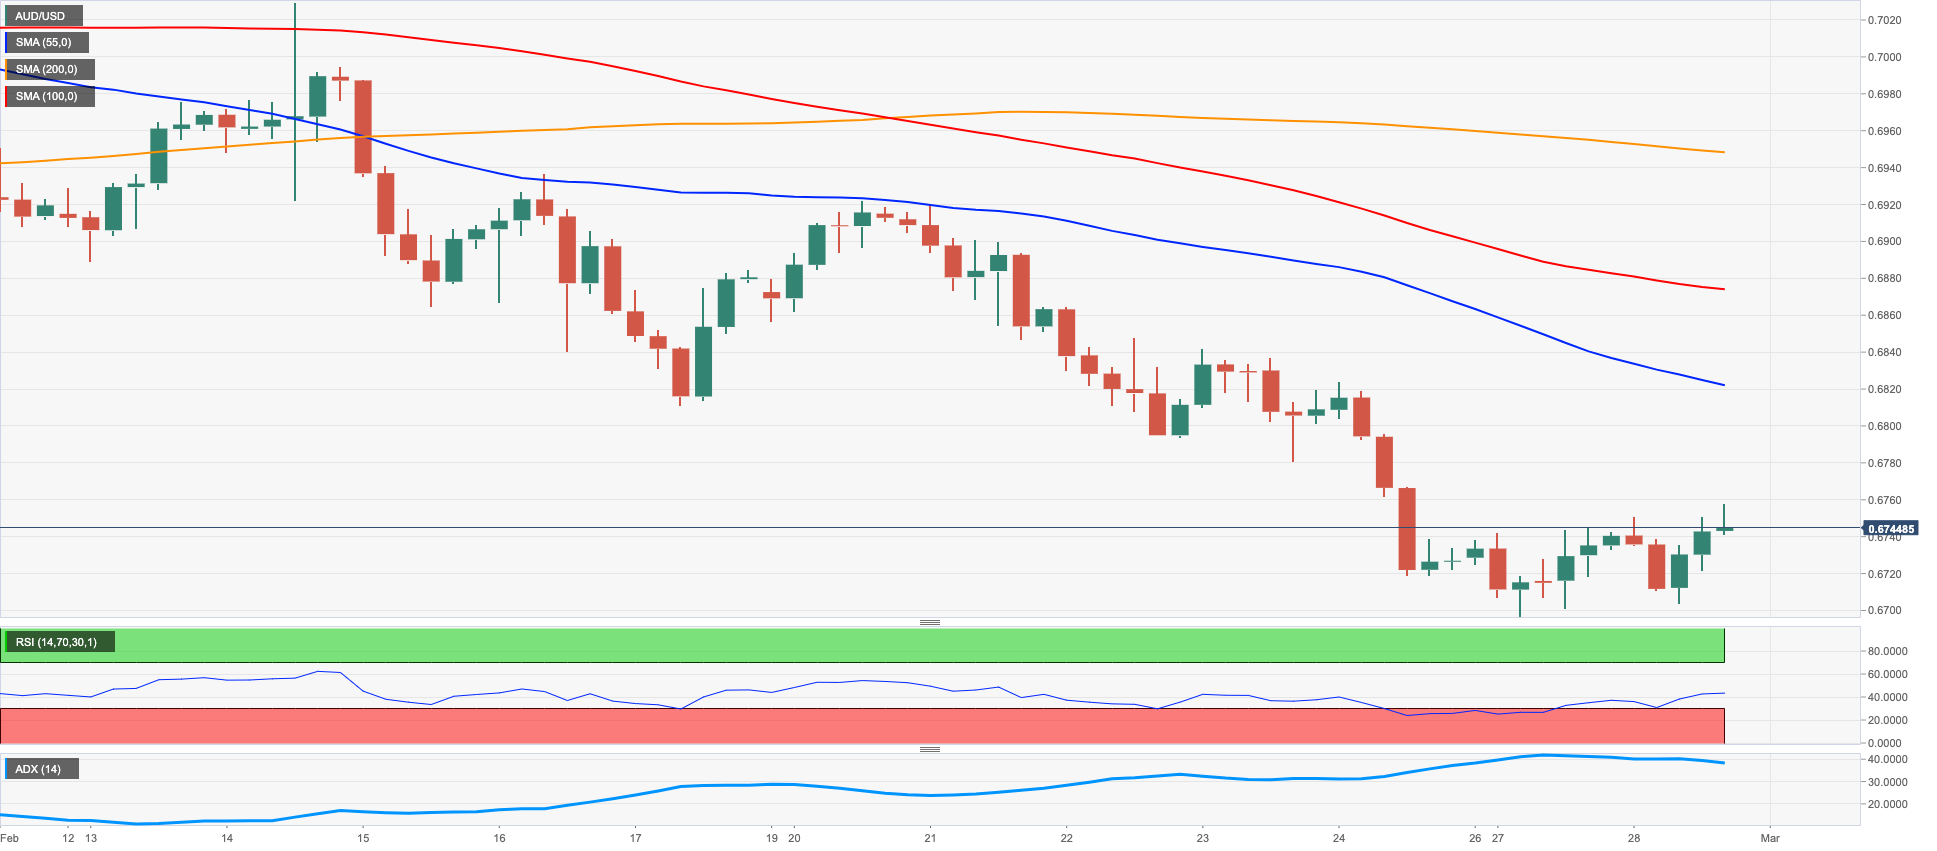
AUD/USD kept the volatility well in place for the second session in a row and hovered around Monday’s closing levels near 0.6740 on turnaround Tuesday.
Indeed, the Aussie dollar suffered the upside pressure around the greenback, while the broad-based upbeat sentiment in the commodity universe appears to have put a floor to occasional bouts of weakness in the pair.
In the calendar, Housing Credit expanded at a monthly 0.3% in January, while flash Retail Sales are expected to have expanded 1.9% MoM also in January.
AUD/USD faces immediate contention at the February low at 0.6698 (February 27) prior to the 2023 low at 0.6688 (January 3). Once this level is breached, the pair could put the December 2022 low at 0.6629 (December 20) to the test ahead of the weekly low at 0.6584 (November 21 2022). In the opposite direction, the key 200-day SMA at 0.6795 emerges as the next hurdle of note ahead of the interim 55-day SMA at 0.6878 and the weekly top at 0.6920 (February 20). The breakout of this level could prompt the weekly peak at 0.7029 (February 14) tom emerge on the horizon prior to the 2023 high at 0.7157 (February 2) and the round level at 0.7200, which precedes the June 2022 top at 0.7282 (June 3). The daily RSI improved marginally past the 36 level.
Resistance levels: 0.6757 0.6848 0.6920 (4H chart)
Support levels: 0.6698 0.6688 0.6650 (4H chart)
GOLD
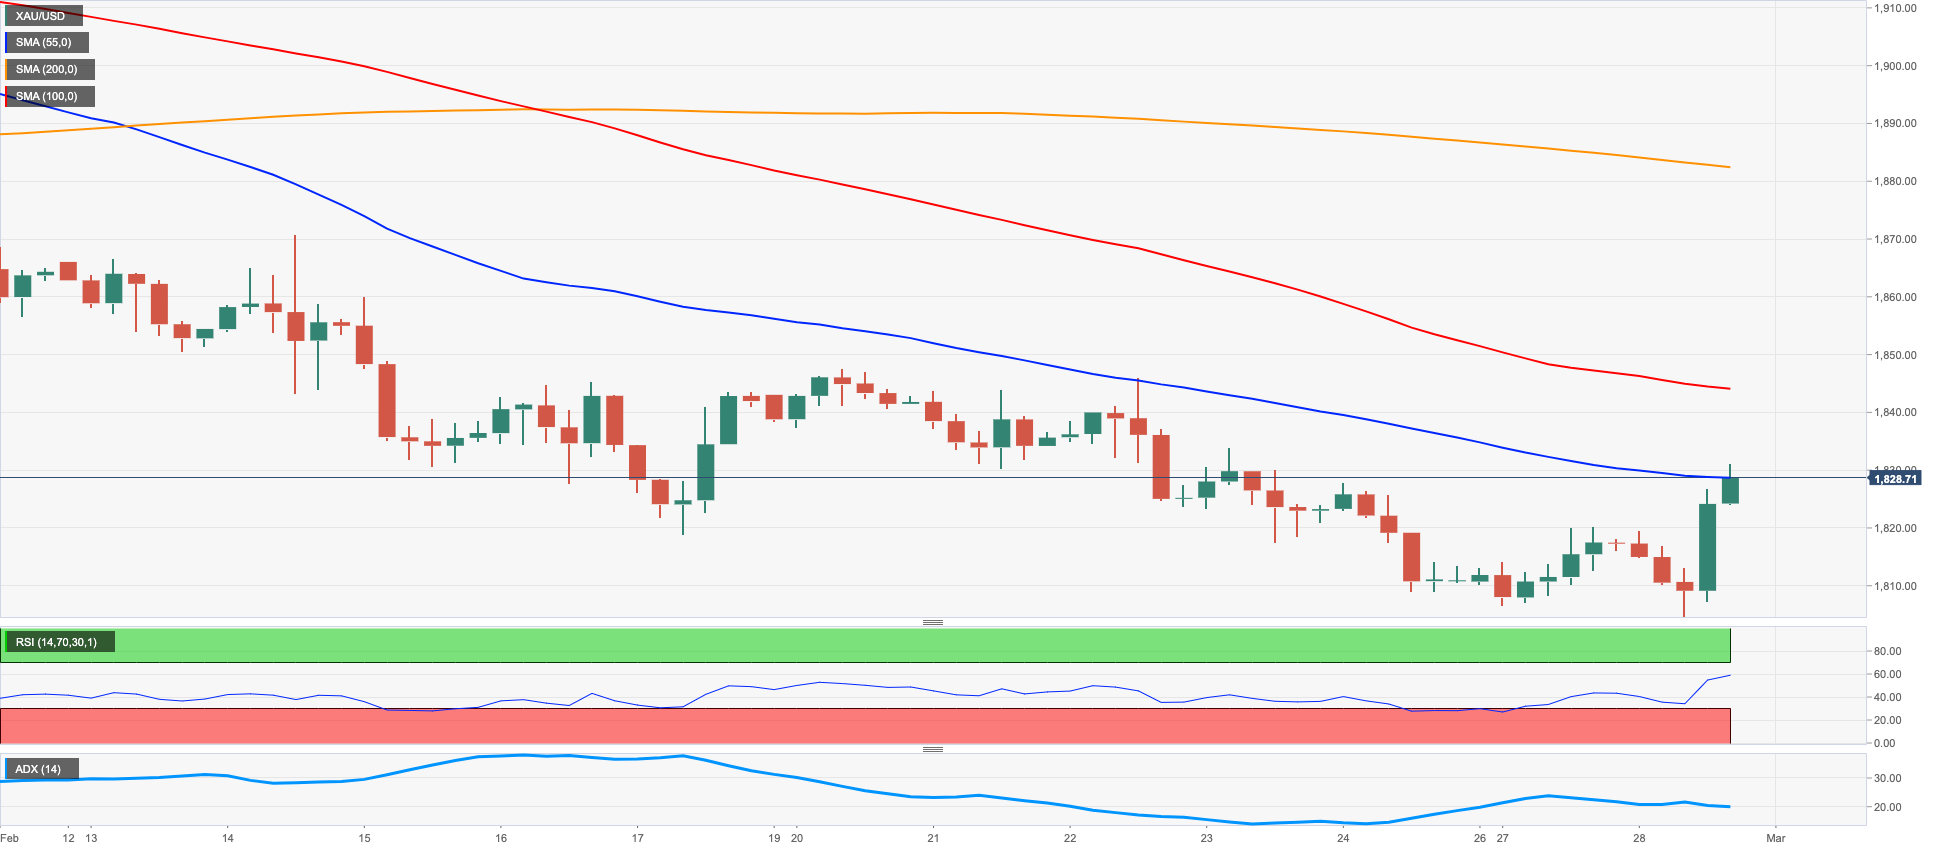
Prices of the ounce troy of gold added to the optimistic start of the week and advanced to 3-day highs around the $1830 region on Tuesday.
The unconvincing price action around the greenback in combination with the disheartening prints from the US Consumer Confidence gauged by the Conference Board seem to have lent renewed wings to the precious metal.
The marked uptick in bullion, in addition, came despite another improvement – albeit small – in US yields across the curve.
Further recovery in gold prices retargets the provisional 55-day SMA at $1859 ahead of the weekly high at $1890 (February 9) before the 2023 top at $1959 (February 2). The surpass of the latter could pave the way for a probable move to the April 2022 peak at $1998 (April 18) closely followed by the psychological $2000 level and the 2022 high at $2070 (March 8). Having said that, the resumption of the selling bias exposes another drop to the 2023 low at $1806 (February 27) just ahead of the key $1800 zone and prior to the temporary 100-day SMA at $1792 and the key 200-day SMA at $1776. Further weakness could see the weekly low at $1727 (November 23) revisited before the November 2022 low at $1616 (November 3).
Resistance levels: $1831 $1846 $1870 (4H chart)
Support levels: $1806 $1797 $1784 (4H chart)
CRUDE WTI
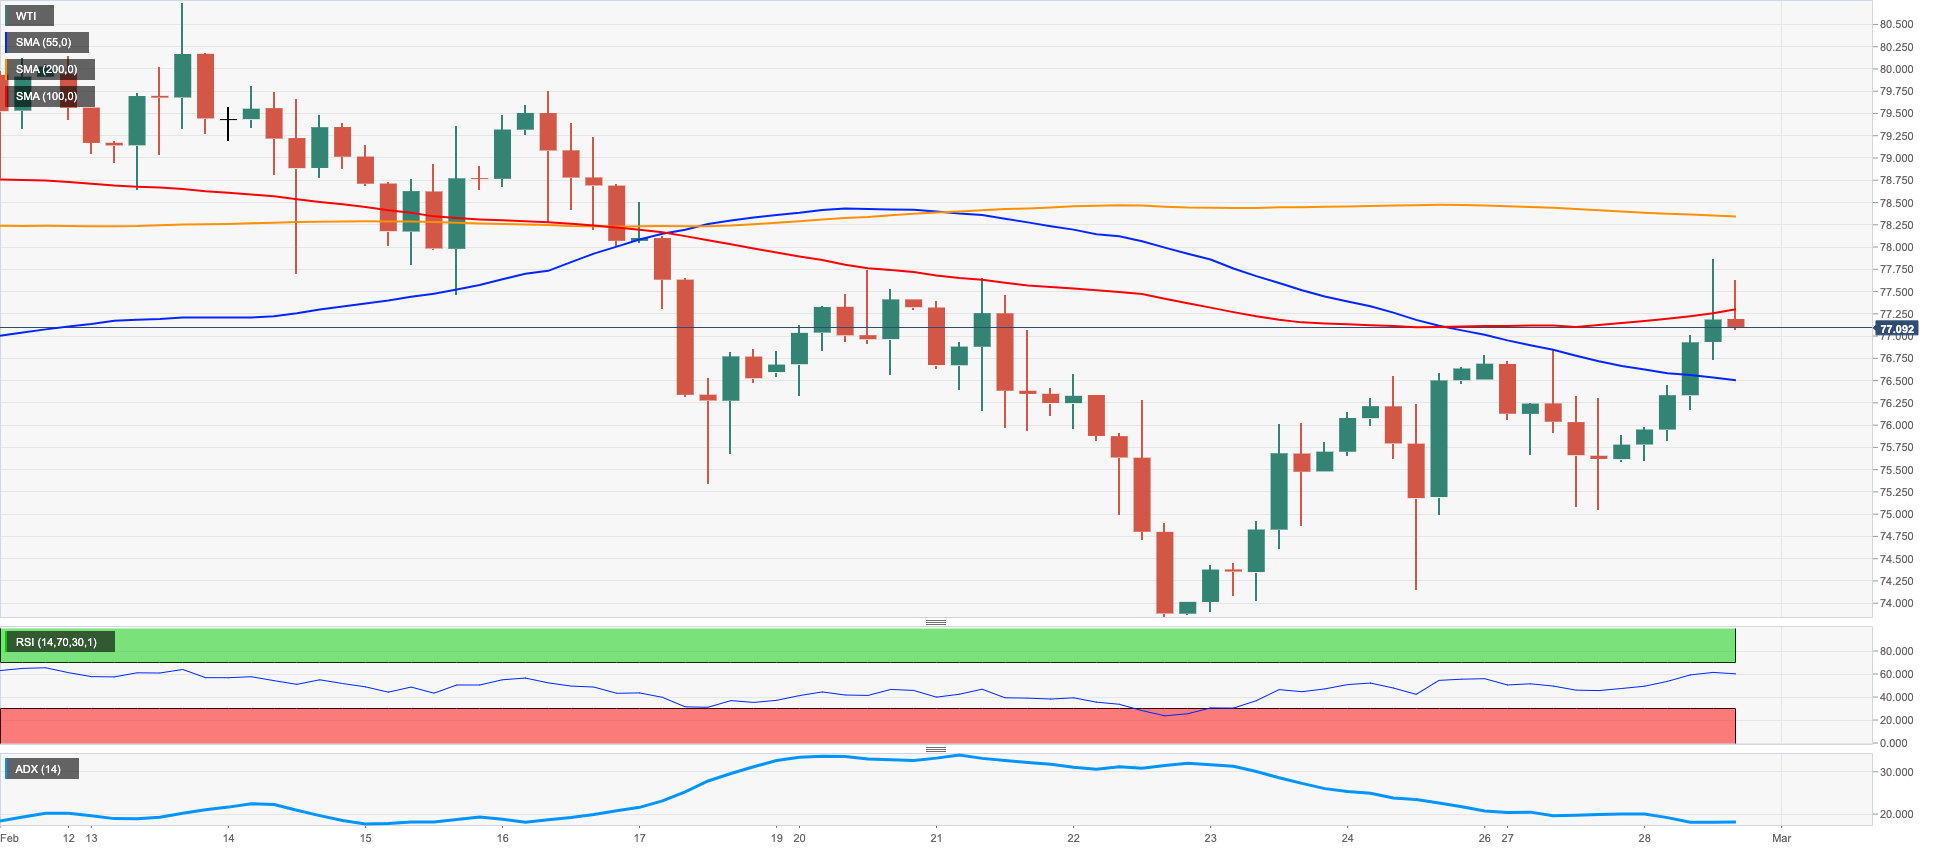
Prices of the barrel of the West Texas Intermediate (WTI) quickly left behind Monday’s negative price action and advanced to multi-session peaks just below the $78.00 mark on Tuesday, flirting at the same time with the temporary 55-day SMA.
This time, traders pushed harder on the back of firm hopes that the rebound in the Chinese economic activity – mainly stemming from the current post-COVID reopening – could underpin the demand for the commodity.
hopes of a stronger demand at the same time eclipsed persevering concerns over a potential global slowdown in response to the continuation of the tightening cycle by major central banks in key economies.
Later in the session, the API will report on the weekly US crude oil inventories in the week to February 24.
The ongoing choppiness in WTI is seen unchanged for the time being. Further gains, in the meantime, are expected to confront the February high at $80.57 (February 13) seconded by the 2023 top at $82.60 (January 23) and the December 2022 peak at $83.32 (December 1). Further up comes the $90.08 level (November 11 2022) prior to the November 2022 high at $93.73 (November 7). On the opposite side, if the WTI breaks below the weekly low at $73.83 (February 22) it could motivate the 2023 low at $72.30 (February 6) to emerge on the horizon before the 2022 low at $70.10 (December 9) and the key round level at $70.00.
Resistance levels: $77.79 $78.18 $79.50 (4H chart)
Support levels: $75.00 $74.06 $72.22 (4H chart)
GER40
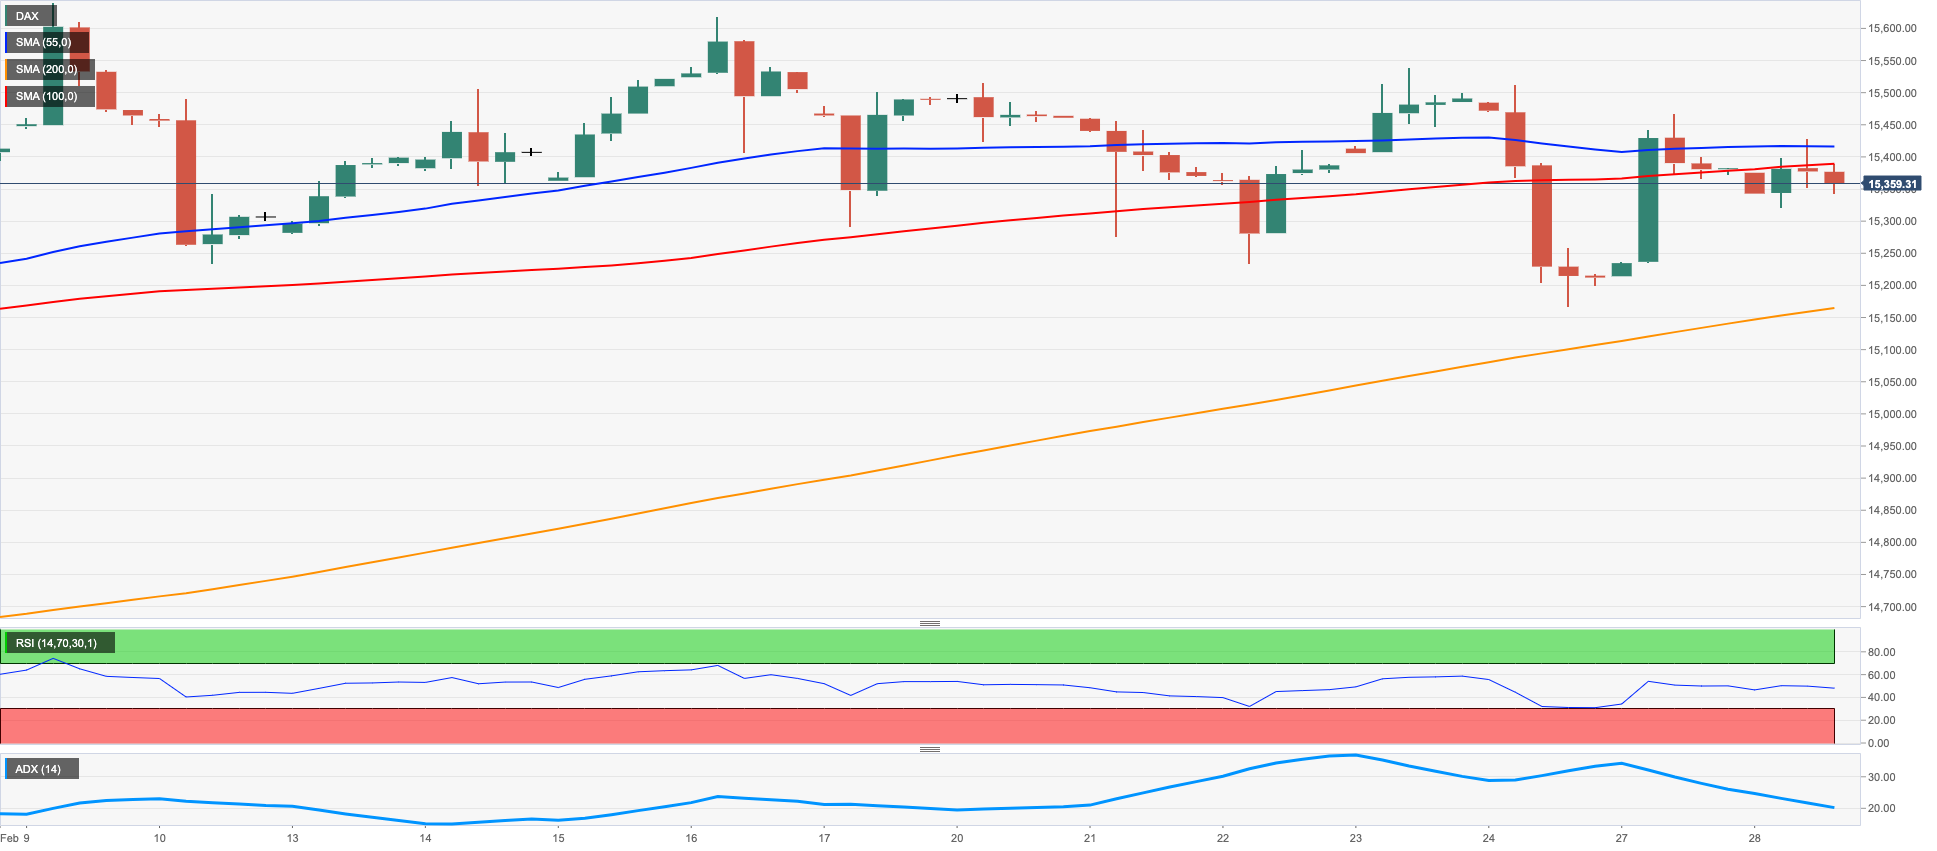
The German stock benchmark DAX40 retreated marginally and kept the monthly consolidative phase well in place for yet another session on Tuesday.
Indeed, European equities traded mostly on the defensive – Spain and the UK were the exceptions – on the back of rising concerns over the continuation of the hiking cycle by the ECB, which has already well telegraphed a 50 bps rate hike at the March gathering.
In fact, those fears were exacerbated after advanced inflation figures in France and Spain surprised investors to the upside for the month of February, suggesting that the work by the ECB – via interest rate hikes – appears far from over.
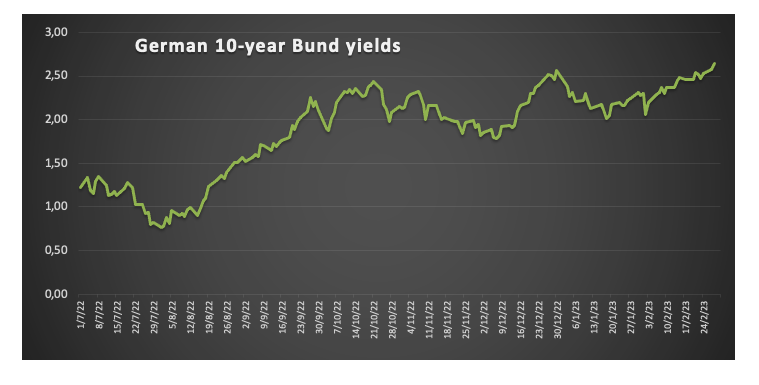
The small downtick in the German index was accompanied by the surpass of the 2.70% level by the 10-year Bund yields for the first time since July 2011.
Data wise in Germany, Import Prices contracted at a monthly 1.2% in January and expanded 6.6% over the last twelve months.
The range bound theme in the DAX40 looks unaltered for the time being. That said, a drop below the weekly low at 15162 (February 24) could lead to a visit to another weekly low at 14906 (January 19) ahead of the interim 55-day SMA at 14878 and the December 2022 low at 13791 (December 20). South from here appears the key 200-day SMA at 13775. Just the opposite, the next hurdle emerges at the 2023 peak at 15658 (February 9) seconded by the February 2022 high at 15736 (February 2 2022). The surpass of the latter could put a probable move to the round level at 16000 on the radar before the 2022 top at 16285 (January 5). The daily RSI eased a tad to the vicinity of 54.
Best Performers: Commerzbank, Adidas, Deutsche Bank AG
Worst Performers: Bayer, Sartorius AG VZO, Fresenius Medical Care KGAA ST
Resistance levels: 15552 15634 15658 (4H chart)
Support levels: 15162 14906 14766 (4H chart)
NASDAQ
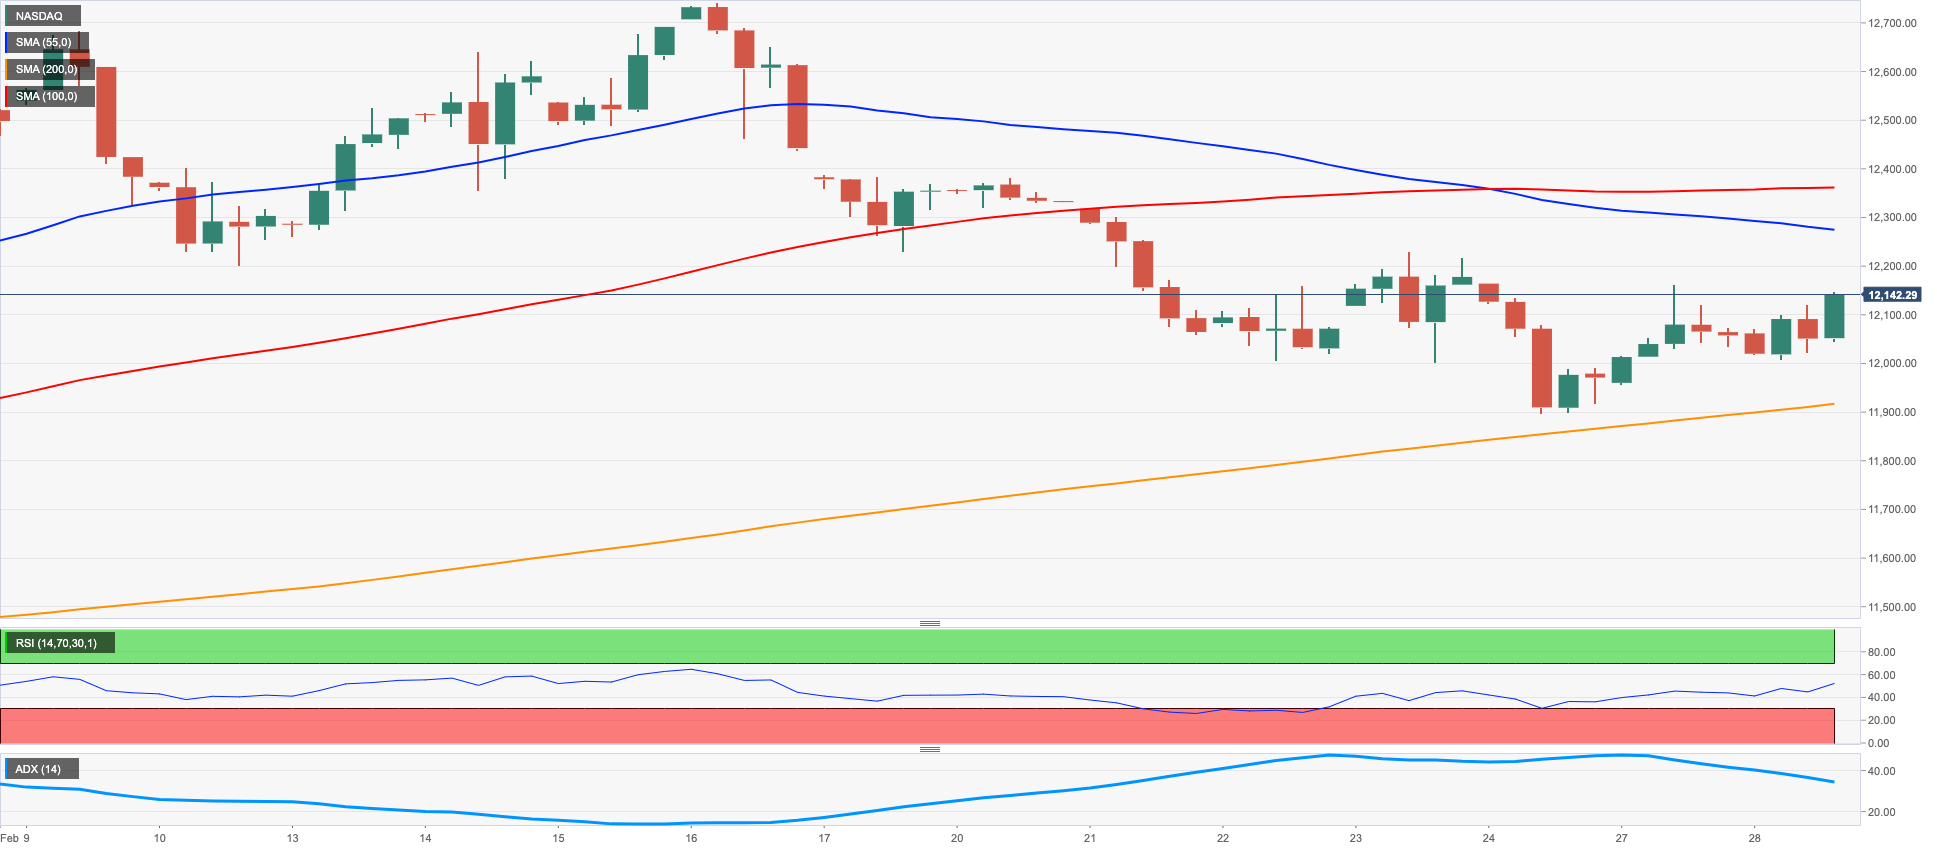
US tech equities gauged by the Nasdaq 100 added to Monday’s advance and charted marked gains beyond the 12100 mark on Tuesday.
In fact, month-end flows and the vacillating mood around the greenback sponsored the second consecutive daily gain in the index, while higher yield appear to have trimmed the upside potential.
In case bears regain the initiative, the Nasdaq 100 should meet the next contention of note at the February low at 11900 (February 24), which remains propped up by the key 200-day SMA at 11904. The breach of the latter could spark extra losses to weekly lows at 11550 (January 25) and 11251 (January 19) prior to the January low at 10696 (January 6) and the December 2022 low at 10671 (December 22). On the other hand, there are no resistance levels of note before the 2023 peak at 12880 (February 2) seconded by the round level at 13000 and the weekly high at 13175 (August 26 2022). The daily RSI bounced past the 50 yardstick.
Top Gainers: Rivian Automotive, Applied Materials, Lucid Group
Top Losers: Warner Bros Discovery, Constellation Energy, Charter Communications Inc
Resistance levels: 12227 12689 12880 (4H chart)
Support levels: 11900 11550 11251 (4H chart)
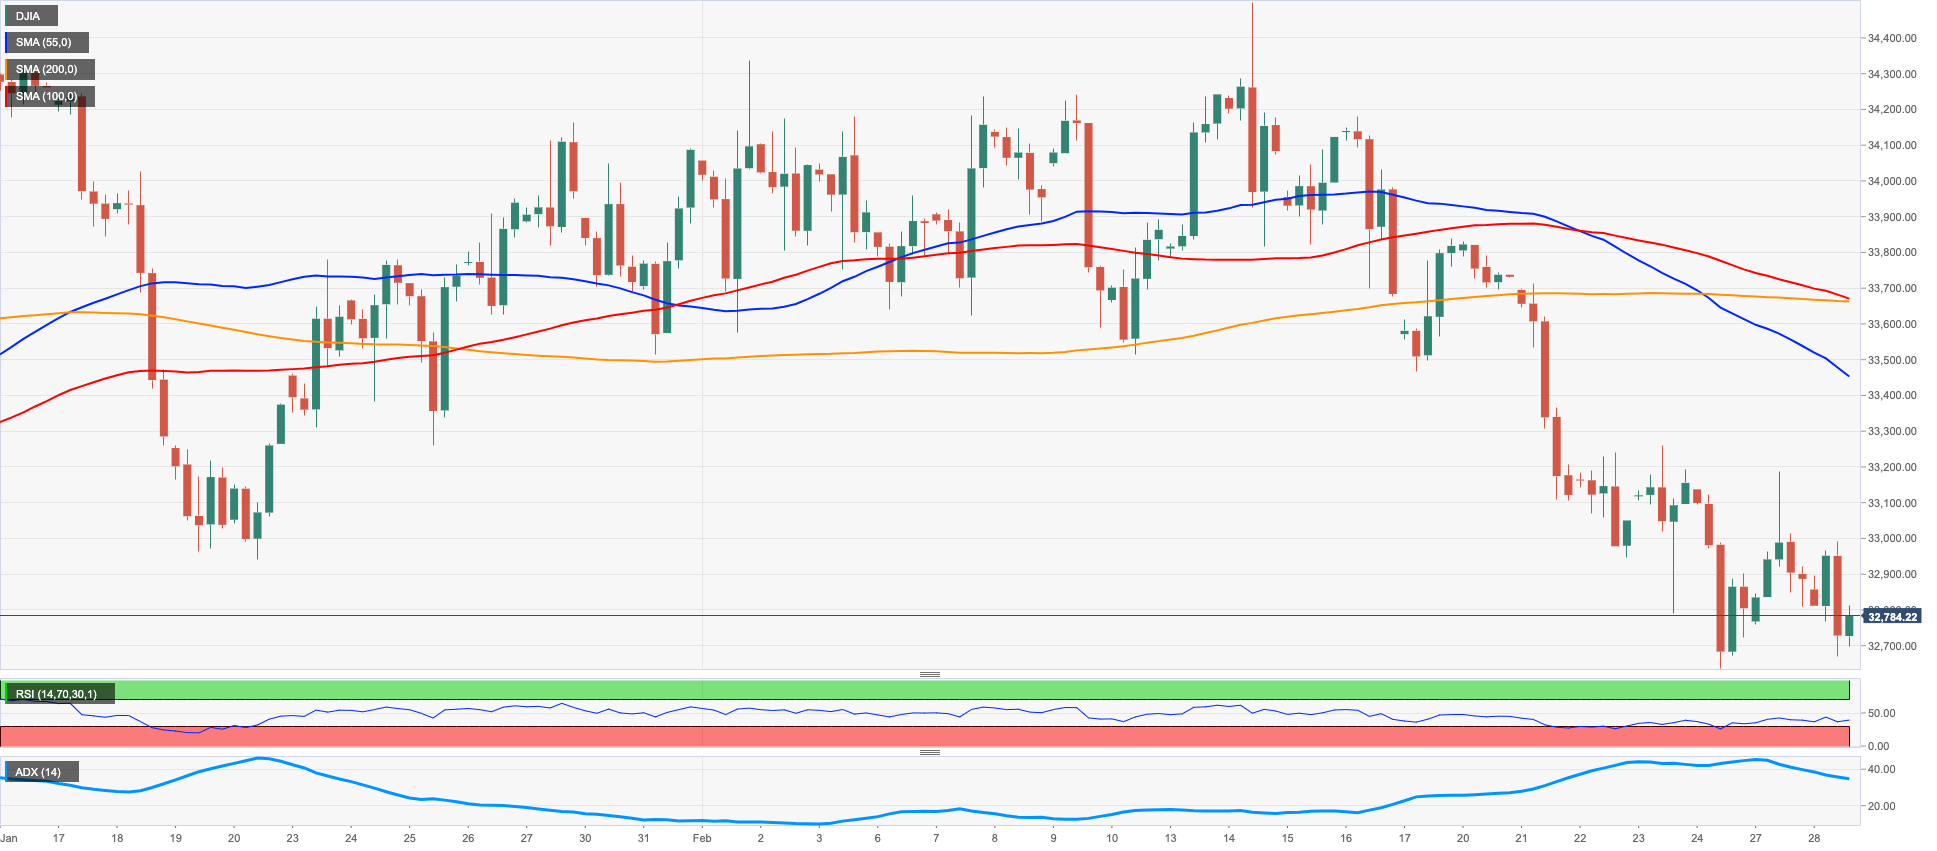
DOW JONES
US equities measured by the Dow Jones retreated modestly in the last session of the month, recording at the same time the first monthly drop of the year following a promising start of 2023.
Recession concerns underpinned by the Fed’s tighter-for-longer narrative were once again doing the rounds among market participants and kept the sentiment depressed on turnaround Tuesday.
All in all, the Dow Jones retreated 0.30% to 32789 the S&P500 gained 0.30% to 3994 and the tech-heavy Nasdaq Composite rose 0.60% to 11535.
The breakdown of the 2023 low at 32643 (February 24) could open the door to a visit to the December 2022 low at 32573 (December 22) prior to the key 200-day SMA at 32354. For all that, occasional bullish attempts in the Down are seen facing the immediate hurdle at the interim 55-day SMA at 33558 ahead of the 2023 peak at 34342 (January 13) and the December 2022 high at 34712 (December 13). North from here emerges the April 2022 top at 35492 (April 21) seconded by the February 2022 peak at 35824 (February 9). The daily RSI grinded lower and broke below the 37 zone
Top Performers: Nike, American Express, Walgreen Boots
Worst Performers: Goldman Sachs, Merck&Co, UnitedHealth
Resistance levels: 33272 33685 34334 (4H chart)
Support levels: 32643 32573 31727 (4H chart)
MACROECONOMIC EVENTS

All Information & Updates provided by:

All information relating to the financial markets available on this page has been prepared and issued by FXStreet (Forexstreet SL, Spain, Reg: B62498233) on the basis of publicly available information and all information believed to be reliable and does not conflict with Kuwaiti local laws, and all necessary care has been taken to before the company to ensure that the facts mentioned are correct from the source.
NCM Investment nor any of its directors or employees shall in any way be held responsible for the contents of this news, and the information contained on this page is intended only to provide clients with publicly available information and should not be construed as investment advice, report or analysis and/or constitute an offer or invitation to buy or sell financial instruments of any kind.
RISK WARNING: Forex and CFDs are highly risky leveraged products, as losses can exceed deposits. Please ensure you understand all the risks and take independent advice if necessary. NCM will segregate the clients based on the criteria of the regulator and its bylaws. NCM does not provide any advisory service; the material published does not constitute advice or a recommendation for a transaction in any financial instrument. NCM accepts no responsibility for any use of the content presented and any consequences of that use. Anyone acting on the information provided does so at their own risk.