
- Contact Us:
-

-

-

-


Daily Market Updates
02 Mar 2023
USDJPY
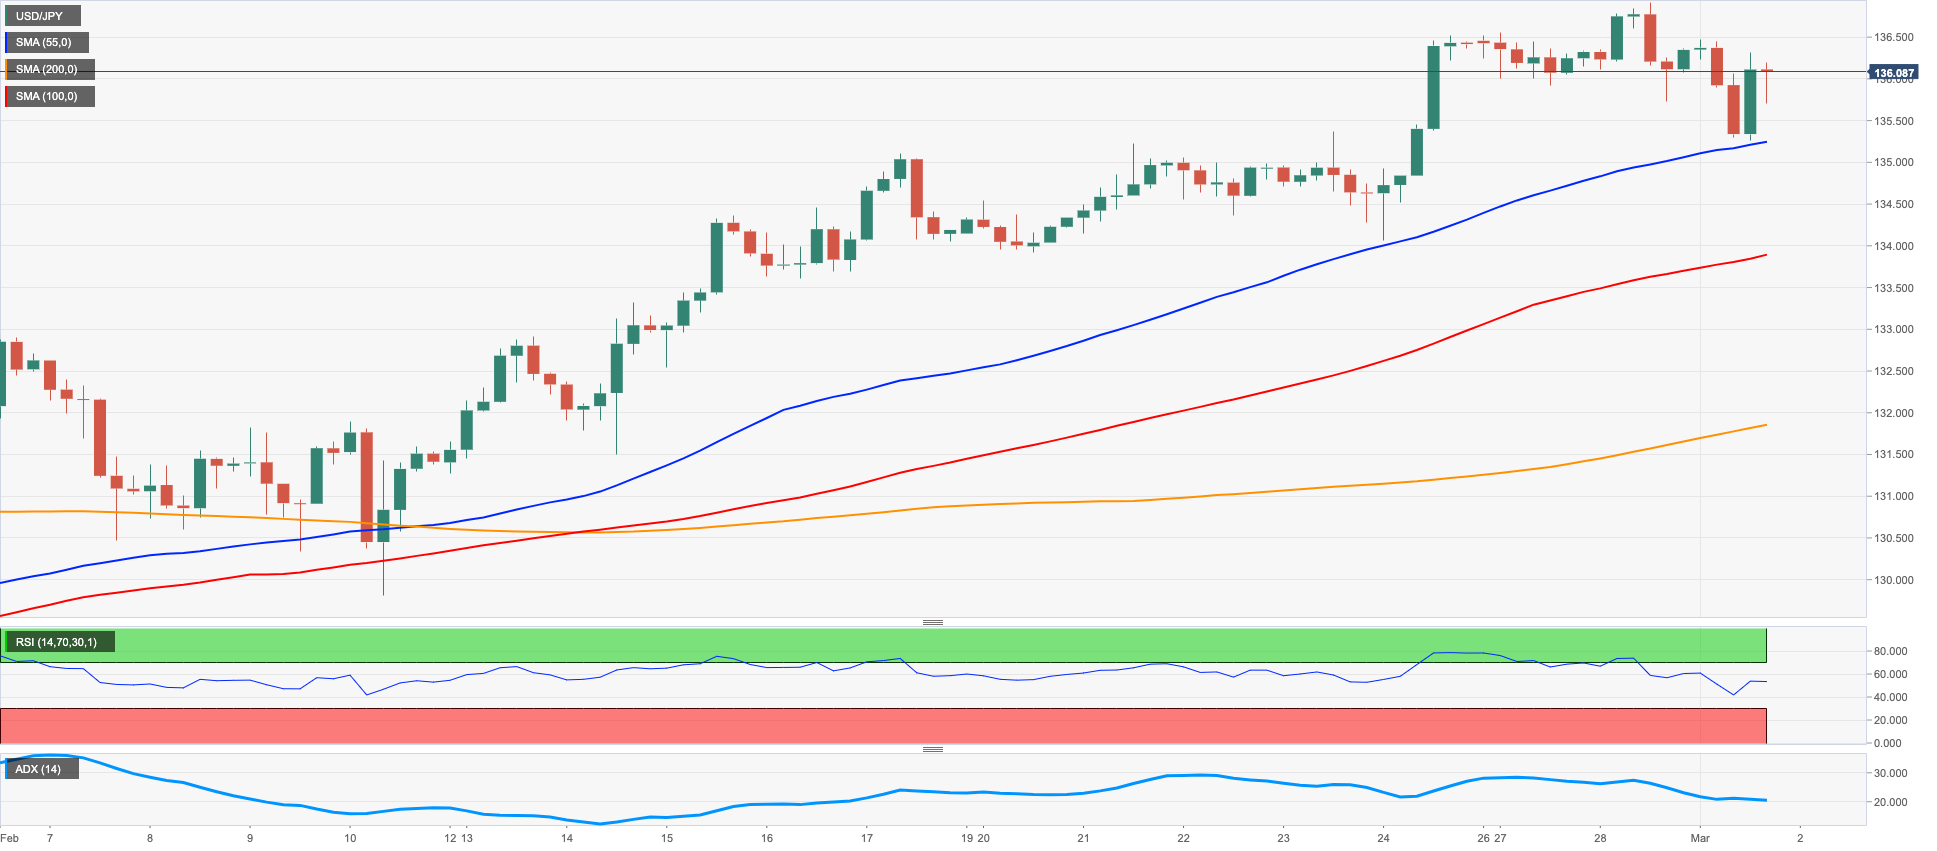
USD/JPY dropped to 3-day lows near the 135.20 region on the back of the persistent selling pressure hurting the greenback and amidst the strong pick-up in the risk appetite trends. The pair, however, was able to made a U-turn and reverse that move to end Wednesday’s session around Tuesday’s closing levels.
Furthermore, the pair extended the weekly leg lower and retreated for the third consecutive session despite the relentless move higher in US yields across the curve. Speaking about yields, the range bound trade remained unchanged near 0.50% in the JGB 10-year reference bond.
News from the BoJ showed member J.Nakagawa favouring the continuation of the ultra-accommodative monetary policy stance for the time being, at the time when she acknowledged that more time is needed to assess the impact of the December widening of the YCC band.
In the Japanese docket, final Jibun Bank Manufacturing PMI ticked a tad higher to 47.7 vs. the preliminary readings for the month of February.
In case the selling bias gathers extra steam, USD/JPY could extend the decline to the 134.05 level (February 24) ahead of the temporary 55-day SMA at 132.19 and the weekly low at 129.79 (February 10). The breakdown of this level exposes a move to the February low at 128.08 (February 2) before the 2023 low at 127.21 (January 16) and the May 2022 low at 126.36 (May 24). By contrast, the 2023 high at 136.91 (February 28) comes just before the key 200-day SMA at 137.19 and prior to weekly tops at 138.17 (December 15 2022) and 139.89 (November 30 2022), all ahead of the key round level at 140.00. The daily RSI deflated slightly to the sub-67 zone.
Resistance levels: 136.91 137.47 138.17 (4H chart)
Support levels: 135.25 134.05 132.82 (4H chart)
GBPUSD
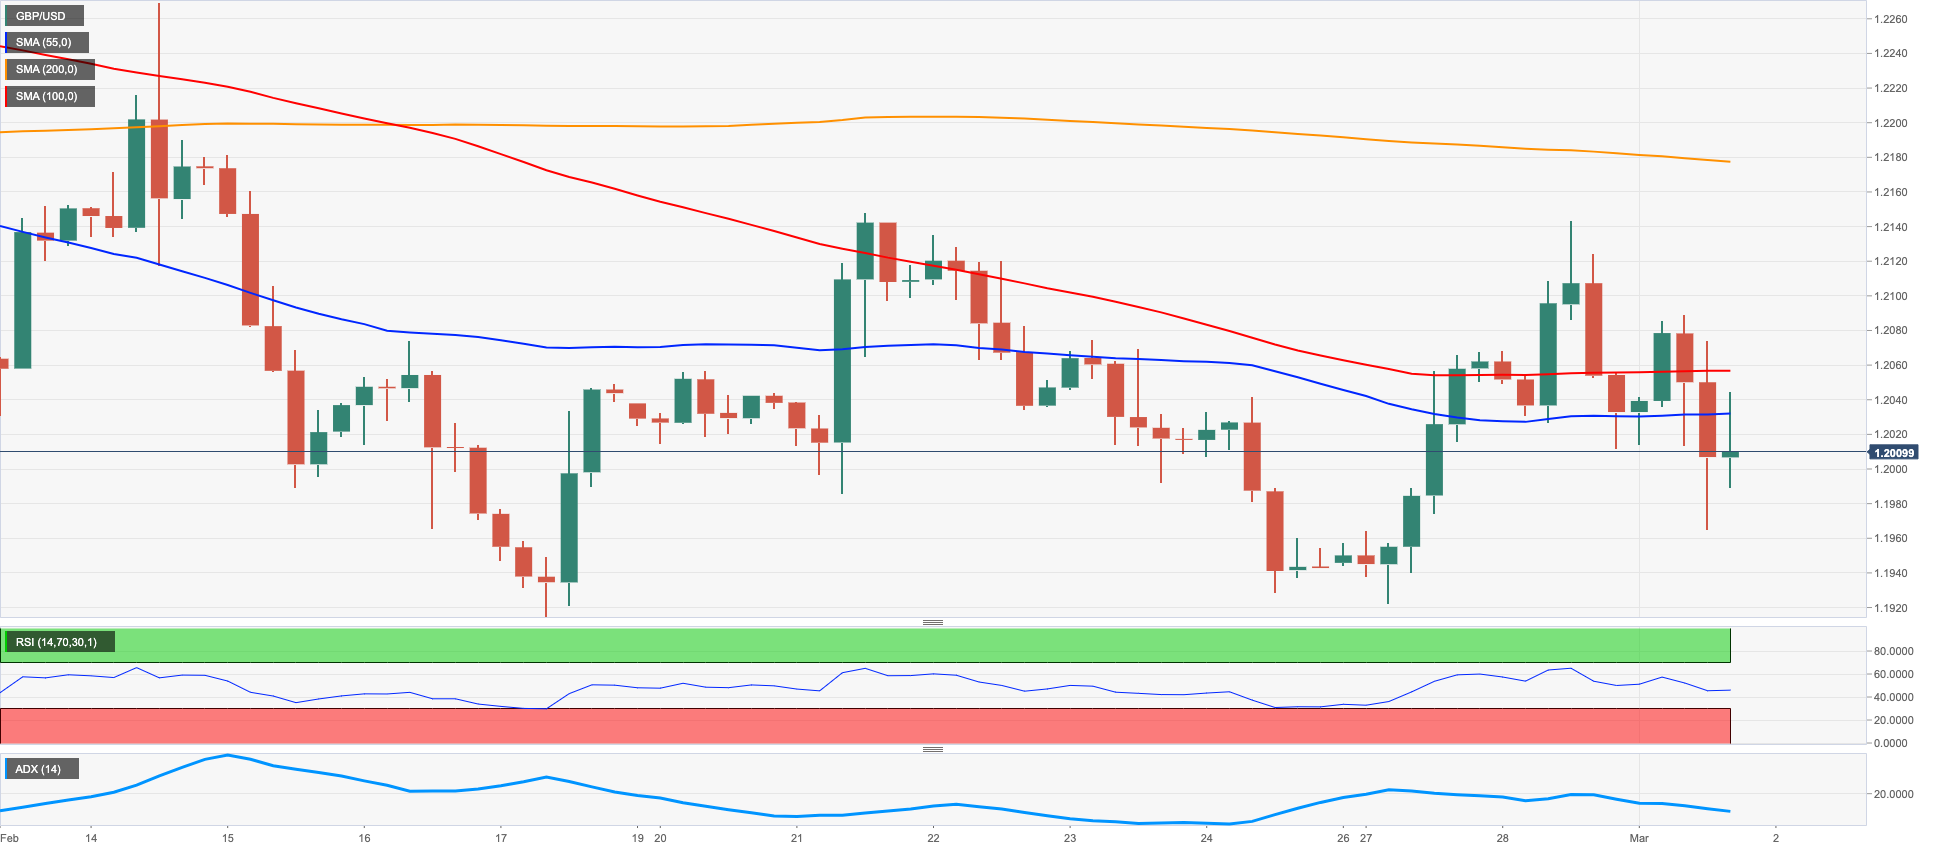
The broad-based upbeat mood in the risk-linked complex helped GBP/USD to advance to the area close to the 1.2100 region earlier in the session on Wednesday, although the bullish move lacked conviction and eventually forced the pair to return to the proximity of 1.2000, down marginally for the day.
Daily losses in the Sterling, in addition, came in line with a small decline in the 10-year Gilt yields, which seem to have taken a breather following the recent sharp advance to the 3.90% region on Tuesday, an area last seen back in October 2022.
From the BoE, Governor A.Bailey hinted at the likelihood of extra interest rate hikes, although nothing has been decided yet. He stressed that the UK labour market remains extremely constrained and reiterated that the bank needs to act decisively on rates now instead of being forced to act decisively later.
In the UK, Nationwide Housing Prices contracted 1.1% in the year to February and 0.5% vs. the previous month. In addition, Mortgage Approvals eased to 39.637K in January (from 40.54K) and the final Manufacturing PMI improved to 49.3 in February.
GBP/USD remained side-lined on Wednesday. That said, the weekly peak at 1.2147 (February 21) still appears propped up by the interim 55-day SMA (1.2140) and lies ahead of the weekly high at 1.2269 (February 14) and the 2023 top at 1.2447 (January 23). The surpass of this level could open the door to the May 2022 peak at 1.2666 (May 27) seconded by the 200-week SMA at 1.2881 and the psychological 1.3000 level. In the opposite direction, the 200-day SMA at 1.1920 precedes the weekly low at 1.1922 (February 27) just before the February low at 1.1914 (February 17). South from here turns up the 2023 low at 1.1841 (January 6) followed by the November 2022 low at 1.1142 (November 4). The daily RSI eased slightly to the area below the 45 mark.
Resistance levels: 1.2143 1.2180 1.2269 (4H chart)
Support levels: 1.2010 1.1922 1.1914 (4H chart)
AUDUSD
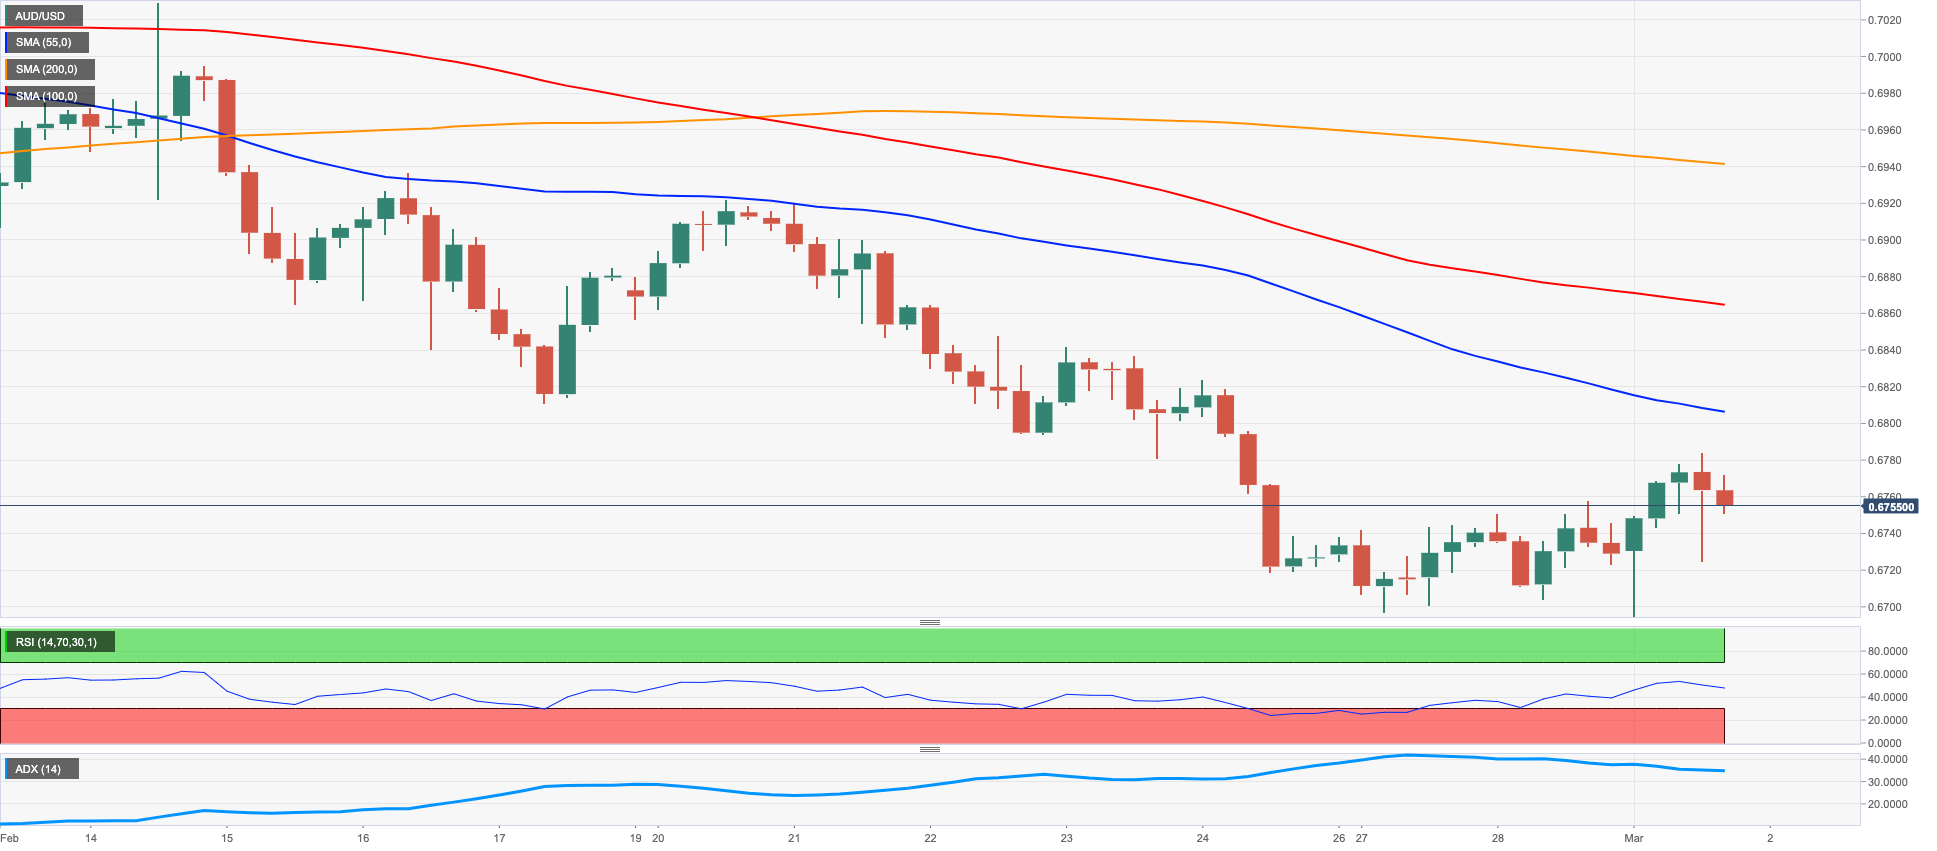
Once again, AUD/USD met strong contention in the 0.6700 neighbourhood during early trade and sparked a decent rebound to the area below the 0.6800 mark on Wednesday. The bounce, however, fizzled out afterwards and the pair kind of settled in the mid-0.6700s.
The acute pullback in the dollar in combination with a positive surprise from the Chinese docket collaborated with the resumption of the buying interest in the Aussie dollar and the risk-associated assets in general, while another session with gains in copper prices and the iron ore underpinned the daily advance in spot.
In Oz, the Ai Group Industry Index improved to -1.8 in February (from -11.6), while the GDP Growth Rate showed the economy expanded 0.5% QoQ in Q42022 and 2.7% over the last twelve months. Finally, the Monthly CPI Indicator rose 7.4% in January, down from the 8.4% gain in the previous month.
If AUD/USD manages to leave behind the current lower end of the recent range, it should face an initial up barrier at the key 200-day SMA at 0.6793 prior to the temporary 55-day SMA at 0.6875 and the weekly top at 0.6920 (February 20). Once this level is cleared, the pair could challenge the weekly high at 0.7029 (February 14) before the 2023 top at 0.7157 (February 2). North from here comes the round level at 0.7200 seconded by the June 2022 peak at 0.7282 (June 3). On the flip side, the February low at 0.6698 (February 27) is expected to offer initial support ahead of the 2023 low at 0.6688 (January 3). A deeper decline could put a probable test of the December 2022 low at 0.6629 (December 20) back on the investors’ radar before the weekly low at 0.6584 (November 21 2022). The daily RSI picked up pace and climbed above 38.
Resistance levels: 0.6783 0.6868 0.6920 (4H chart)
Support levels: 0.6698 0.6688 0.6650 (4H chart)
GOLD
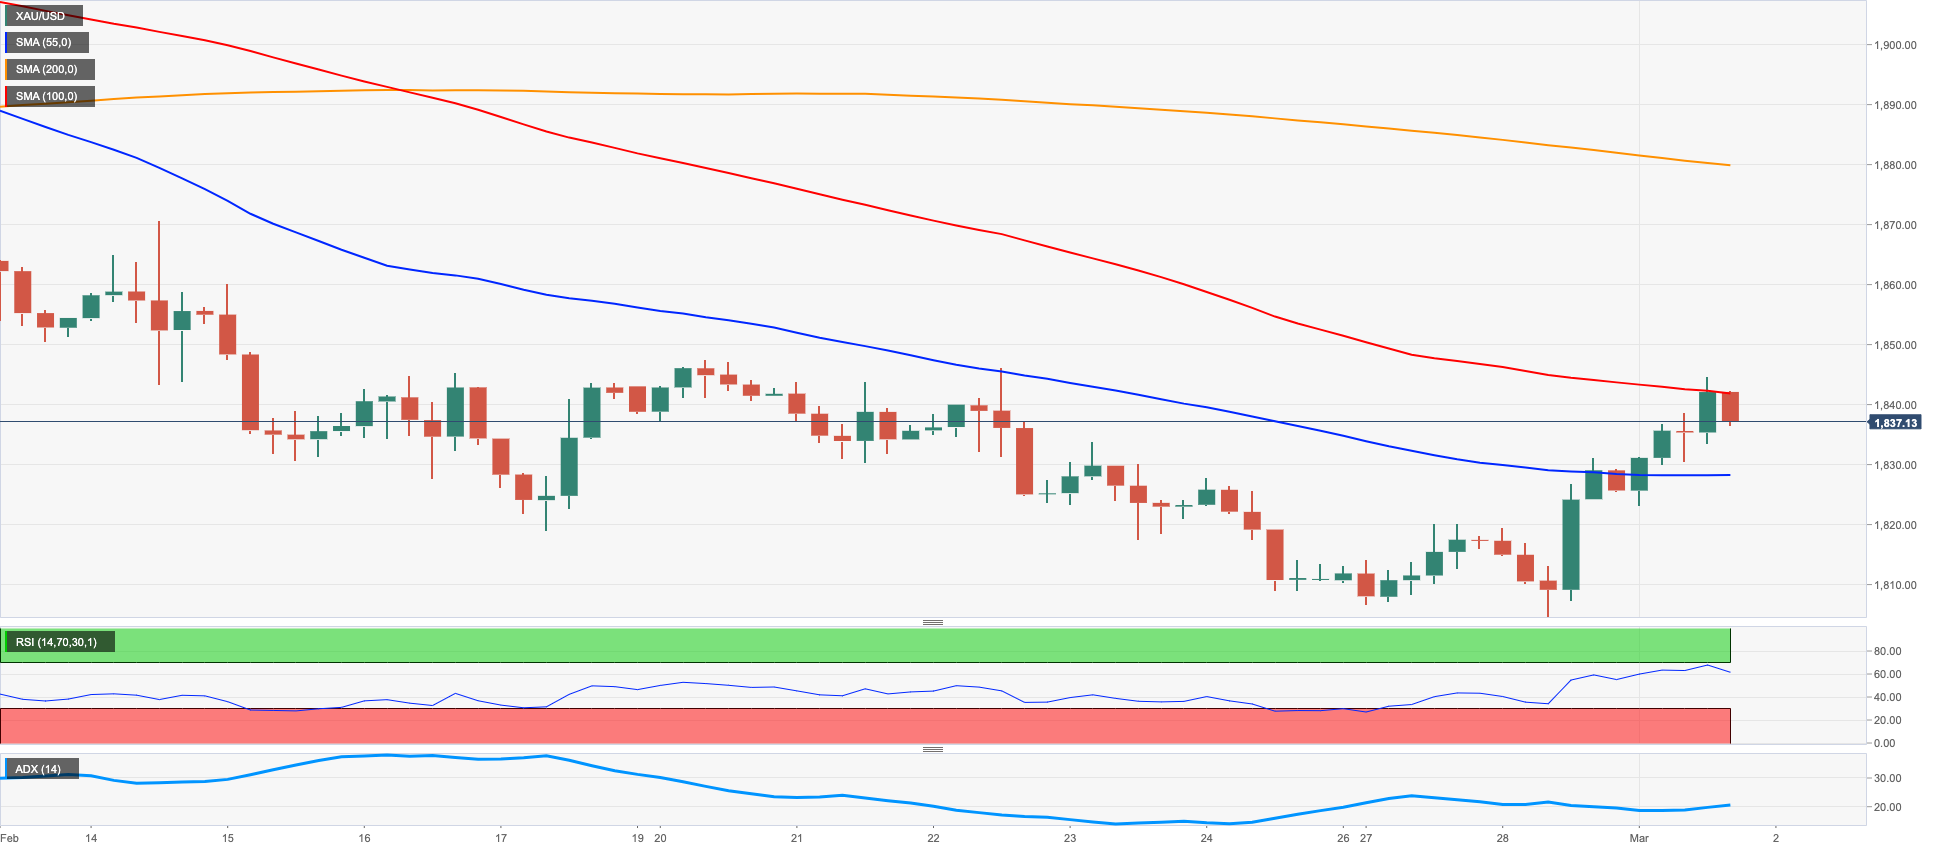
The precious metal extended its march north for the third session in a row on Wednesday, flirting with the key $1850 region on the back of another weak performance of the dollar.
Indeed, the USD Index (DXY) came all the way down from as high as the area just above 105.00 to retest the vicinity of the 104.00 yardstick pari passu with the improvement in the risk complex, which was in turn bolstered by auspicious results from Chinese fundamentals.
The upside potential in bullion, however, remained somewhat limited by the persevering upside momentum in US yields across the curve, which extended further the multi-week rally in place since early February.
The next up barrier for gold emerges at the temporary 55-day SMA at $1860 prior to the weekly top at $1890 (February 9) and the 2023 peak at $1959 (February 2). If bulls push harder, then the yellow metal could confront the April 2022 high at $1998 (April 18) just before the psychological $2000 mark per ounce and followed by the 2022 top at $2070 (March 8). In the opposite direction, the 2023 low at $1806 (February 27) should appear as the immediate support of note prior to the key $1800 zone, which precedes the interim 100-day SMA at $1794 and the key 200-day SMA at $1776. Extra losses are seen revisiting the weekly low at $1727 (November 23) ahead of the November 2022 low at $1616 (November 3).
Resistance levels: $1844 $1870 $1890 (4H chart)
Support levels: $1828 $1806 $1784 (4H chart)
CRUDE WTI
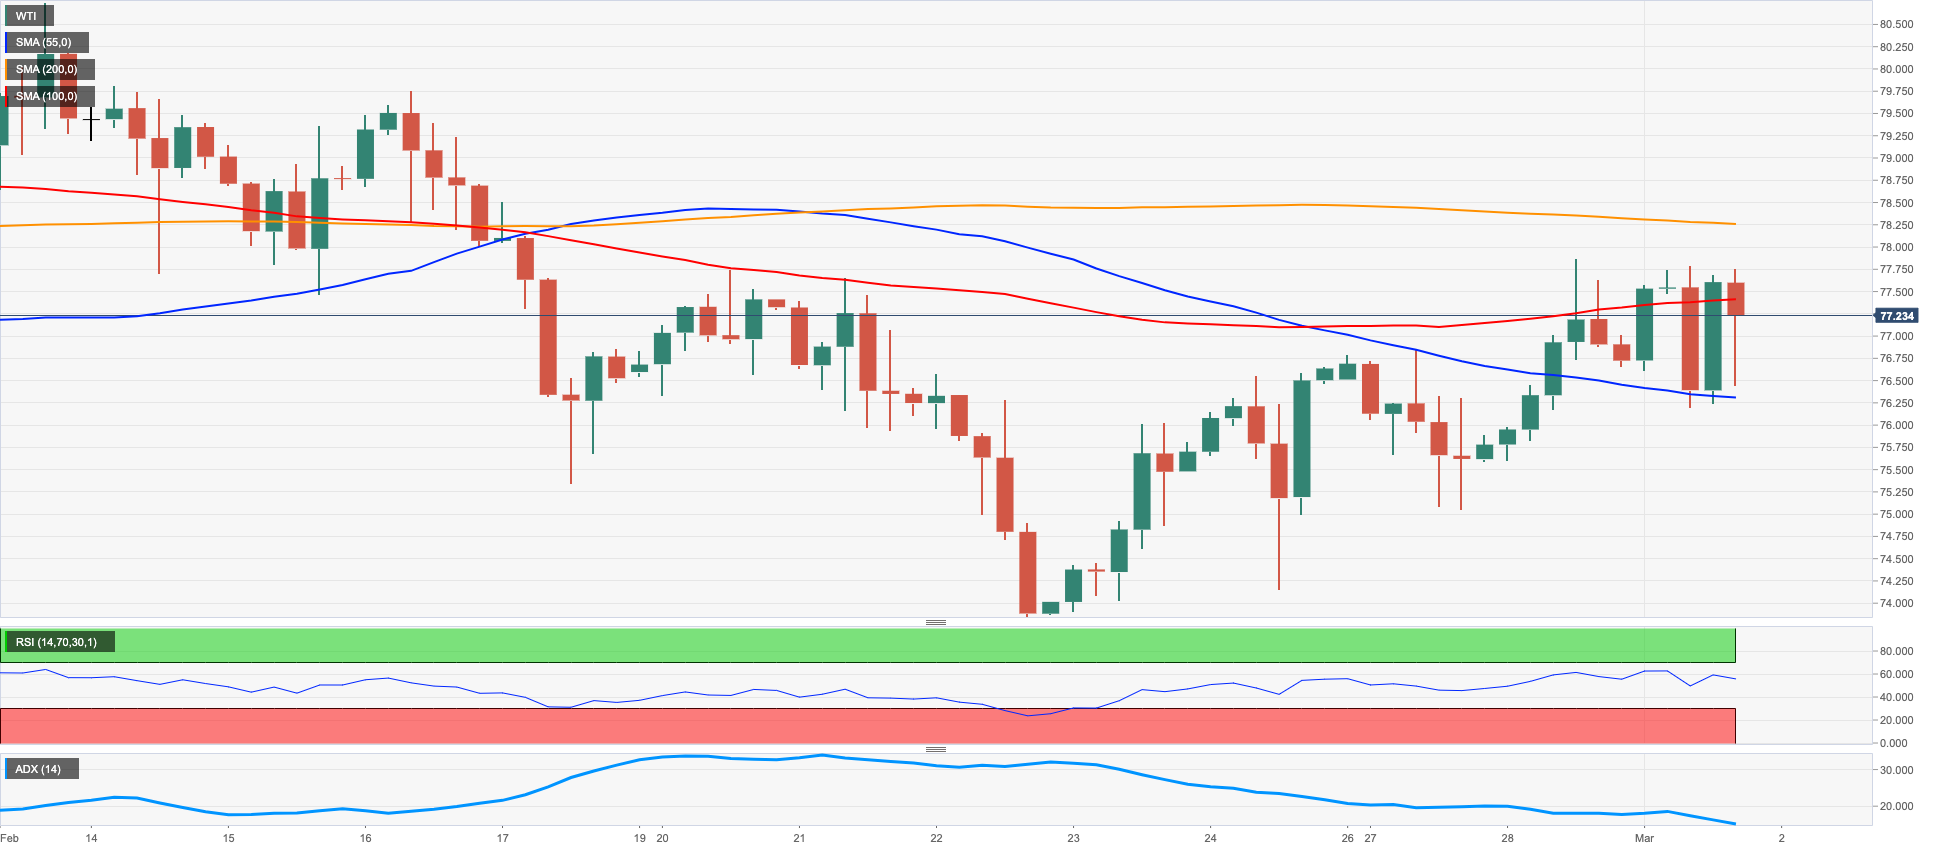
Another positive session saw prices of the WTI add to Tuesday’s gains and advance past the $77.00 mark per barrel on Wednesday, poking at the same time with the temporary hurdle at the 55-day SNA ($77.57).
In fact, the commodity navigated a volatile session amidst news that Russia and the OPEC increased their oil output in February, while another build in weekly US crude oil inventories also weighed on traders’ sentiment.
On the latter, the EIA said crude oil inventories unexpectedly increased by 1.165M barrels in the week to February 24, while supplies at Cushing rose by 0.307M barrels, Weekly Distillate Stocks went up by 0.179M barrels and gasoline stockpiles shrank by 0.874M barrels.
Supporting prices, however, aligned the marked selling pressure in the dollar as well as auspicious figures from the Chinese docket published early on Wednesday.
The WTI maintains the broader consolidative theme unchanged so far. That said, the February top at $80.57 (February 13) remains propped up by the interim 100-day SMA ($80.14), while the breakout of this region could encourage the commodity to confront the 2023 peak at $82.60 (January 23) ahead of the December 2022 high at $83.32 (December 1). North from here aligns the $90.08 level (November 11 2022) seconded by the November 2022 top at $93.73 (November 7). The other way around, a drop below the weekly low at $73.83 (February 22) could put the 2023 low at $72.30 (February 6) to the test prior to the 2022 low at $70.10 (December 9) and the key round level at $70.00.
Resistance levels: $77.79 $78.14 $79.50 (4H chart)
Support levels: $76.10 $75.00 $74.06 (4H chart)
GER40
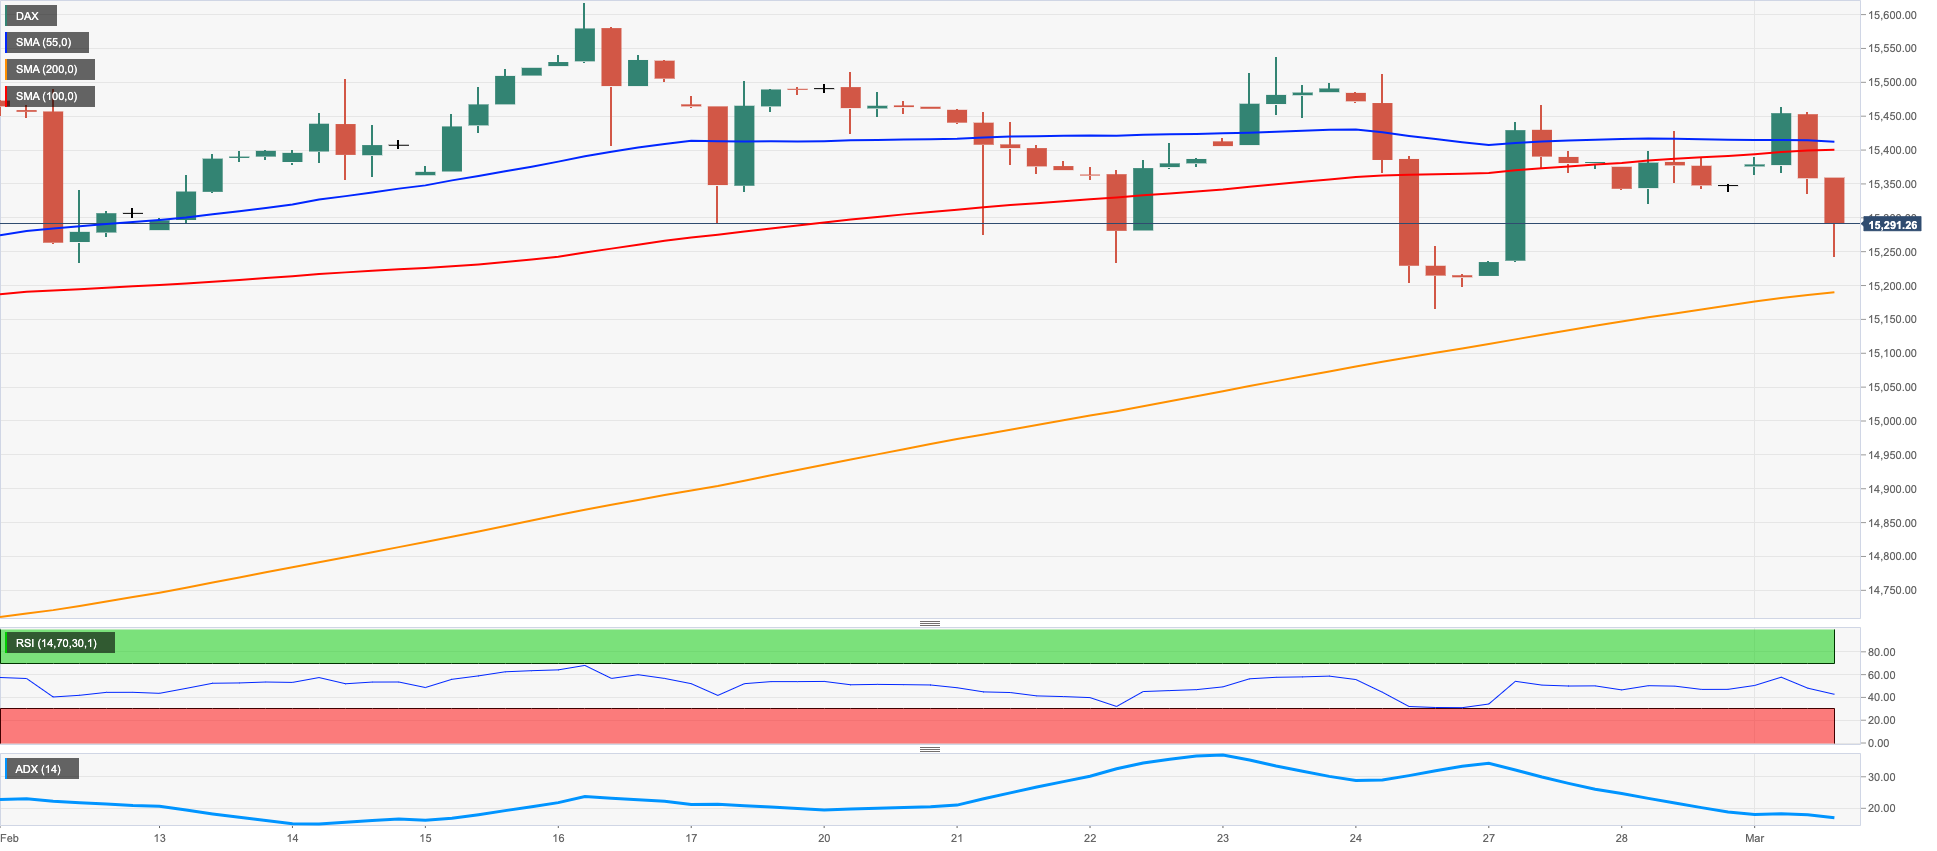
German equities printed the second session in a row with losses on Wednesday. The downtick, however, remained well in line with the broader consolidative theme in place since February.
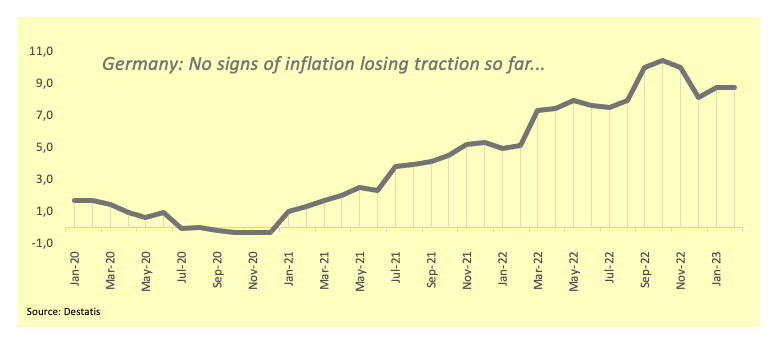
In fact, European stocks – with the exception of the UK benchmark FTSE 100 – grinded lower and faded the initial China-led optimism to return to the negative territory after flash inflation figures in Germany noted consumer prices remained elevated in February and with no signs of abating in the near term at least.
German inflation results added to French and Spanish prints seen earlier in the week and do not look encouraging in light of the publication of the inflation prints for the broader Euroland due on Thursday, as speculation of further rate hikes by the ECB seems to have regained traction.
In Germany then, the flash CPI rose 8.7% YoY in February and 0.8% from a month earlier. In addition, the Unemployment Rate stayed unchanged at 5.5% during last month and the Unemployment Change rose by 2K people. Further data saw the final Manufacturing PMI ease to 46.3 in February (from 47.3).
In the money market, the 10-year Bund yields surpassed the 2.70% level for the first time since July 2011.
Immediately to the downside for the DAX40 appears the weekly low at 15162 (February 24) ahead of another weekly low at 14906 (January 19). The latter looks underpinned by the temporary 55-day SMA at 14893 and comes ahead of the December 2022 low at 13791 (December 20). The breakdown of this level could favour a deeper pullback to the key 200-day SMA at 13781. For all that, no changes to the topside leaves the next up barrier at 2023 high at 15658 (February 9) before the February 2022 top at 15736 (February 2 2022). Extra upside is expected to confront the round level at 16000 ahead of the 2022 peak at 16285 (January 5). The daily RSI grinded lower to the proximity of 51.
Best Performers: Siemens Energy AG, BMW ST, Continental AG
Worst Performers: Vonovia, Fresenius Medical Care KGAA ST, Fresenius SE
Resistance levels: 15552 15634 15658 (4H chart)
Support levels: 15254 15162 14906 (4H chart)
NASDAQ
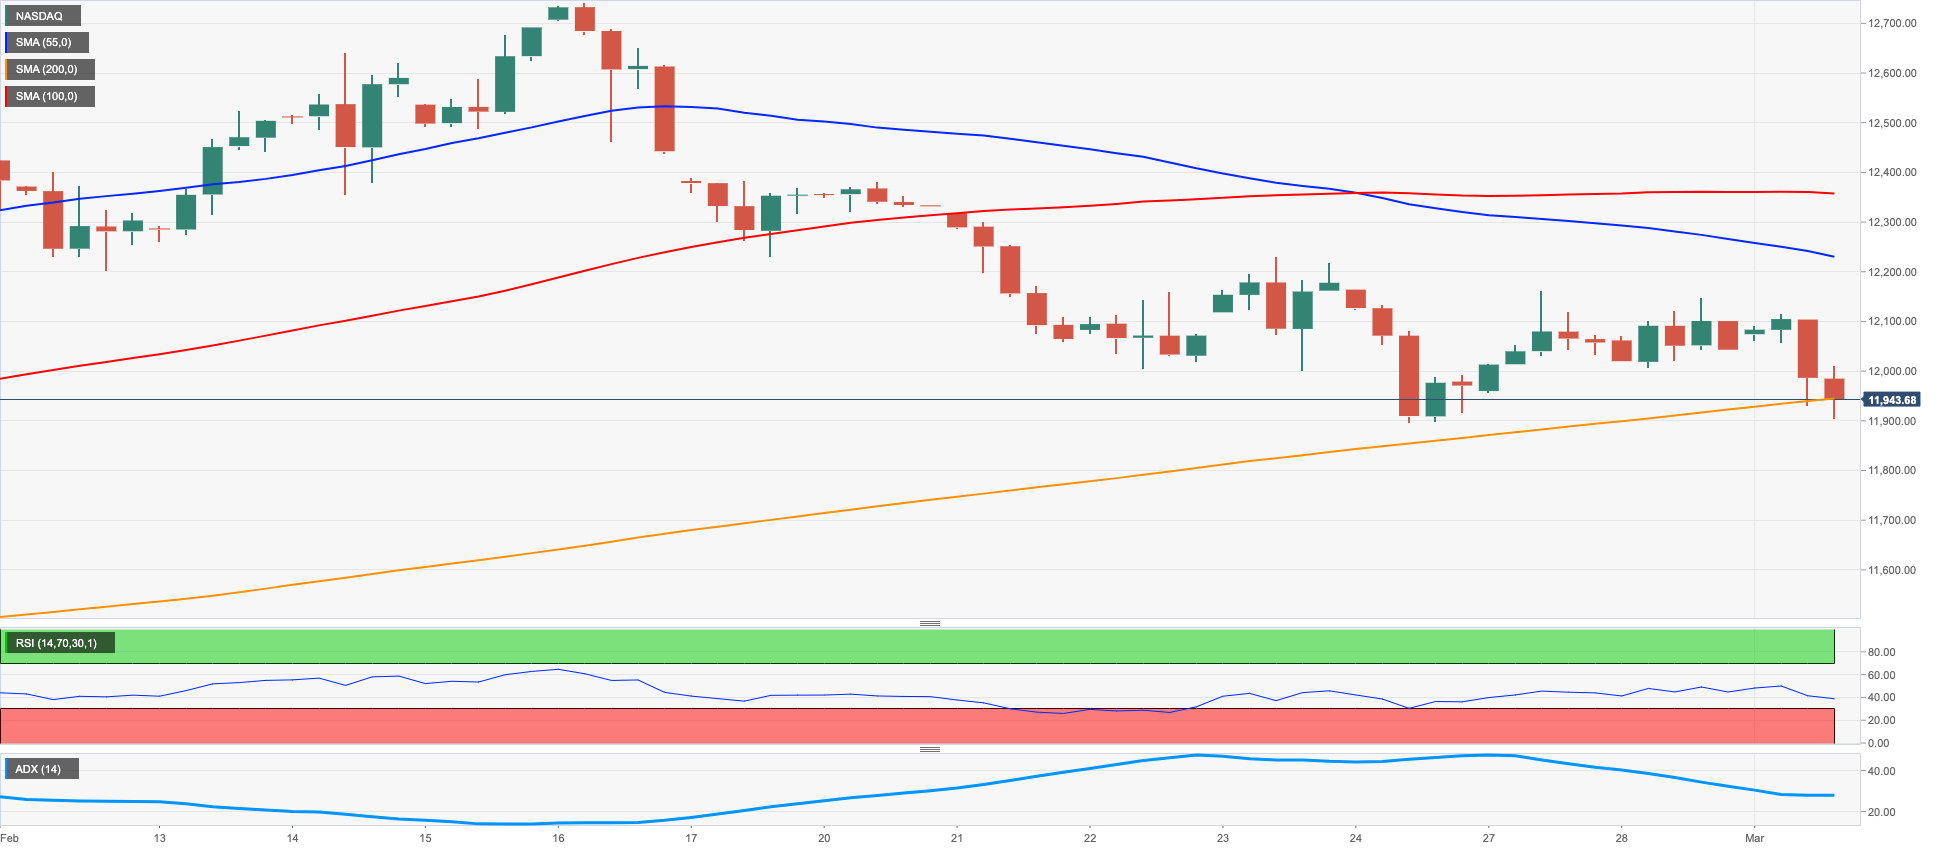
US tech stocks came under pressure and revisited the key 200-day SMA in the 11900 region on Wednesday.
The unabated march north in US yields weighed further on investors’ sentiment as well as another round of hawkish Fed speak, this time by FOMC’s Kashkari and Bostic, while the small bounce in the ISM Manufacturing reinforced the view of a increasingly resilient US economy and underpinned the case for further tightening by the Fed.
The Nasdaq 100 appears decently supported by the February low at 11900 (February 24), an area also coincident with the key 200-day SMA. If bears breach this region, the index could face extra weakness to weekly lows at 11550 (January 25) and 11251 (January 19) ahead of the January low at 10696 (January 6) and the December 2022 low at 10671 (December 22). Just the opposite, the next relevant up barrier is at the 2023 high at 12880 (February 2) ahead of the round level at 13000 and the weekly top at 13175 (August 26 2022). The daily RSI drifted lower to the sub-47 region.
Top Gainers: PDD Holdings DRC, Verisk, JD.com Inc Adr
Top Losers: Rivian Automotive, Lucid Group, Zoom Video
Resistance levels: 12227 12689 12880 (4H chart)
Support levels: 11900 11550 11251 (4H chart)
DOW JONES
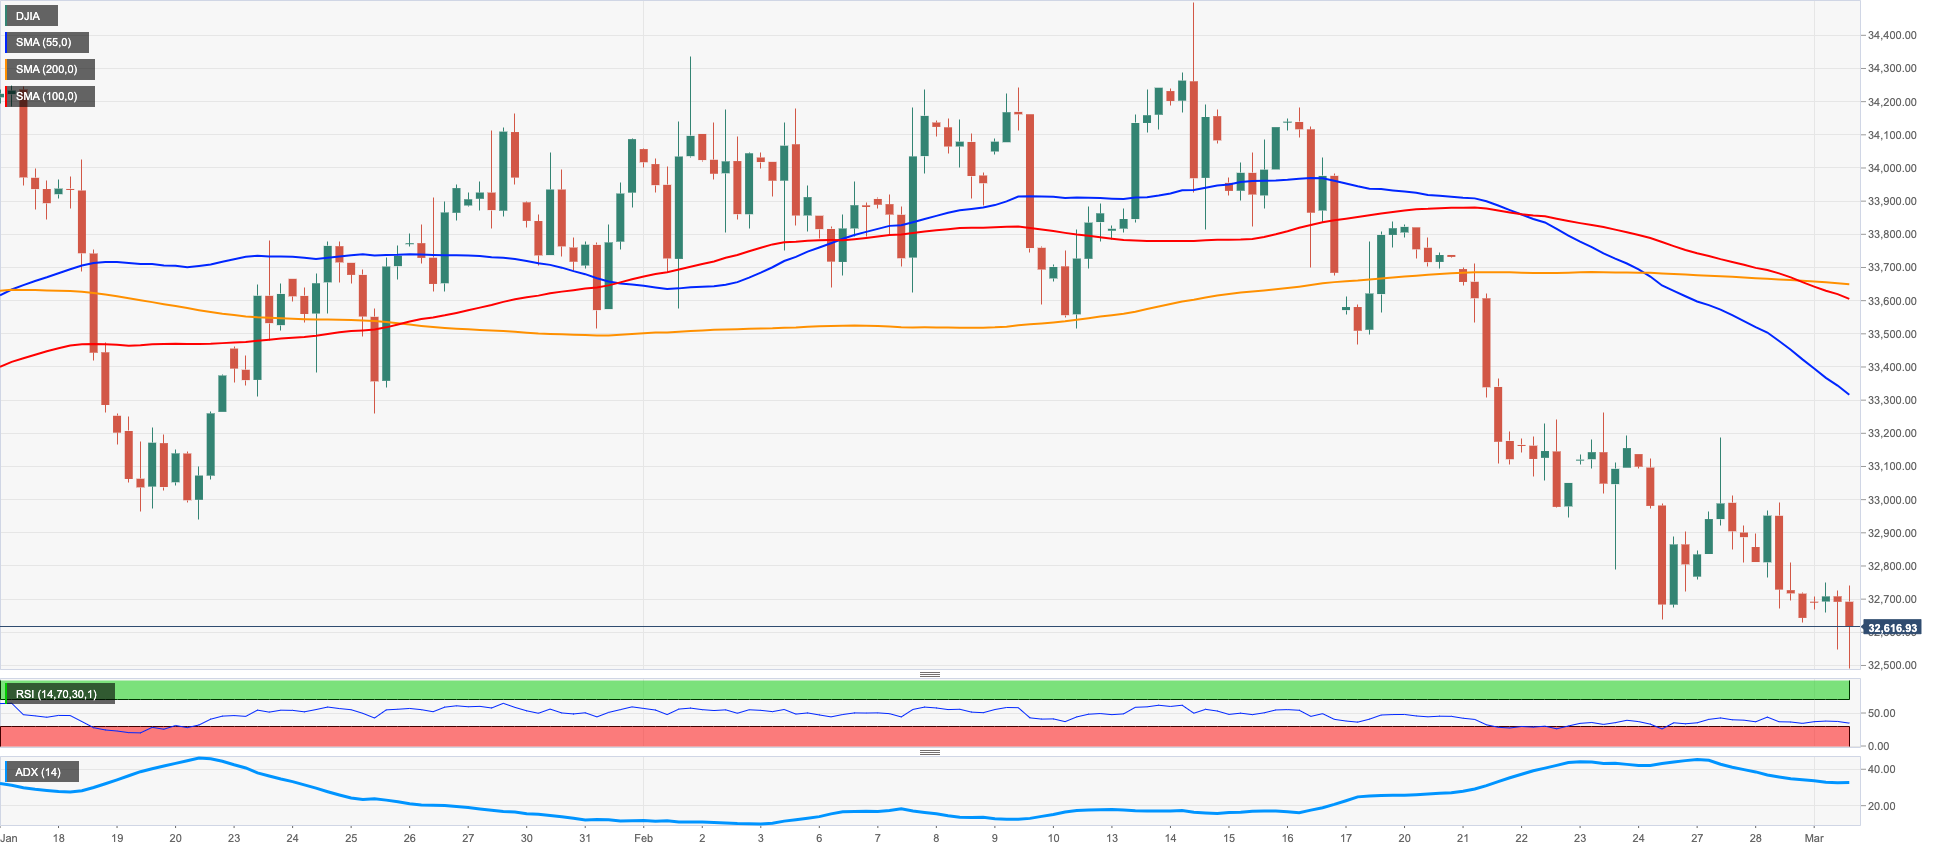
After bottoming out in the 32500 region, the US stock benchmark Dow Jones managed to lure in some dip buyers and trimmed part of that retracement on Wednesday.
US equities navigated with humble losses amidst the generalized upbeat mood in the risk complex in response to firmer Chinese results published during early trade.
Further comments from Fed’s rate setters were far away from sparking some lasting optimism among traders after Minneapolis Fed N.Kashkari said he remains open minded regarding a 25 bps or 50 bps rate hike this month, while he showed some uncertainty when it comes to a soft landing. His colleague R.Bostic (Atlanta) favoured a move in rates to the 5%-5.25% band, where they should remain well into 2024.
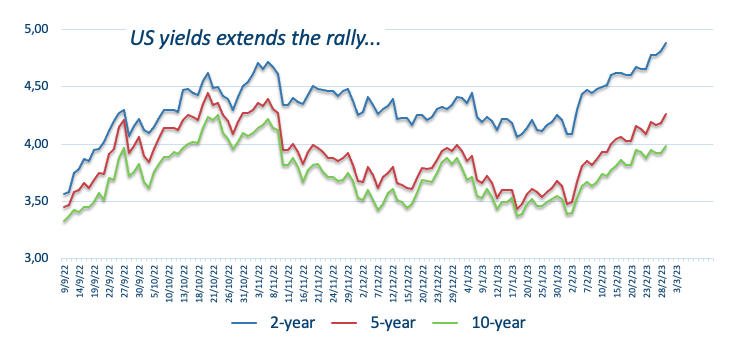
Following those comments, US yields accelerated the upside, with the short end of the curve gradually approaching the key 5% threshold for the first time since July 2007.
In addition, the small rebound in the US ISM Manufacturing also reinforced the view of a resilient US economy and favoured the case for an aggressive stance by the Fed.
On the whole, the Dow Jones dropped 0.11% to 32618 the S&P500 retreated 0.45% to 3951 and the tech-reference Nasdaq Composite deflated 0.60% to 11386.
The Dow could accelerate its losses once it clears the 2023 low at 32500 (March 1). Further down emerges the December 2022 low at 32573 (December 22) ahead of the key 200-day SMA at 32359. On the opposite side, there are temporary hurdles at the 55- and 100-day SMAs at 33019 and 33526, respectively, prior to the 2023 high at 34342 (January 13) and the December 2022 high at 34712 (December 13). If the index leaves the latter behind it could prompt a test of the April 2022 peak at 35492 (April 21) to emerge on the horizon before the February 2022 peak at 35824 (February 9). The daily RSI ticked slightly higher past the 36 level.
Top Performers: Caterpillar, 3M, Dow
Worst Performers: Home Depot, Verizon, Walmart
Resistance levels: 32977 33652 34334 (4H chart)
Support levels: 32500 31727 30206 (4H chart)
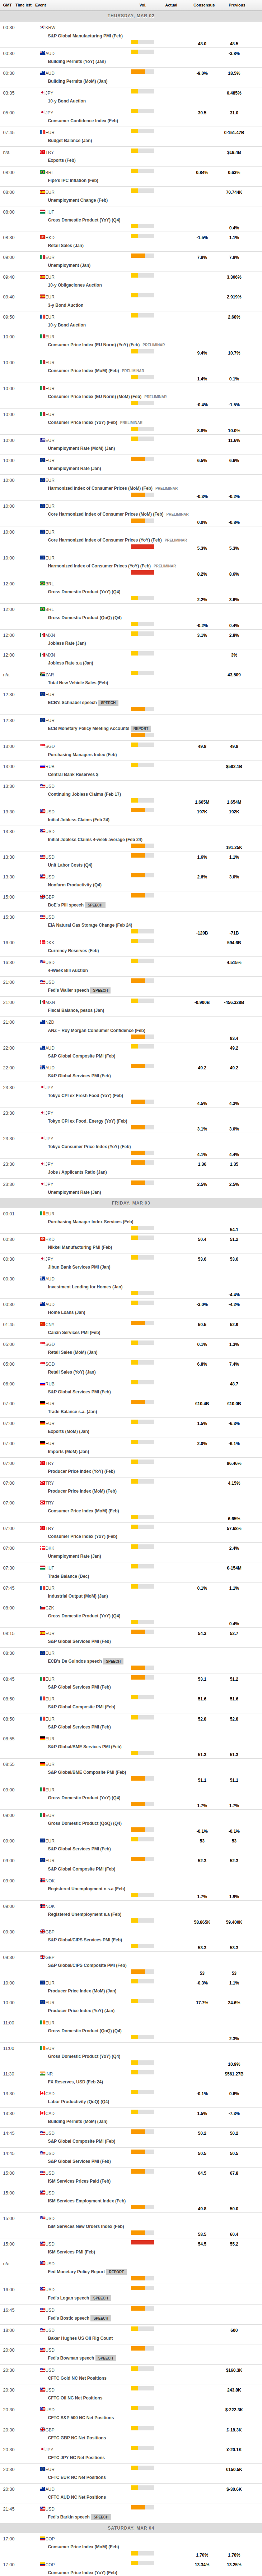
MACROECONOMIC EVENTS
All Information & Updates provided by:

All information relating to the financial markets available on this page has been prepared and issued by FXStreet (Forexstreet SL, Spain, Reg: B62498233) on the basis of publicly available information and all information believed to be reliable and does not conflict with Kuwaiti local laws, and all necessary care has been taken to before the company to ensure that the facts mentioned are correct from the source.
NCM Investment nor any of its directors or employees shall in any way be held responsible for the contents of this news, and the information contained on this page is intended only to provide clients with publicly available information and should not be construed as investment advice, report or analysis and/or constitute an offer or invitation to buy or sell financial instruments of any kind.
RISK WARNING: Forex and CFDs are highly risky leveraged products, as losses can exceed deposits. Please ensure you understand all the risks and take independent advice if necessary. NCM will segregate the clients based on the criteria of the regulator and its bylaws. NCM does not provide any advisory service; the material published does not constitute advice or a recommendation for a transaction in any financial instrument. NCM accepts no responsibility for any use of the content presented and any consequences of that use. Anyone acting on the information provided does so at their own risk.