
- Contact Us:
-

-

-

-


Daily Market Updates
03 Mar 2023
USDJPY
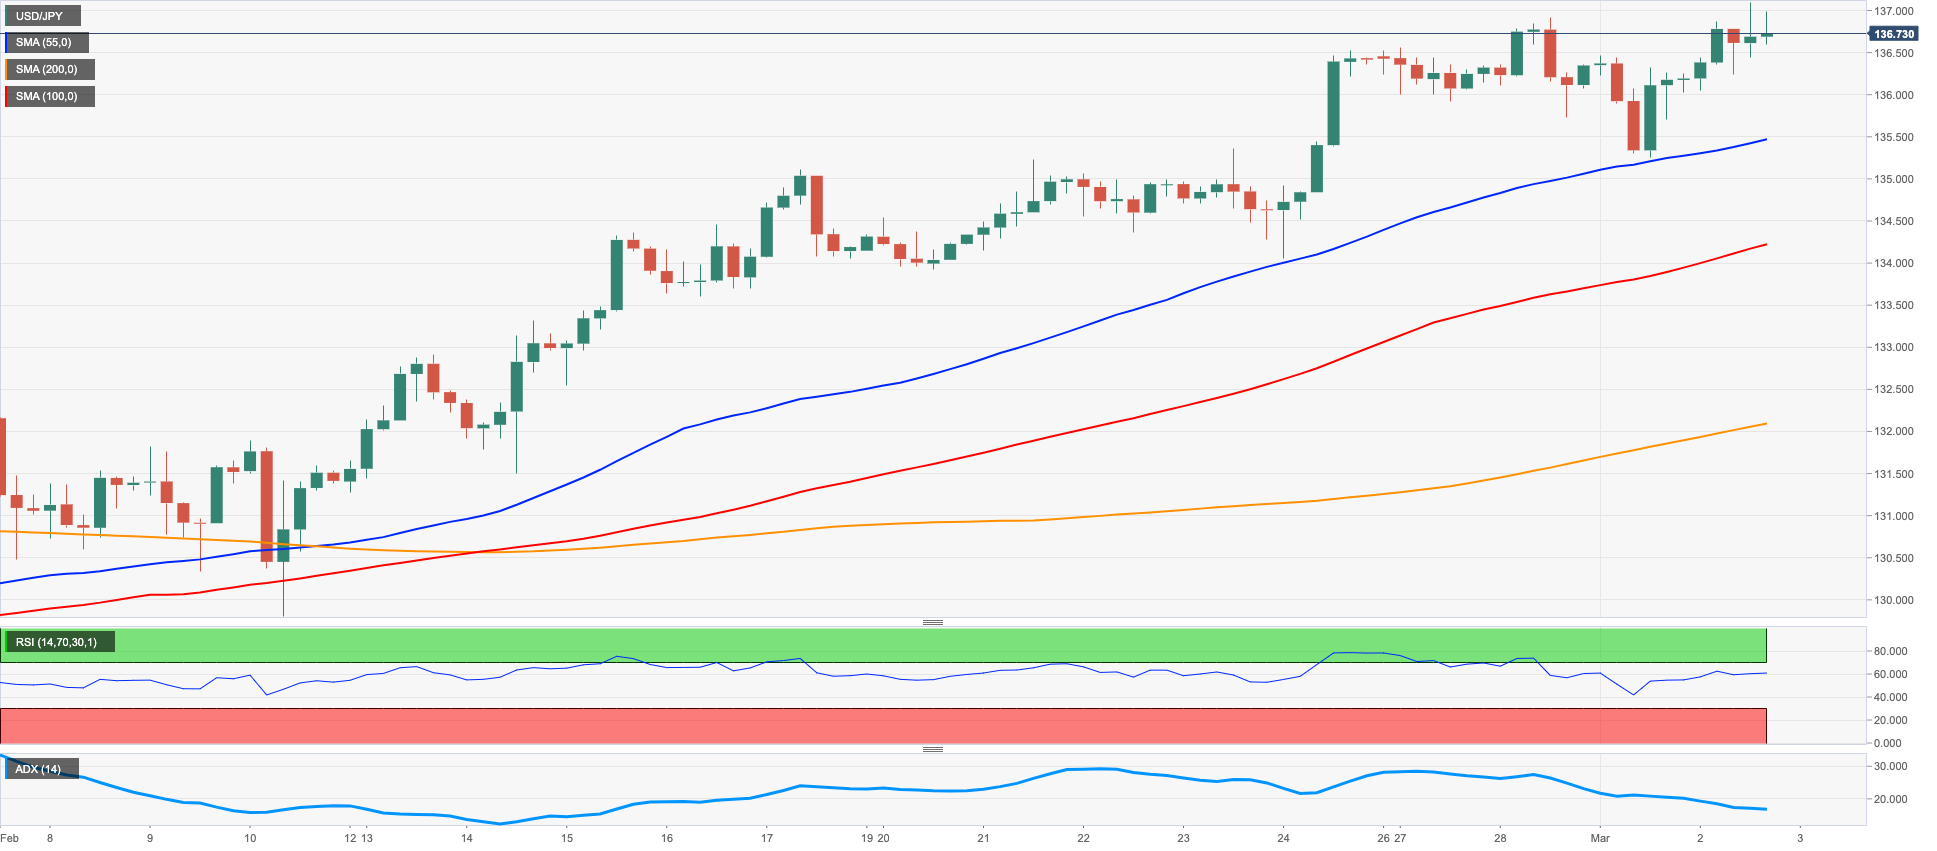
In line with the strong rebound in the greenback and the unabated rally in US yields, USD/JPY was no exception and rose to new yearly tops just above 137.00 the figure on Thursday.
Indeed, with US yields in the short end of the curve hovering around levels last seen in July 2007 near the 5.0% mark and the key 10-year yields surpassing the 4.0% for the first time since early November 2022, the pair accelerated its gains and flirted with the key 200-day SMA near 137.20.
It is worth noting that USD/JPY is so far en route to close its 7th consecutive week with gains.
From the BoJ, member Takata favoured keeping the current ultra-loose monetary policy stance at the time when he noted the absence of sustained price increases in tandem with higher wages. Regarding the widening of the YCC band announced in December, Takata suggested that “it will take some time to assess” those effects.
In Japan, Capital Spending expanded 7.7% YoY in Q4 and Foreign Bond Investment increased ¥211.6B in the week to February 25. In addition, Consumer Confidence improved marginally to 31.1 during last month.
Immediately to the upside in USD/JPY now comes the key 200-day SMA at 137.25 ahead of weekly peaks at 138.17 (December 15 2022) and 139.89 (November 30 2022), all before the key round level at 140.00. In the opposite direction, the 134.05 level (February 24) should offer minor support prior to the interim 55-day SMA at 132.17 and the weekly low at 129.79 (February 10). Down from here turns up the February low at 128.08 (February 2) ahead of the 2023 low at 127.21 (January 16) and the May 2022 low at 126.36 (May 24). The daily RSI flirted with the overbought territory near 70.
Resistance levels: 137.10 137.47 138.17 (4H chart)
Support levels: 135.25 134.05 132.82 (4H chart)
GBPUSD
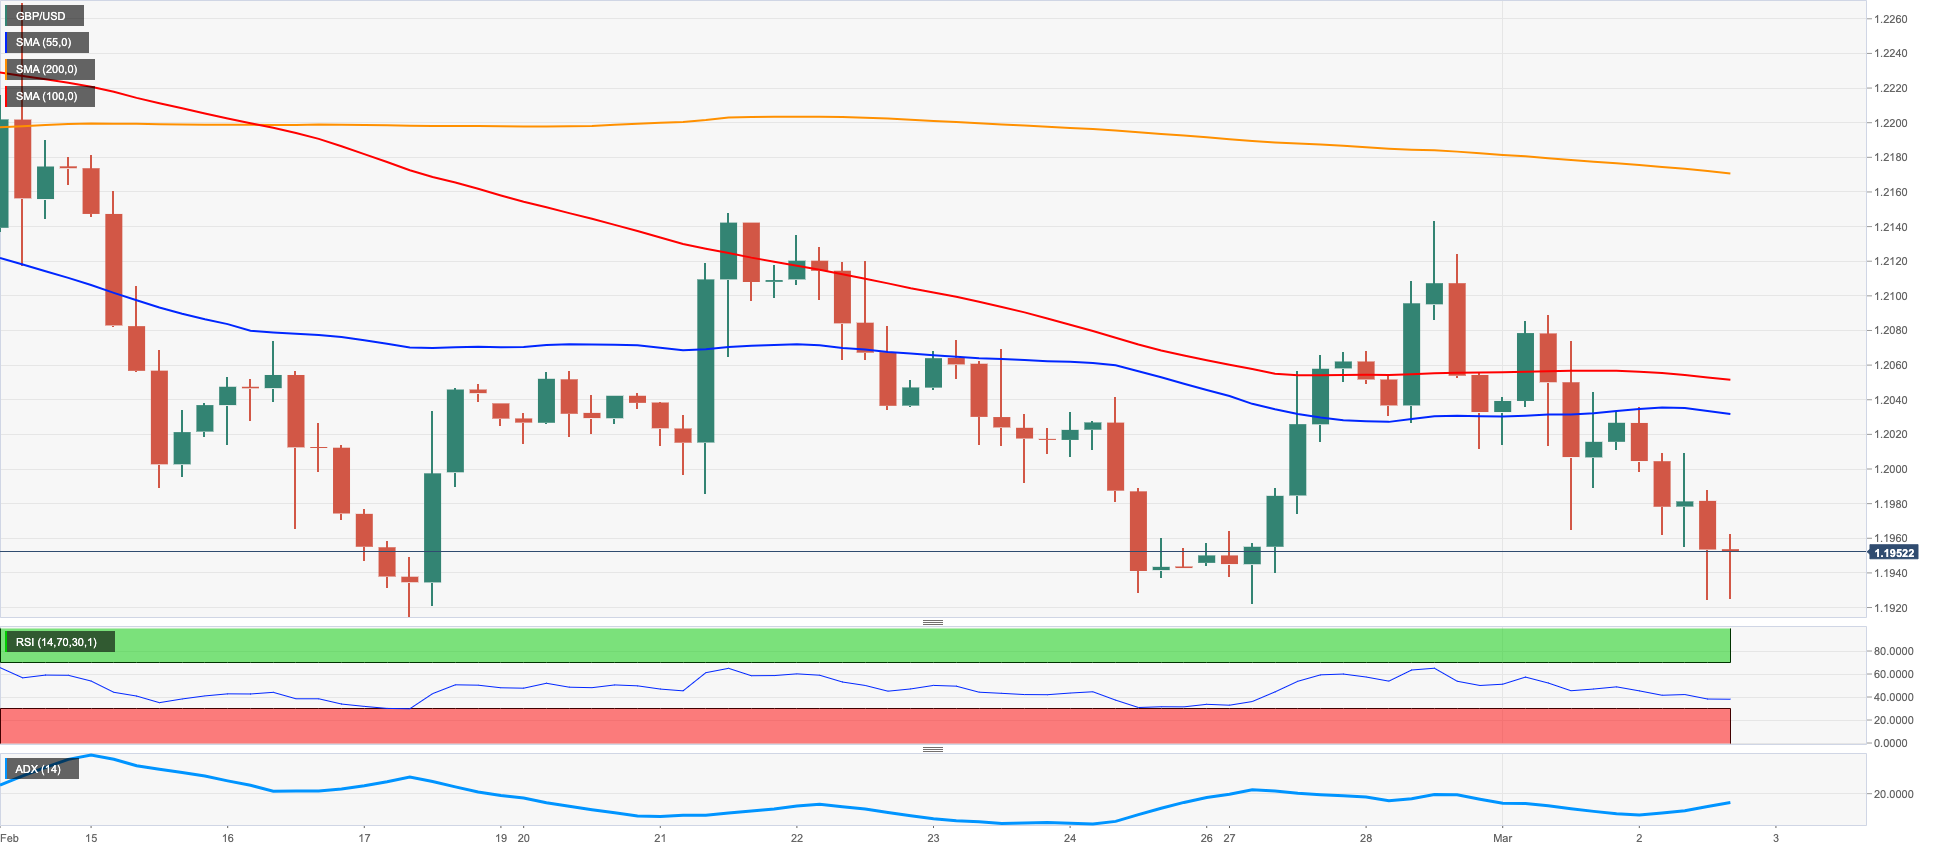
Further strength in the dollar weighed on the risk complex and encouraged sellers to drag GBP/USD to fresh 3-day lows in the vicinity of 1.1920 on Thursday.
Indeed, another positive session in the greenback prompted Cable to revisit the proximity of the 200-day SMA near the 1.1900 neighbourhood, an area also coincident with the February lows.
Absent releases in the UK docket, the monthly BoE’s Decision Maker Panel (DMP) data for the month of February was out and showed that UK firms expect inflation at 5.9% in a year’s time and 3.4% in three years. Additionally, year-ahead wage growth held steady at 5.7%, while overall business uncertainty continued to decline during February.
In addition, BoE´s Chief Economist H.Pill said the current momentum in the economic activity may be slightly stronger than anticipated.
If GBP/USD breaks below the ongoing consolidative theme it should meet initial contention at the key 200-day SMA at 1.1916, which reinforces the February low at 1.1914 (February 17) and precedes the 2023 low at 1.1841 (January 6) seconded by the November 2022 low at 1.1142 (November 4). On the other hand, the weekly high at 1.2147 (February 21) remains bolstered by the provisional 55-day SMA (1.2135). The breakout of this region could prompt the weekly top at 1.2269 (February 14) to emerge on the horizon prior to the 2023 peak at 1.2447 (January 23) and the May 2022 high at 1.2666 (May 27). Further up comes the 200-week SMA at 1.2880 ahead of the psychological 1.3000 level. The daily RSI lost further momentum and flirted with 41.
Resistance levels: 1.2033 1.2088 1.2143 (4H chart)
Support levels: 1.1924 1.1914 1.1841 (4H chart)
AUDUSD
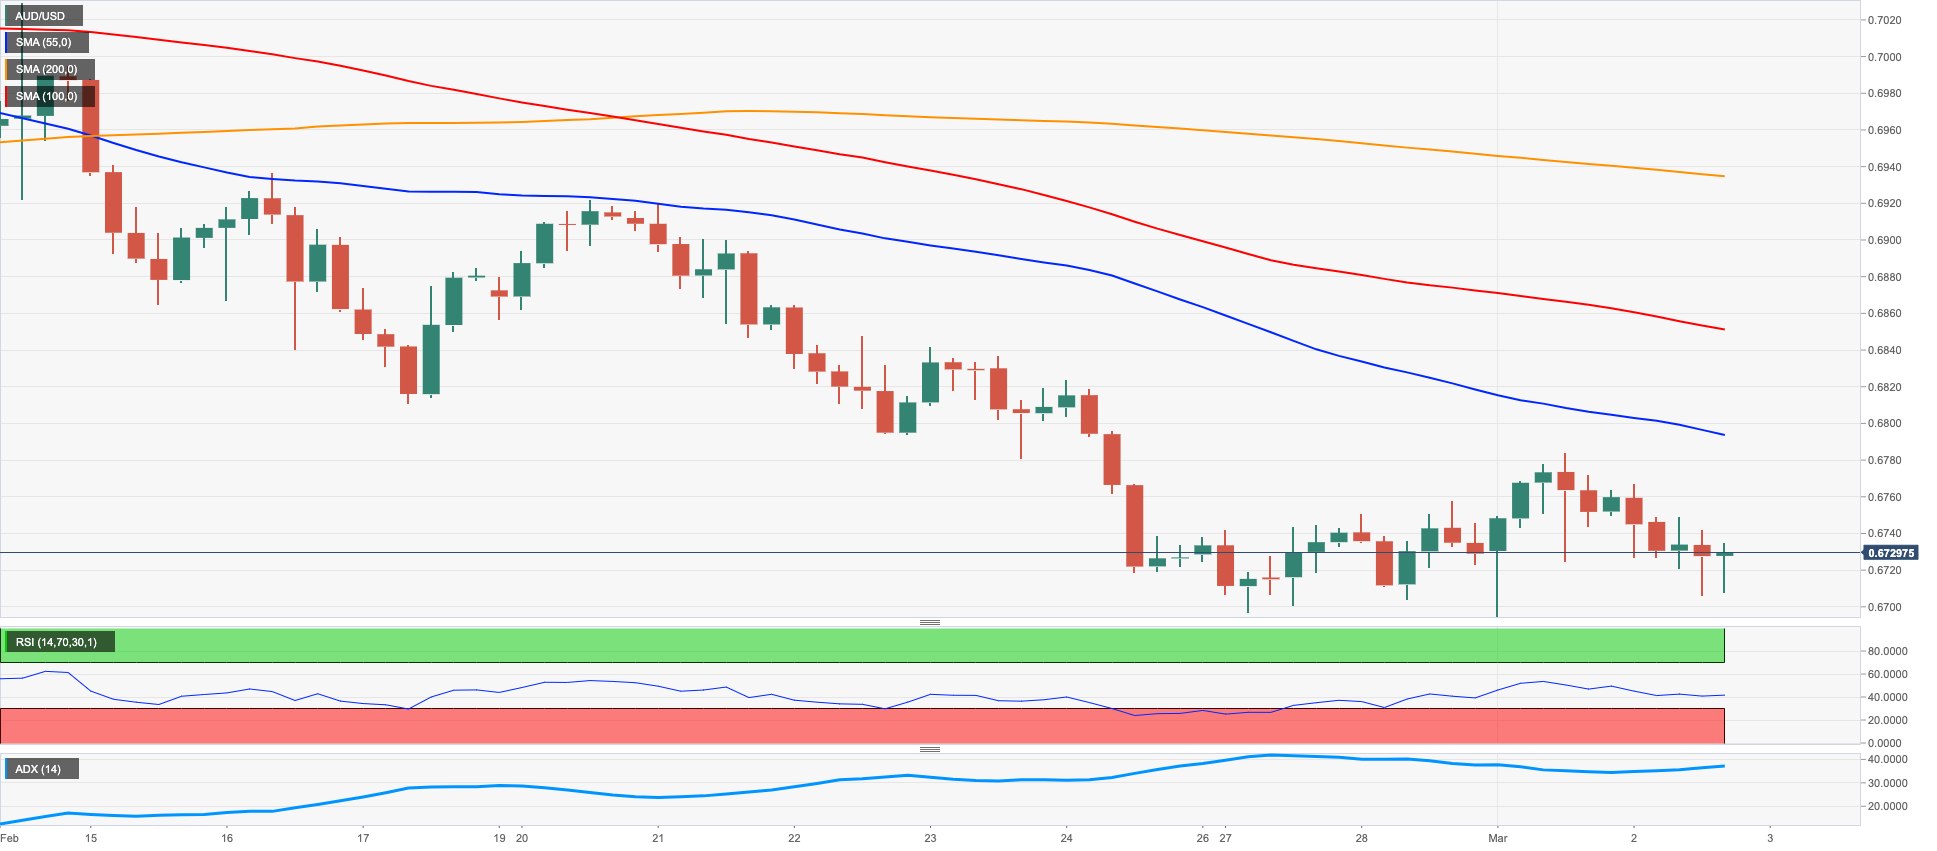
AUD/USD succumbed to the dollar’s strong bounce and revisited the lower end of the weekly range near the 0.6700 neighbourhood on Thursday.
Indeed, the intense move higher in the greenback eclipsed recent news of firm results in China – and the positive impact on the Australian economy - and put the commodity complex and the Aussie dollar under heightened pressure, forcing the pair to reverse Wednesday’s decent uptick at the same time.
In Australia, flash Building Permits contracted at a monthly 27.6% in January and 8.4% over the last twelve months. Still around the housing sector, advanced Private House Approvals contracted 13.8% MoM in the same period.
AUD/USD remains under pressure and a breach of the March low at 0.6694 (March 1) could rapidly pave the way for a drop to the 2023 low at 0.6688 (January 3) ahead of the December 2022 low at 0.6629 (December 20) and the weekly low at 0.6584 (November 21 2022). By contrast, the weekly top at 0.6783 (March 1) could put a test of the key 200-day SMA at 0.6791 back on the radar ahead of the interim 55-day SMA at 0.6876 and the weekly peak at 0.6920 (February 20). North from here comes the weekly high at 0.7029 (February 14) prior to the 2023 top at 0.7157 (February 2) and the round level at 0.7200, all before the June 2022 peak at 0.7282 (June 3). The daily RSI eased to the proximity of 36.
Resistance levels: 0.6783 0.6855 0.6920 (4H chart)
Support levels: 0.6694 0.6688 0.6650 (4H chart)
GOLD
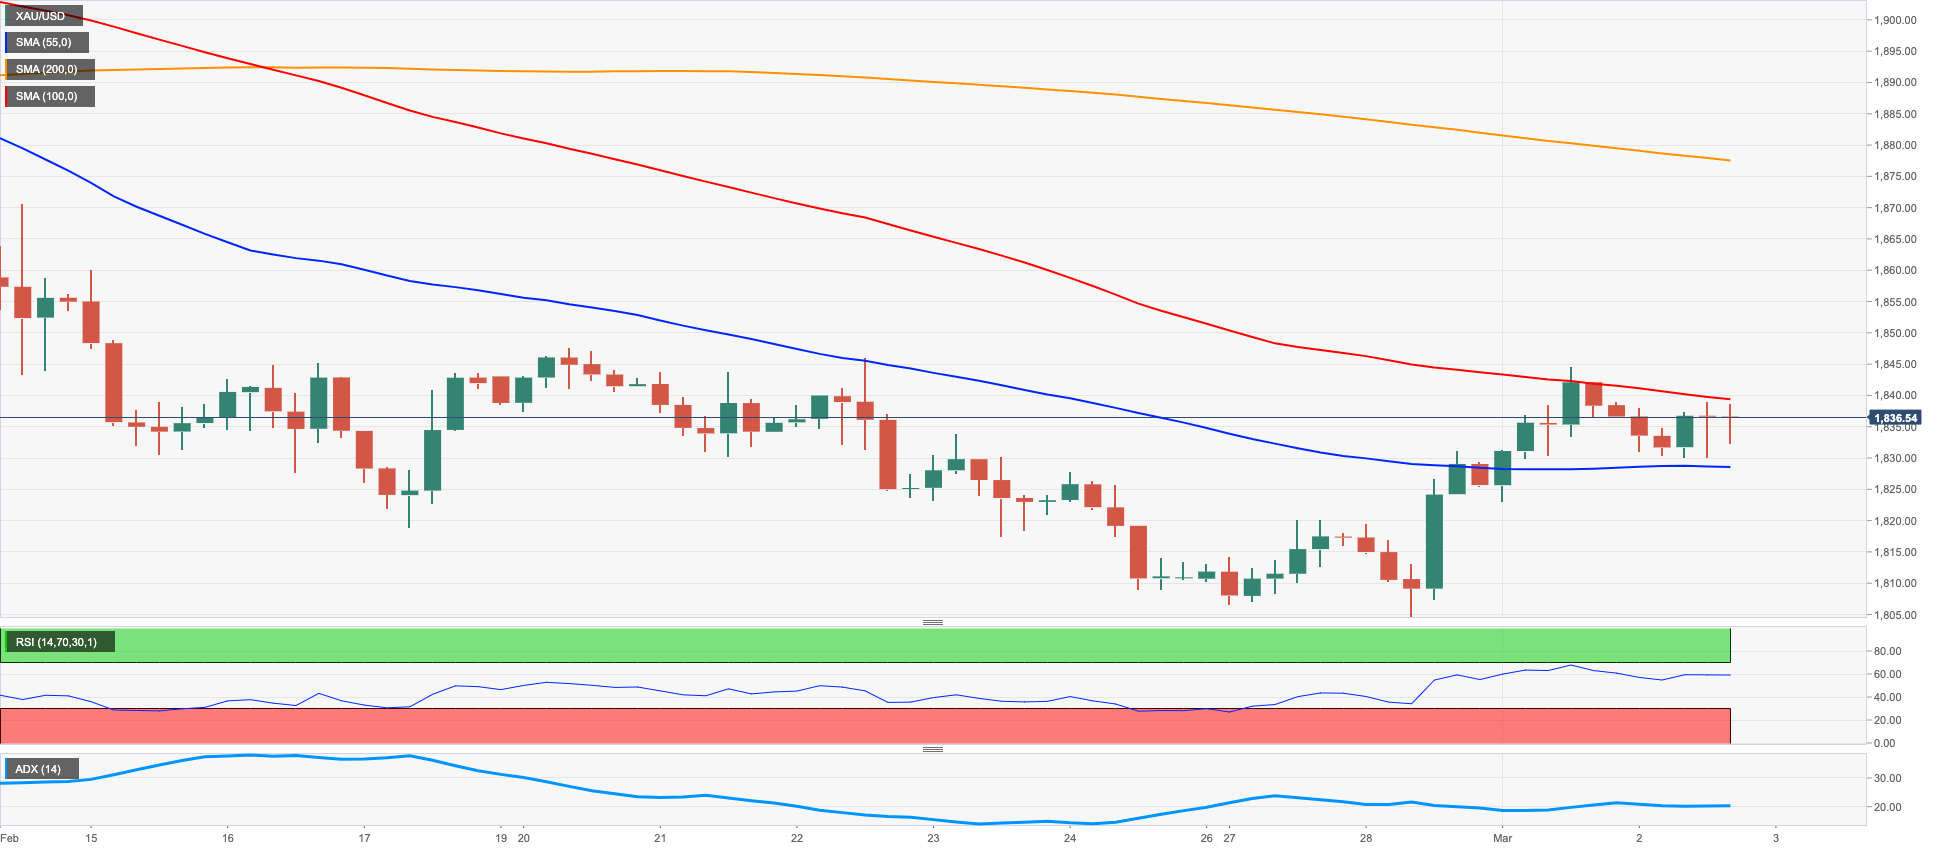
Gold prices alternated gains with losses near the $1840 level after three consecutive daily advances on Thursday, all against the backdrop of the pronounced bounce in the dollar.
In addition, and collaborating with the inconclusive price action in the precious metal, appeared the intense march north in US yields across the curve. On this, the short end of the curve navigates multi-year highs near the key 5.0% threshold, and the reference 10-year yields surpass the 4.0% mark, or multi-month peaks.
Moving forward, bullion risks further correction on the back of the persevering hawkish narrative from Fed’s policy makers and the continuation of the tightening cycle by the Fed. While a 25 bps rate hike at the March event looks likely, its probability has reduced to nearly 68% according to CME Group’s FedWatch Tool from nearly 83% a month ago.
The surpass of the weekly top at $1844 (March 1) could prompt gold to retest the provisional 55-day SMA at $1860 ahead of another weekly peak at $1890 (February 9). Extra gains from here should target the 2023 high at $1959 (February 2) followed by the April 2022 top at $1998 (April 18), which precedes the psychological $2000 mark and the 2022 peak at $2070 (March 8). On the flip side, the immediate support comes at the 2023 low at $1804 (February 28) ahead of the key $1800 zone and the temporary 100-day SMA at $1796. Below the latter appears the more-relevant 200-day SMA at $1775 seconded by the weekly low at $1727 (November 23) and the November 2022 low at $1616 (November 3).
Resistance levels: $1844 $1870 $1890 (4H chart)
Support levels: $1828 $1804 $1784 (4H chart)
CRUDE WTI
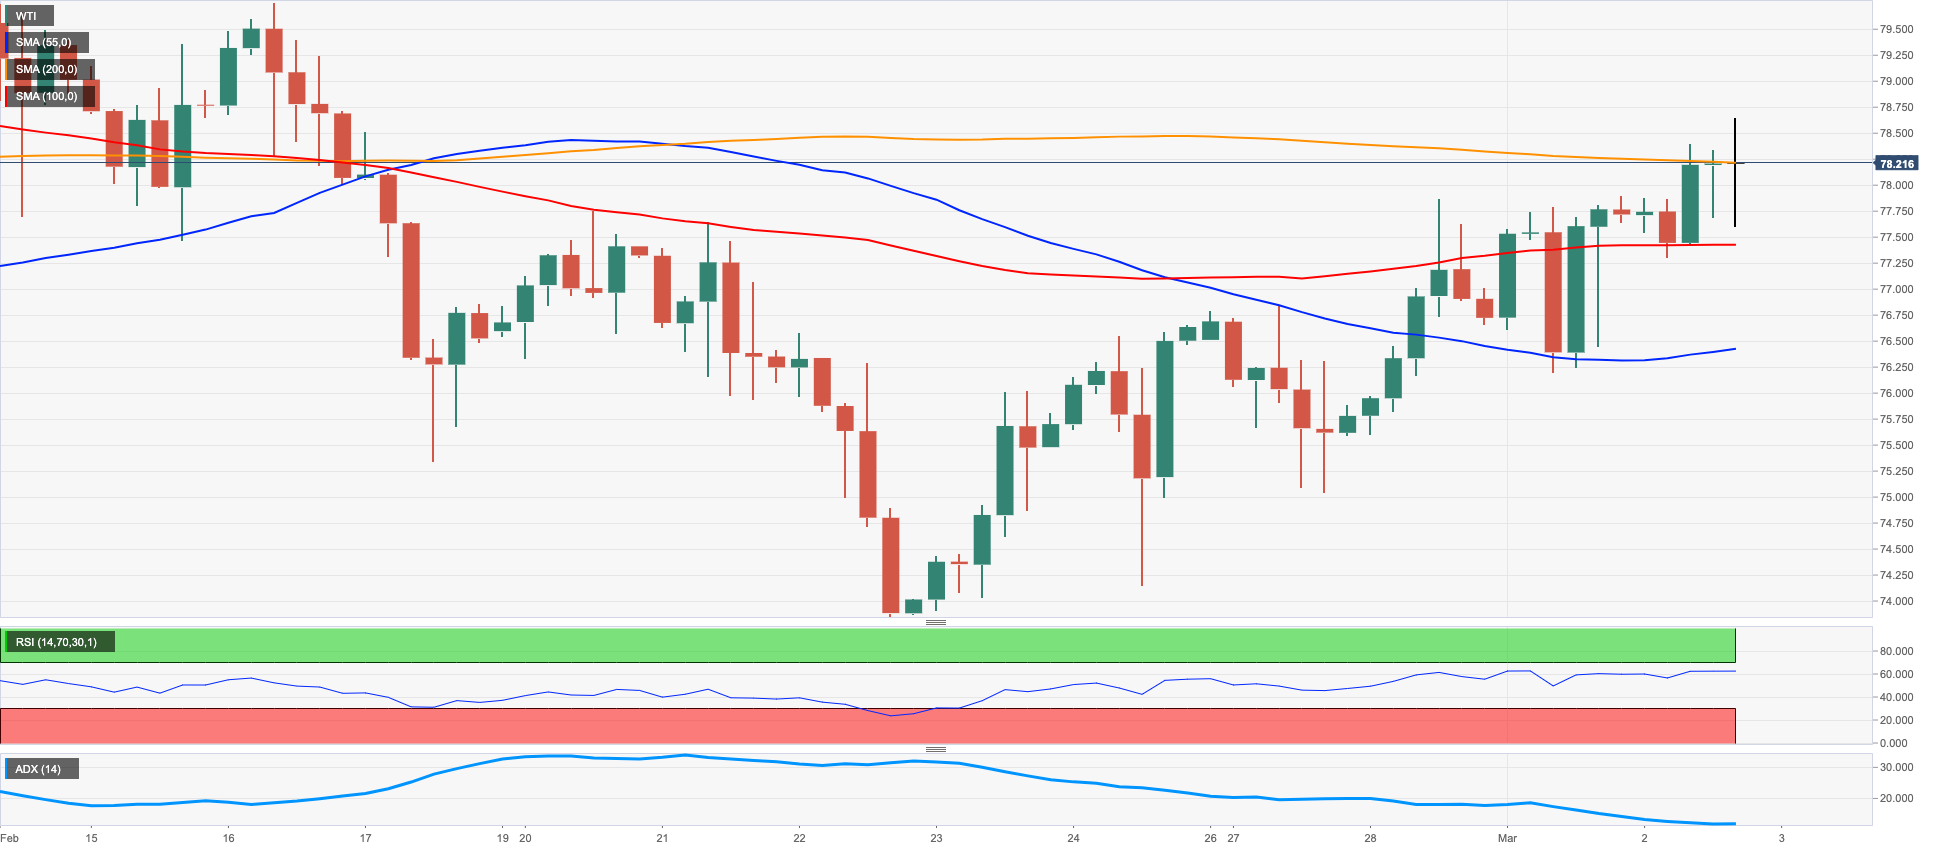
Prices of the WTI advanced for the third day in a row and briefly pierced the $78.00 mark per barrel on Thursday.
This time, the upbeat mood in the commodity was underpinned by the reopening in China, which was in turn supported by recent firmer-than-expected results from the Chinese docket and rising exports of Russian oil to the Asian giant.
Limiting the upside in crude oil emerged the stronger dollar in combination with fears of an economic deceleration in response to central bank’s tightening as well as the recently reported weekly build in US crude oil inventories.
The continuation of the upside in WTI faces the next temporary obstacle at the 100-day SMA at $80.04 just ahead of the February peak at $80.57 (February 13) and the 2023 high at $82.60 (January 23). Once cleared, the commodity could challenge the December 2022 top at $83.32 (December 1) seconded by the $90.08 level (November 11 2022) and the November 2022 peak at $93.73 (November 7). On the flip side, the immediate support aligns at the weekly low at $73.83 (February 22) prior to the 2023 low at $72.30 (February 6) and before the 2022 low at $70.10 (December 9), which is closely followed by the key round level at $70.00.
Resistance levels: $78.55 $79.50 $80.57 (4H chart)
Support levels: $76.10 $75.00 $74.06 (4H chart)
GER40
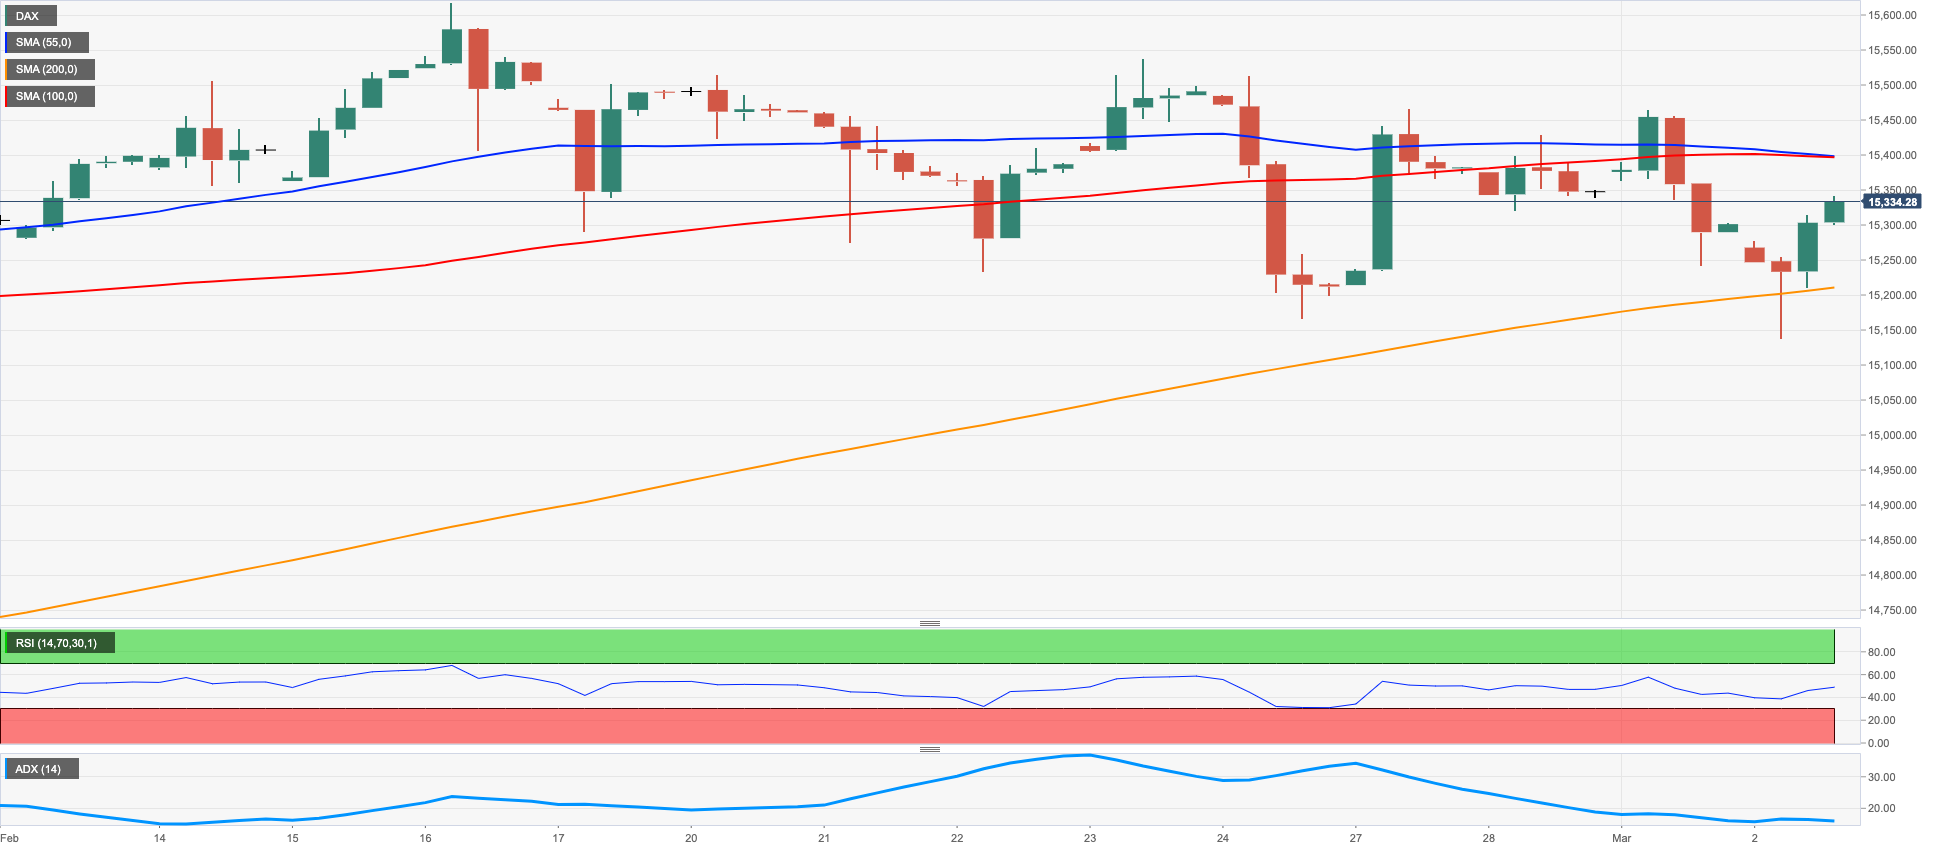
European stocks traded in an upbeat fashion on Thursday.
Indeed, the German reference DAX40 set aside two consecutive sessions with gains and clocked humble gains around the 15300 region on Thursday.
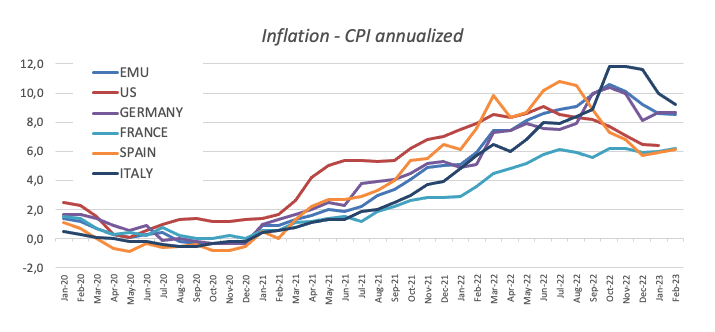
The firm tone in equities was underpinned by the higher-than-estimated inflation figures in the broader Euroland, which at the same time appear to have reinforced the case for further interest rate hikes by the ECB.
The above was also bolstered by comments from Chair Lagarde, who kind of stressed that a 50 bps rate hike remains on the table at this month’s event amidst the current elevated inflation. Her views came in line with recent comments from many ECB rate setters, who advocated for the continuation of the hiking cycle for the time being.
Collaborating with the upside in the index, the 10-year Bund yields extended the move higher to the area just shy of 2.80%, levels last visited back in July 2011.
The breakdown of the weekly low at 15150 (March 2) could prompt another weekly low at 14906 (January 19) to emerge on the horizon. While this level remains propped up by the interim 55-day SMA at 14909, a drop below it could spark further losses to the December 2022 low at 13791 (December 20) ahead of the key 200-day SMA at 13781. On the opposite side, the 2023 top at 15658 (February 9) still emerges as the immediate resistance level ahead of the February 2022 peak at 15736 (February 2 2022). The surpass of this level exposes the round level at 16000 prior to the 2022 high at 16285 (January 5). The daily RSI ticked slightly higher past the 52 level.
Best Performers: Adidas, E.ON SE, Merck
Worst Performers: Covestro, Deutsche Bank AG, Dr Ing hc Porsche AG pfd
Resistance levels: 15552 15634 15658 (4H chart)
Support levels: 15150 14906 14819 (4H chart)
NASDAQ
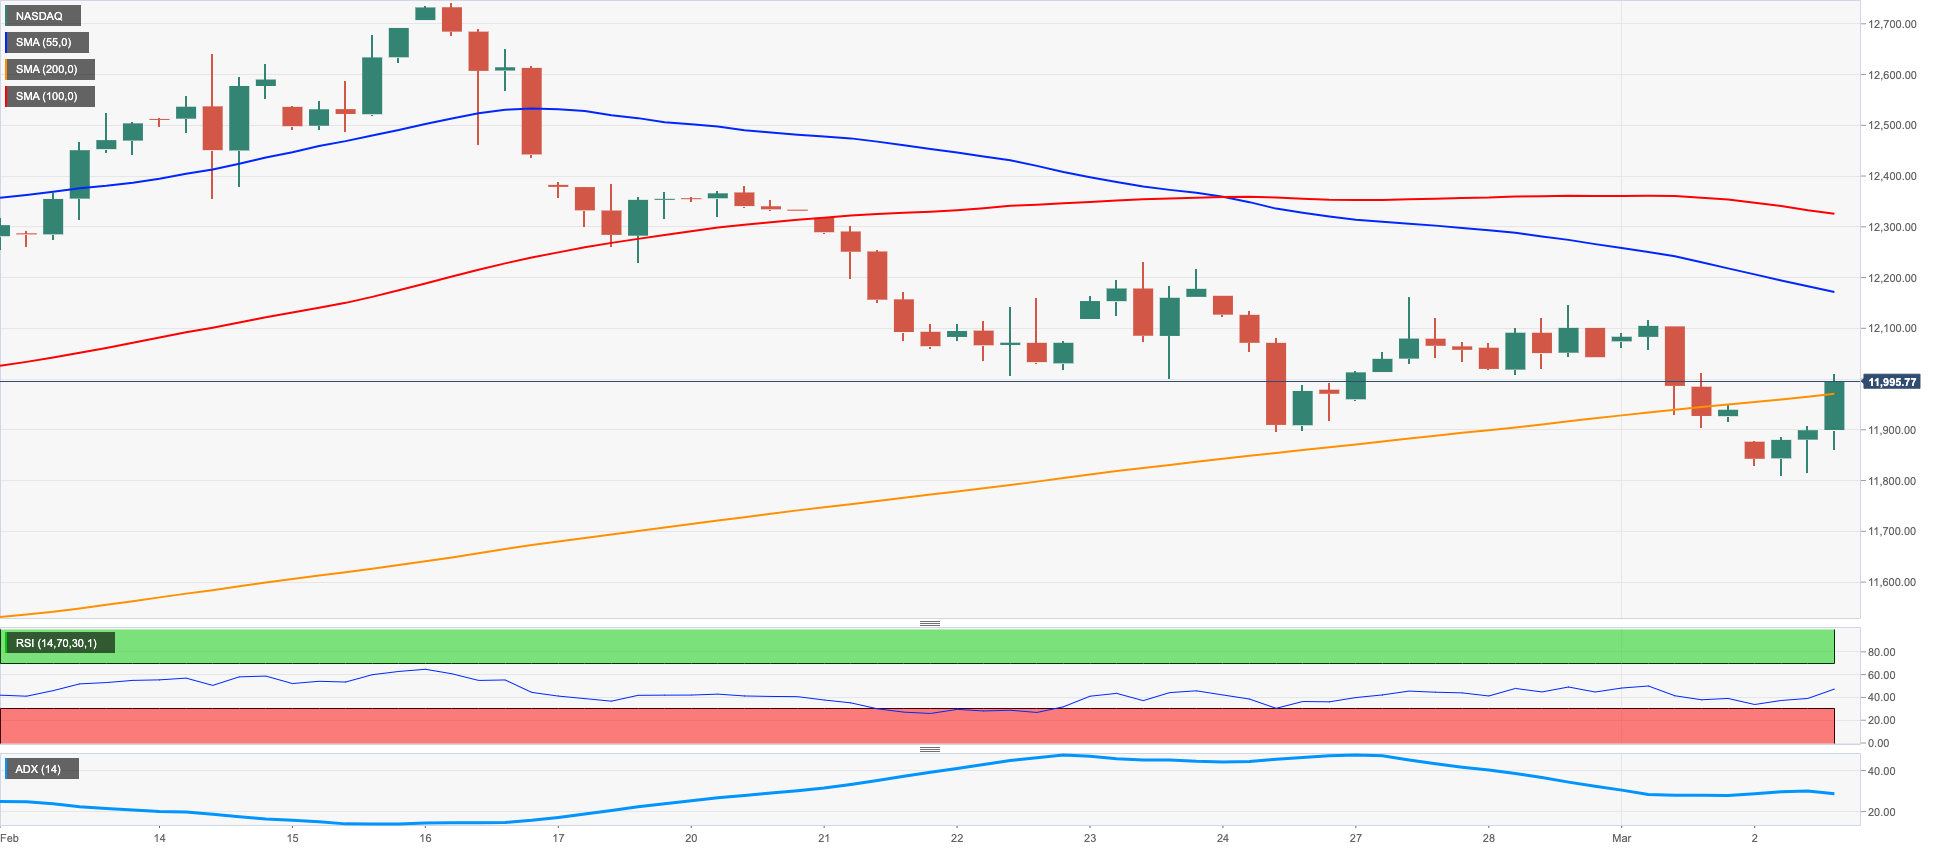
After bottoming out in 5-week lows near 11800, the tech reference Nasdaq 100 staged a marked comeback and poked once again with the key 12000 region on Thursday.
The index managed to shrug off negative news around EV car maker Tesla and joined the rest of the US stock indices in the daily advance despite the rally in US yields remained unabated and the greenback resumed the uptrend with quite a marked strength.
If the Nasdaq 100 breaks below the weekly low at 11830 (March 2) it could then dispute the 55- and 100-day SMAs at 11736 and 11578, respectively, ahead of weekly lows at 11550 (January 25) and 11251 (January 19). A deeper retracement could see the 2023 low at 10696 (January 6) and the December 2022 low at 10671 (December 22) retested. For all that, the immediate resistance level comes at the 2023 top at 12880 (February 2) prior to the round level at 13000 and the weekly peak at 13175 (August 26 2022). The daily RSI edged a tad higher north of the 47 level.
Top Gainers: DexCom, Old Dominion Freight Line Inc, Illumina
Top Losers: Tesla, Micron, Lucid Group
Resistance levels: 12239 12689 12880 (4H chart)
Support levels: 11830 11550 11251 (4H chart)
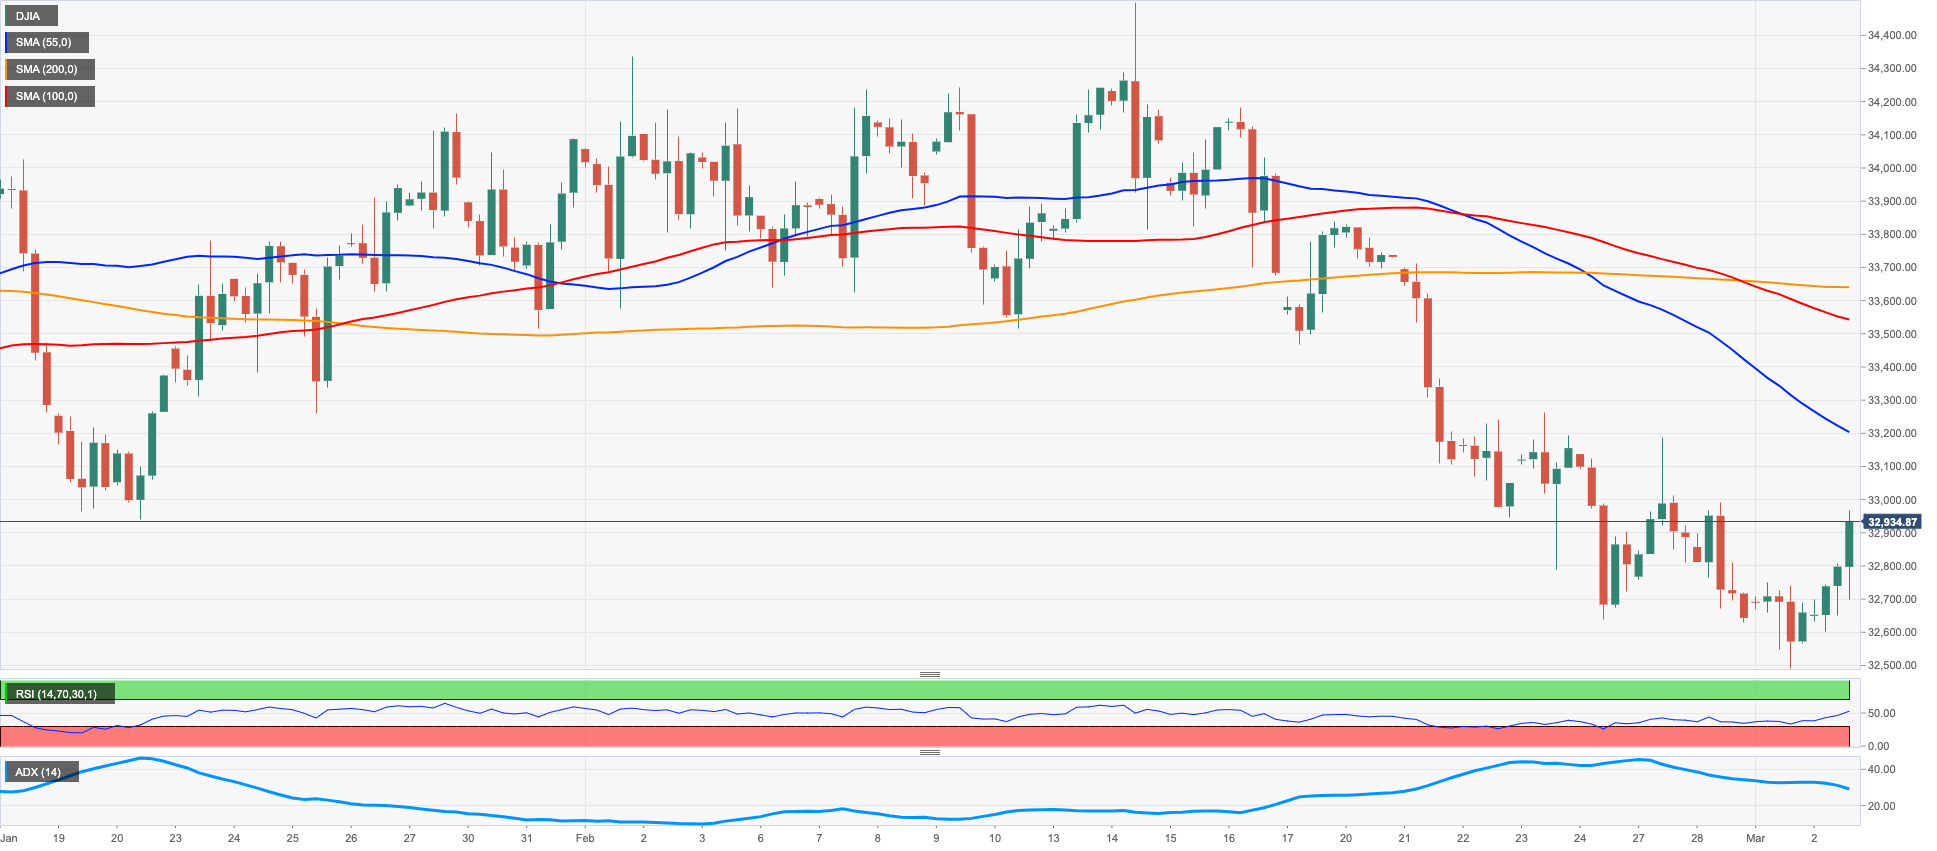
DOW JONES
US equities gauged by the Dow Jones printed modest gains and left behind Wednesday’s inconclusive price action, managing at the same time to flirt with the key 33000 mark on Thursday.
In the meantime, investors remain cautious against the backdrop of further signs of a healthy US economy, a still tight labour market, hawkish narrative from Fed’s policy makers and speculation that the Fed may remain in the restrictive territory for longer than initially estimated.
All in all, the Dow Jones gained 0.57% to 32847 the S&P500 advanced 0.17% to 3957 and the tech-benchmark Nasdaq Composite rose 0.01% to 11381.
Further downside pressure could force the Dow to confront the 2023 low at 32500 (March 1) followed by the key 200-day SMA at 32362 and the November 2022 low at 31727 (November 3). The other way around, the 100- and 55-day SMAs at 33048 and 33525, respectively, are expected to offer provisional resistance ahead of the 2023 peak at 34342 (January 13) and the December 2022 high at 34712 (December 13). North from here emerges the April 2022 top at 35492 (April 21) prior to the February 2022 peak at 35824 (February 9). The daily RSI rebounded to the proximity of 41.
Top Performers: Salesforce Inc, McDonald’s, Boeing
Worst Performers: 3M, JPMorgan Walgreen Boots
Resistance levels: 33015 33616 34334 (4H chart)
Support levels: 32500 31727 30206 (4H chart)
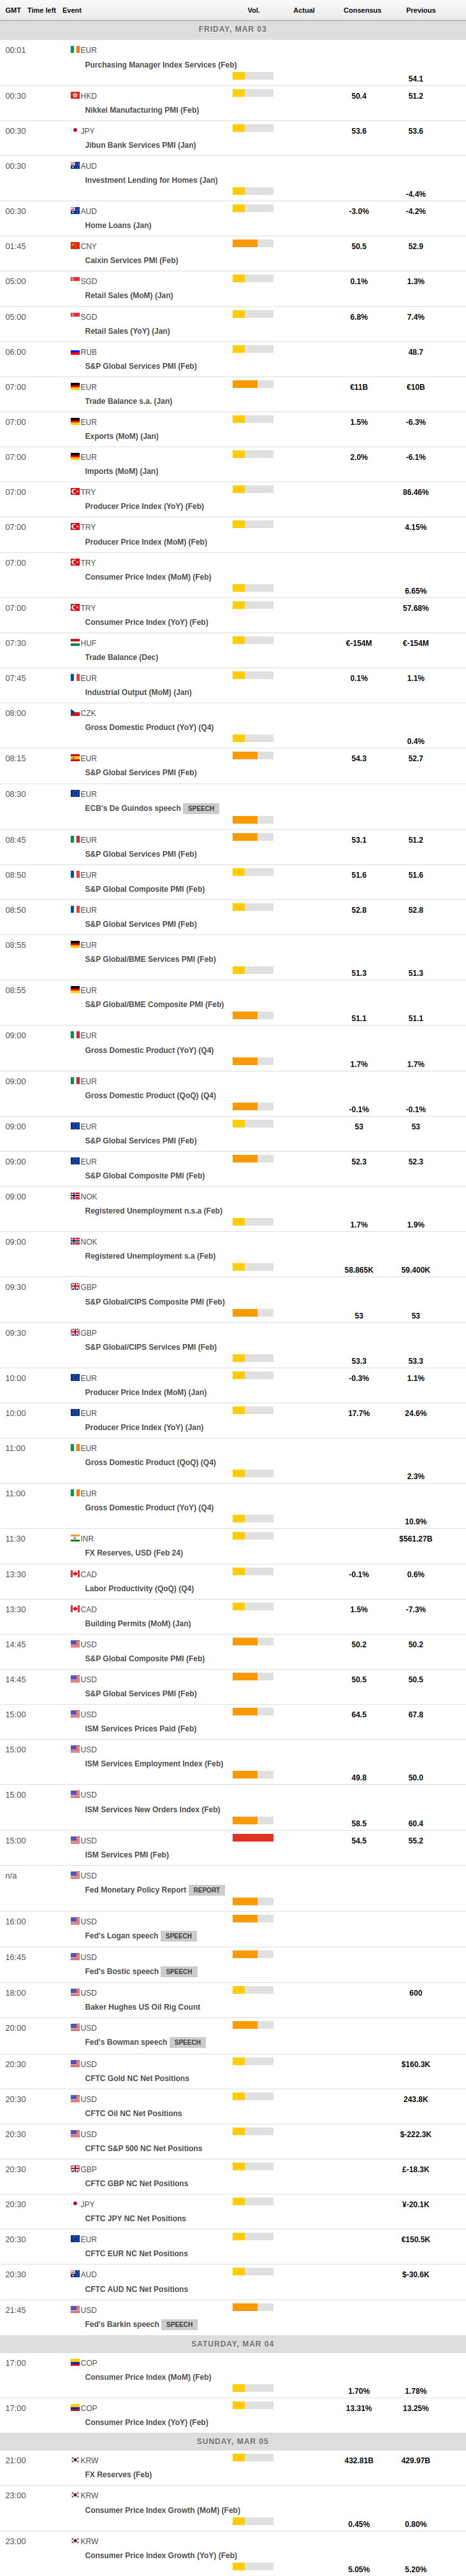
MACROECONOMIC EVENTS
All Information & Updates provided by:

All information relating to the financial markets available on this page has been prepared and issued by FXStreet (Forexstreet SL, Spain, Reg: B62498233) on the basis of publicly available information and all information believed to be reliable and does not conflict with Kuwaiti local laws, and all necessary care has been taken to before the company to ensure that the facts mentioned are correct from the source.
NCM Investment nor any of its directors or employees shall in any way be held responsible for the contents of this news, and the information contained on this page is intended only to provide clients with publicly available information and should not be construed as investment advice, report or analysis and/or constitute an offer or invitation to buy or sell financial instruments of any kind.
RISK WARNING: Forex and CFDs are highly risky leveraged products, as losses can exceed deposits. Please ensure you understand all the risks and take independent advice if necessary. NCM will segregate the clients based on the criteria of the regulator and its bylaws. NCM does not provide any advisory service; the material published does not constitute advice or a recommendation for a transaction in any financial instrument. NCM accepts no responsibility for any use of the content presented and any consequences of that use. Anyone acting on the information provided does so at their own risk.