
- Contact Us:
-

-

-

-


Daily Market Updates
06 Mar 2023
USDJPY
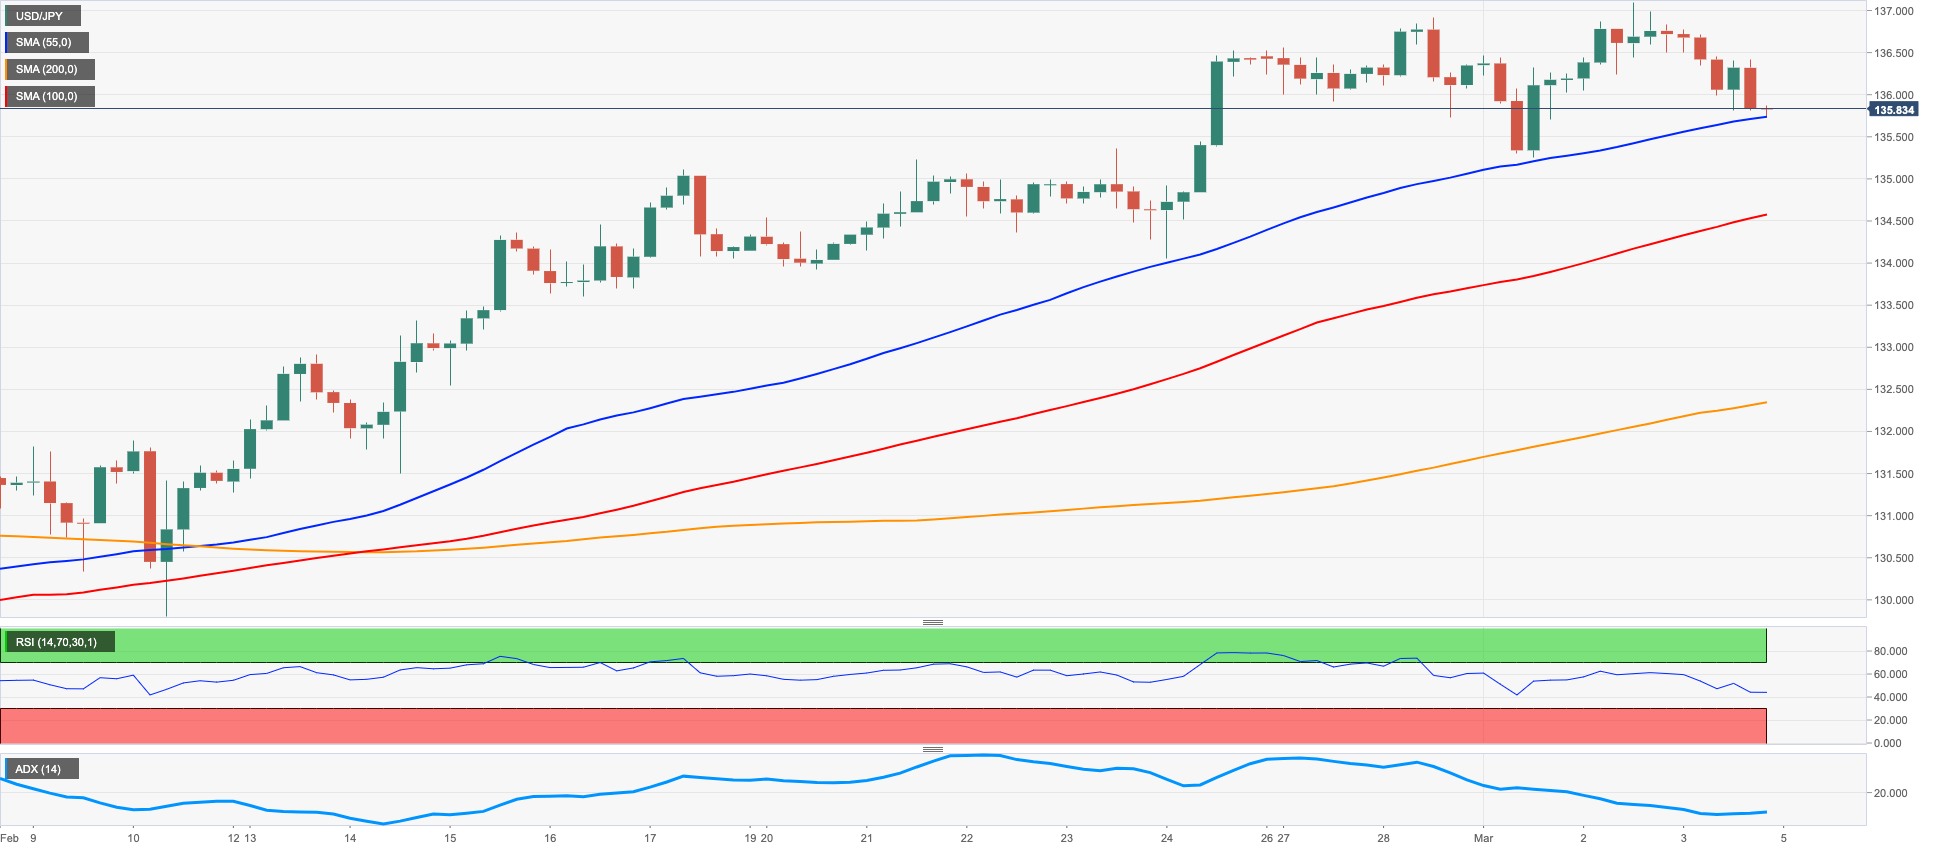
USD/JPY traded on the defensive and breached the 136.00 support to print 2-day lows at the end of the week.
The renewed and marked decline in the pair came in response to the equally strong retracement in the greenback, while the corrective decline in US yields across the curve also collaborated with the bearish note on Friday.
No changes to the consolidation phase in the JGB 10-year yields, which kept hovering around the 0.50% zone.
In the Japanese calendar, the Unemployment Rate eased to 2.4% in January and the Jobs/Applications Ratio held steady at 1.35 in the same month. In addition, the final Jibun Bank Services PMI edged higher to 54.0 in February (from 52.3).
Further gains in USD/JPY need to surpass the 2023 peak at 137.10 (March 2). Once cleared, the pair could then challenge the key 200-day SMA at 137.29 prior to weekly highs at 138.17 (December 15 2022) and 139.89 (November 30 2022) ahead of the key round level at 140.00. On the other hand, there is a minor support at the 134.05 level (February 24) seconded by the provisional 55-day SMA at 132.16 and the weekly low at 129.79 (February 10). The breakdown of this level could put the February low at 128.08 (February 2) to the test before the 2023 low at 127.21 (January 16) and the May 2022 low at 126.36 (May 24). The daily RSI debilitated to the 61 region.
Resistance levels: 137.10 137.47 138.17 (4H chart)
Support levels: 135.25 134.05 132.82 (4H chart)
GBPUSD
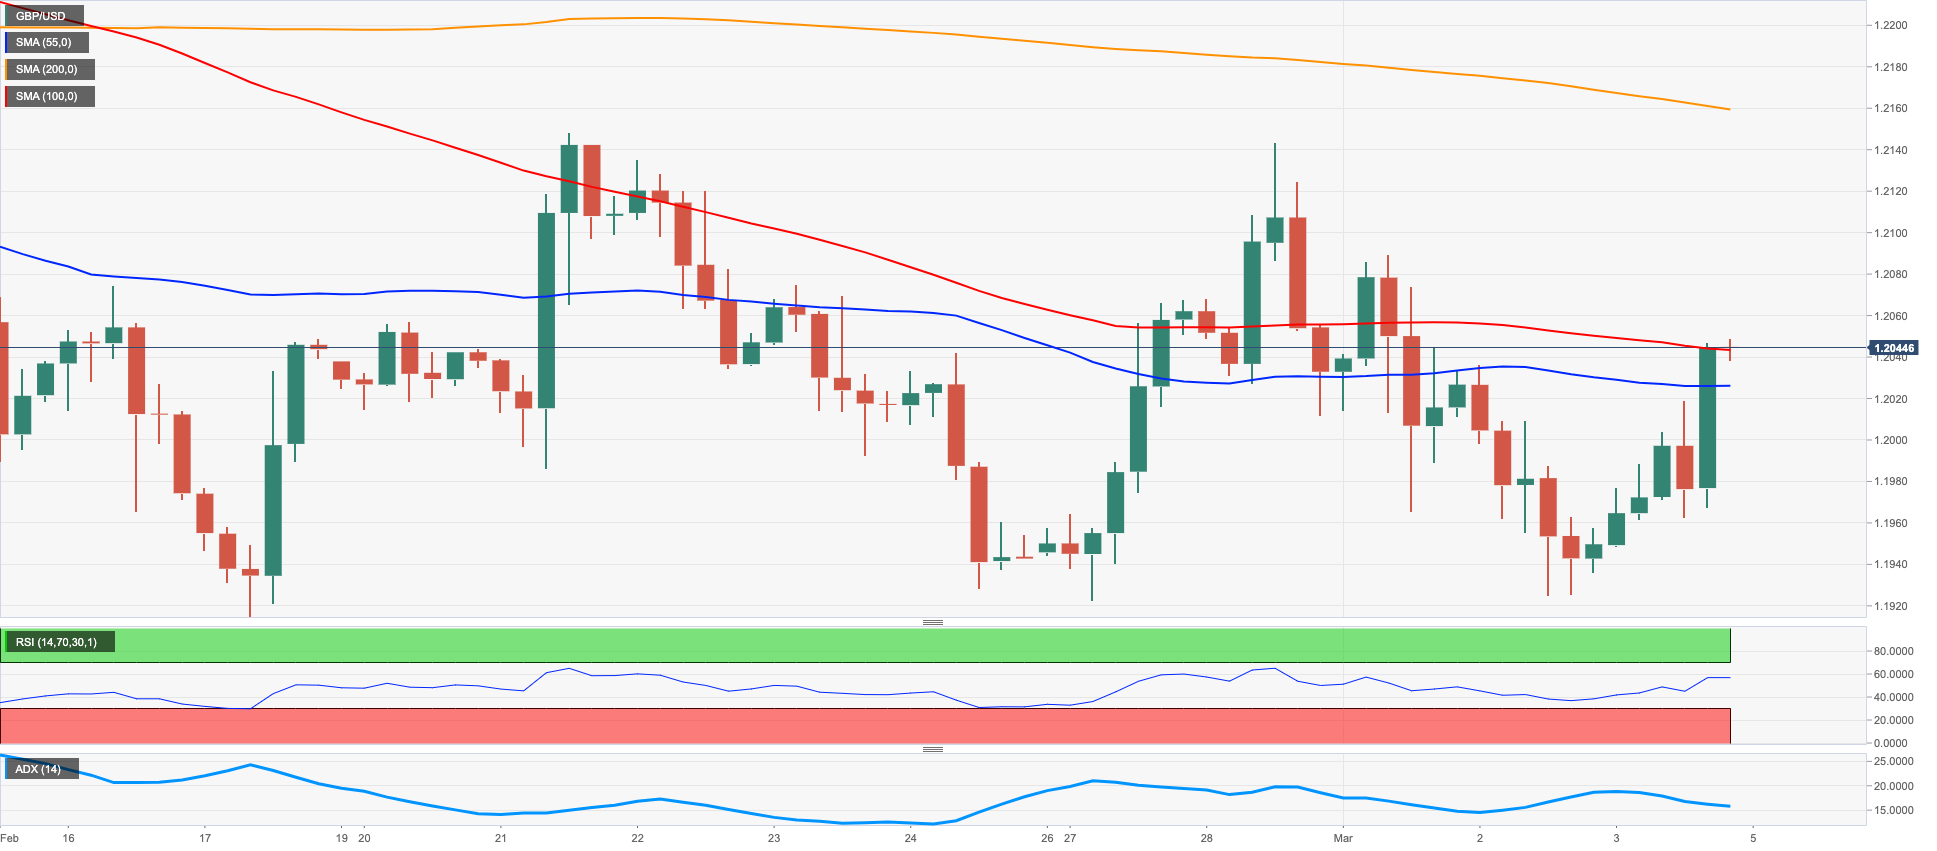
GBP/USD extended further the ongoing consolidative theme and rebounded from the 1.1940 zone to test levels well past the key 1.2000 the figure, or 2-day highs, at the end of the week.
The equally erratic performance in the greenback saw the USD Index (DXY) surrender part of Thursday’s pronounced advance and thus lend wings to the risk complex in general and encourage the quid to keep business above the significant 200-day SMA (1.1913).
In the UK bond market, and in line with their peers, the 10-year Gilt yields gave away part of the multi-week strong advance to the 3.90% zone, the highest level since late October 2022.
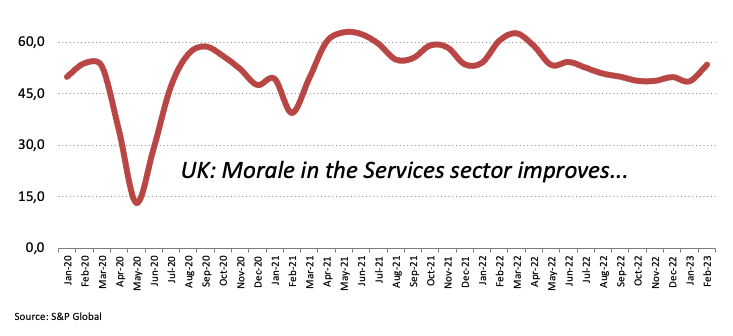
In the UK, the final S&P Global Services PMI improved to 53.5 in February in what was the sole release in the calendar on Friday.
GBP/USD appears side-lined for the time being. That said, there is an initial contention at the February low at 1.1914 (February 17), which appears in turn bolstered by the key 200-day SMA at 1.1913. The breach of this region exposes a probable drop to the 2023 low at 1.1841 (January 6) ahead of the November 2022 low at 1.1142 (November 4). Just the opposite, the interim 55-day SMA at 1.2133 precedes the weekly top at 1.2147 (February 21), all prior to another weekly peak at 1.2269 (February 14). Further up aligns the 2023 high at 1.2447 (January 23) prior to the May 2022 top at 1.2666 (May 27) and the 200-week SMA at 1.2881, all before the psychological 1.3000 mark. The daily RSI advanced north of the 47 region.
Resistance levels: 1.2048 1.2088 1.2143 (4H chart)
Support levels: 1.1924 1.1914 1.1841 (4H chart)
AUDUSD
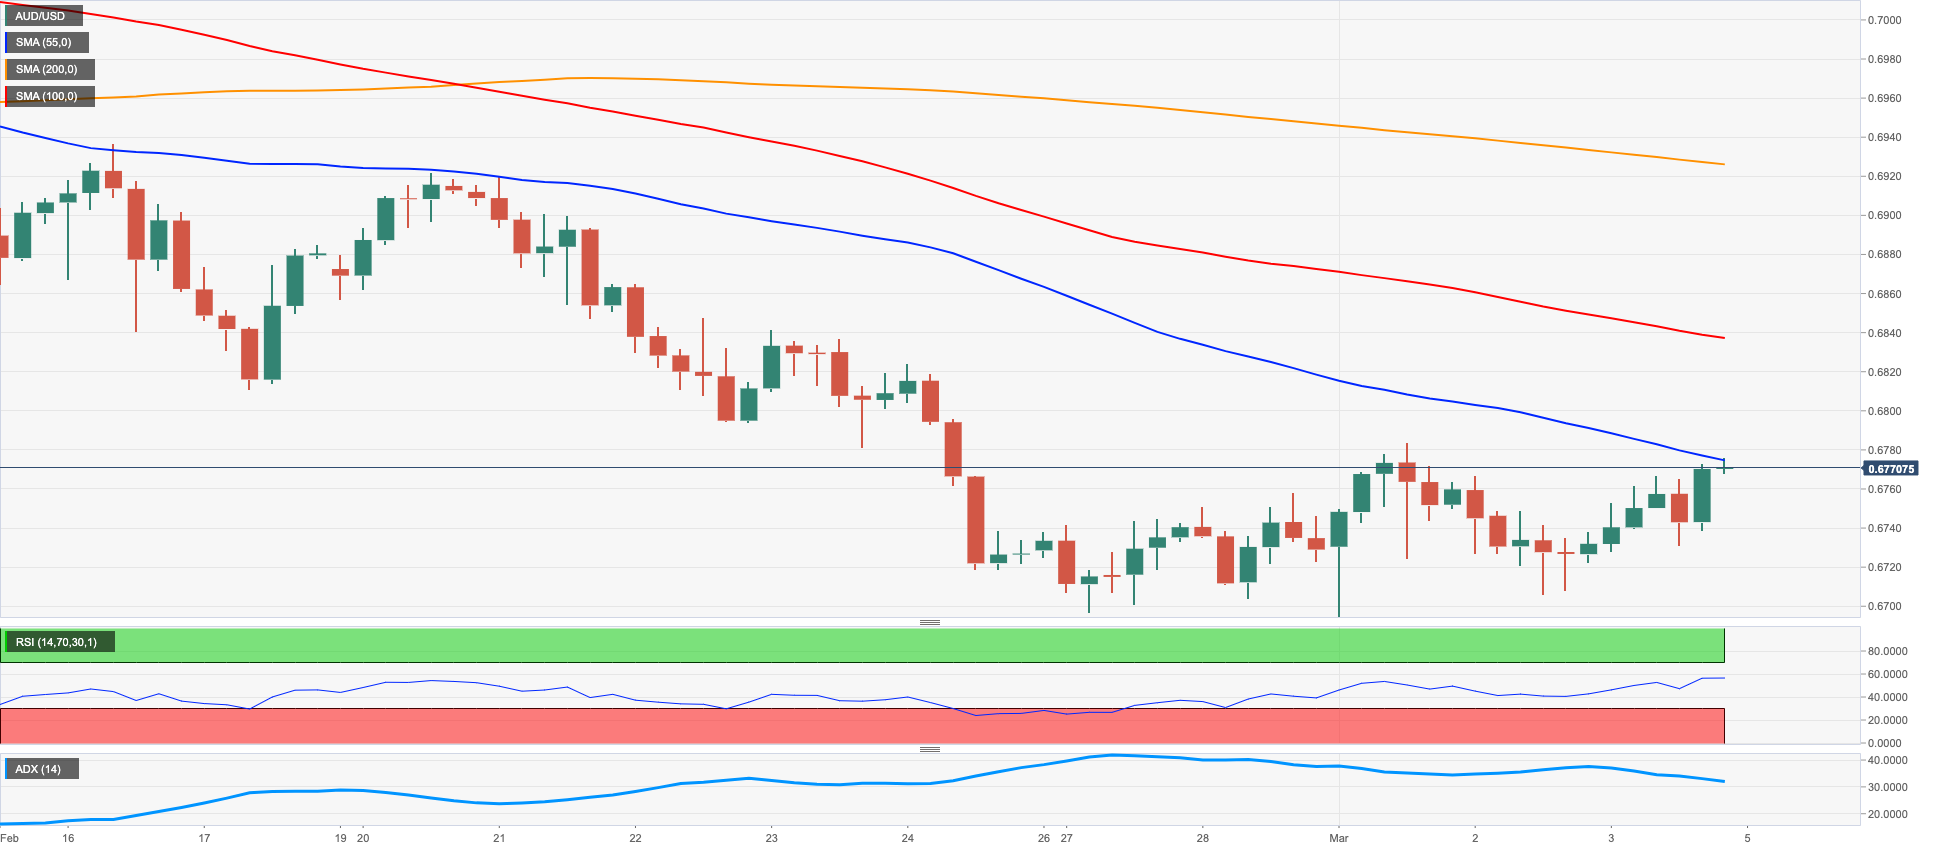
AUD/USD rose to 2-day highs near 0.6780 and maintained the inconsistent price action for yet another session on Friday.
Indeed, the pair left behind the previous pullback and rebounded almost exclusively on the back of the moderate retracement in the greenback, while the broad-based poor performance in the commodity complex saw copper prices and the iron ore recede marginally, all somewhat limiting upside in the Aussie dollar.
Data wise Down Under, Home Loans shrank at a monthly 4.9% in January and Investment Lending for Homes contracted 6.0% MoM in the same period.
Extra weakness in AUD/USD should revisit the March low at 0.6694 (March 1) ahead of the 2023 low at 0.6688 (January 3) and the December 2022 low at 0.6629 (December 20). A deeper drop could then prompt a test of the weekly low at 0.6584 (November 21 2022) to emerge on the horizon. In the opposite direction, the weekly peak at 0.6783 (March 1) appears reinforced by the key 200-day SMA at 0.6789 prior to the temporary 55-day SMA at 0.6877 and the weekly high at 0.6920 (February 20). The surpass of this level could motivate the pair to confront the weekly top at 0.7029 (February 14) before the 2023 peak at 0.7157 (February 2) and the round level at 0.7200, all ahead of the June 2022 high at 0.7282 (June 3). The daily RSI picked up pace and trespassed the 41 level.
Resistance levels: 0.6783 0.6841 0.6920 (4H chart)
Support levels: 0.6694 0.6688 0.6650 (4H chart)
GOLD
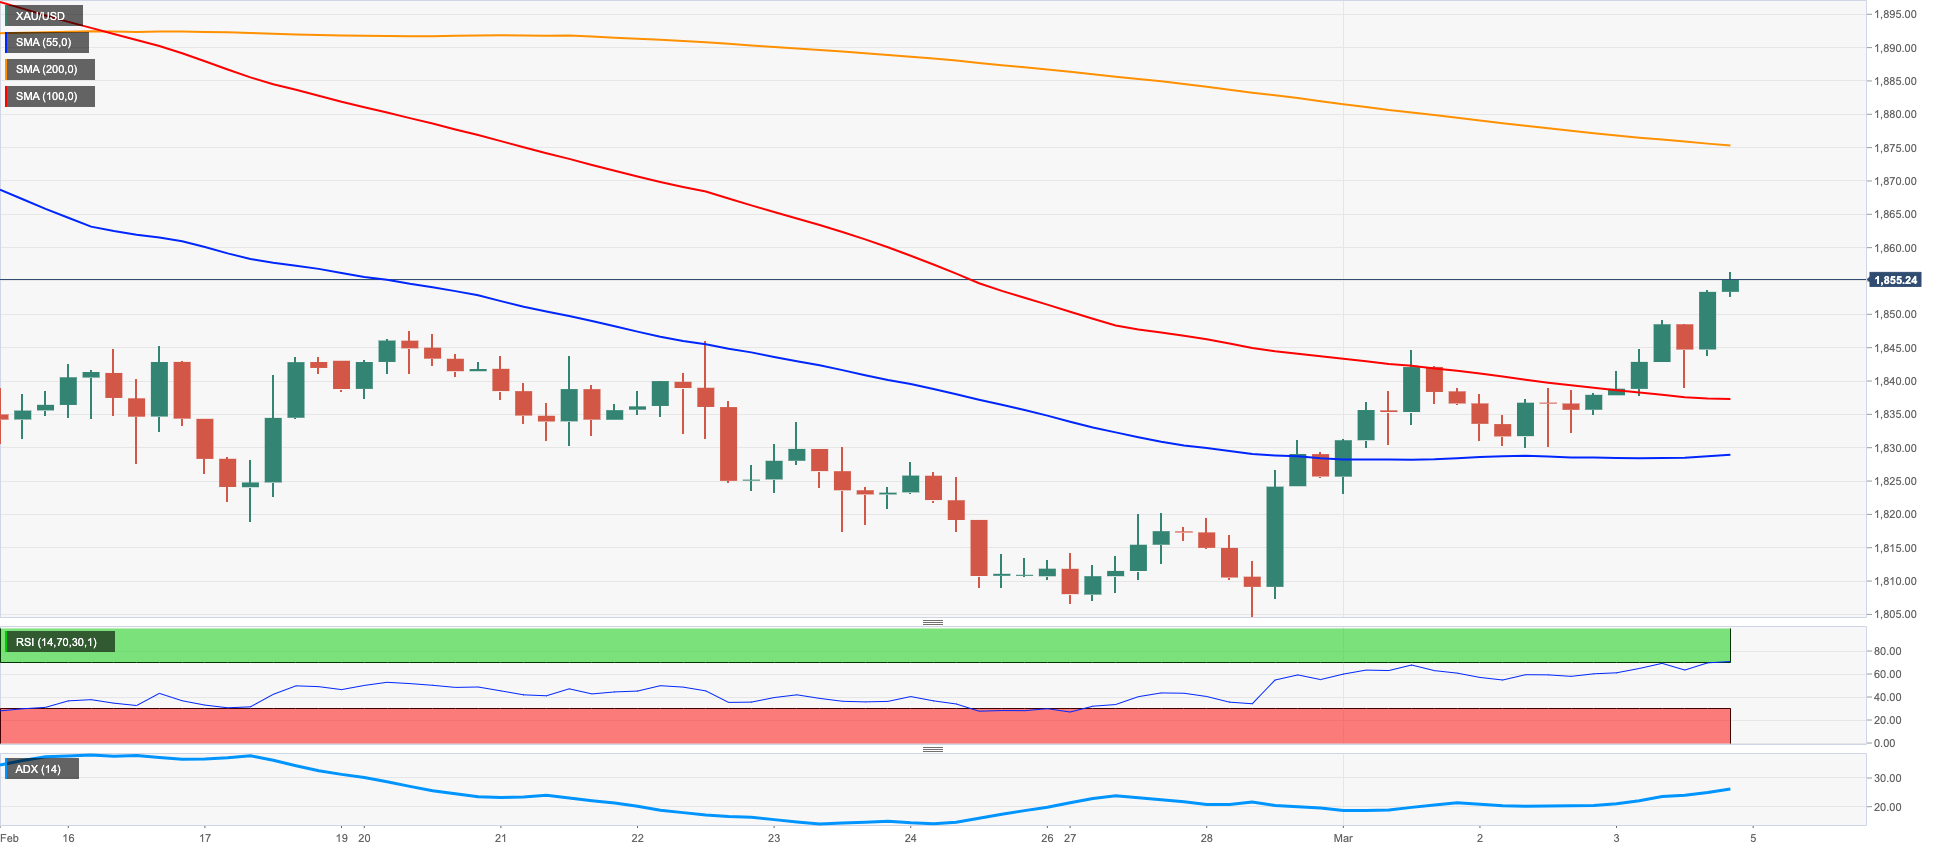
The combination of a weaker dollar and declining US yields boosted the demand for the safe haven metal and lifted prices above the $1850 mark per ounce troy on Friday, or new 2-week highs.
In fact, fresh selling pressure hurt the greenback and forced the USD Index (DXY) to rapidly leave behind Thursday’s advance and revisit the mid-104.00s in response to the better mood around the risk complex.
Furthermore, the multi-week rally in US yields entered a pause-mode on Friday, as investors seem to have cashed up some of the recent strong gains.
In the meantime, price action around the precious metal is poised to keep tracking developments surrounding the upcoming Fed and ECB monetary policy meetings, while near-term volatility should also follow messages from Fed’s rate setters.
Immediately to the upside for gold emerges the temporary 55-day SMA at $1861 prior to the weekly high at $1890 (February 9) and the 2023 top at $1959 (February 2). Beyond this level comes the April 2022 peak at $1998 (April 18) closely followed by the psychological $2000 level and the 2022 high at $2070 (March 8). By contrast, the 2023 low at $1804 (February 28) precedes the key $1800 zone and looks propped up by the interim 100-day SMA at $1797. If the yellow metal clears this level, it could then put the key 200-day SMA at $1775 to the test ahead of the weekly low at $1727 (November 23) and the November 2022 low at $1616 (November 3).
Resistance levels: $1856 $1870 $1890 (4H chart)
Support levels: $1828 $1804 $1784 (4H chart)
CRUDE WTI
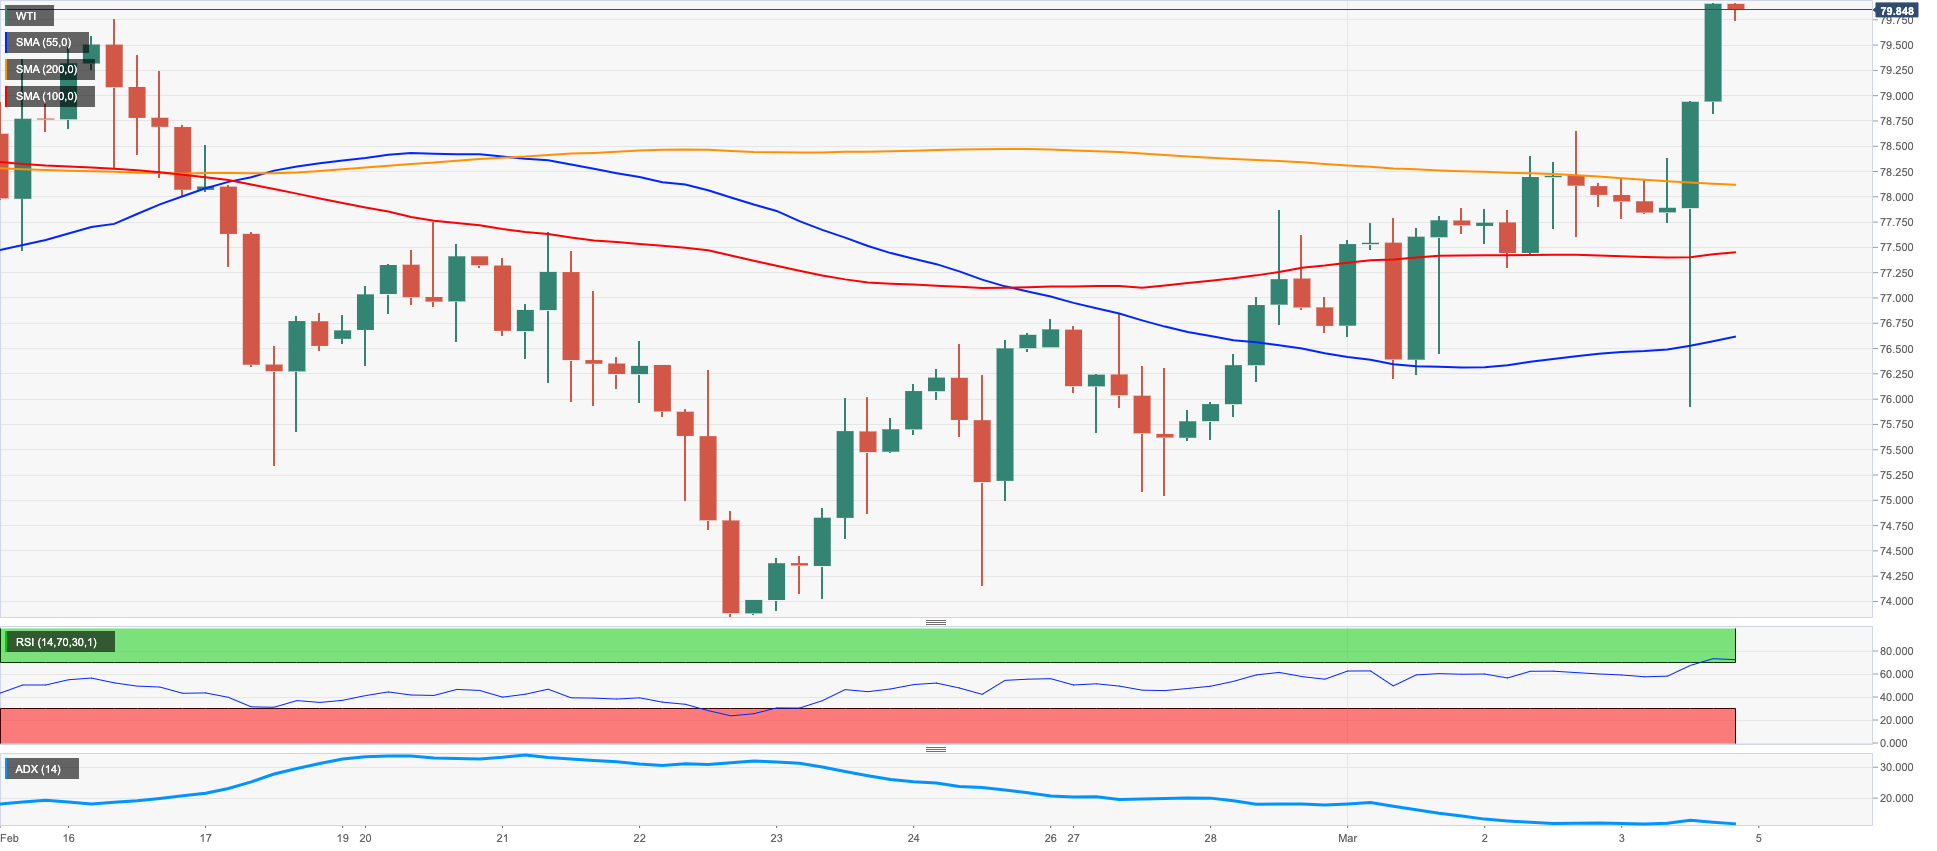
Friday’s volatile session saw crude oil prices drop sharply to the vicinity of the $75.00 mark per barrel of the WTI following rumours that the UAE could be planning to leave OPEC.
However, that speculation soon fizzled out and gave way to a bout of strength on the back of the already better tone in the risk complex, while the persistent loss of momentum in the dollar added to the acute comeback to levels just shy of the key $80.00 mark.
Further buying interest came from the positive outlook for crude oil demand amidst the Chinese reopening, which was reinforced by auspicious results from fundamentals released earlier in the week as well as rising imports of Russian oil.
In the calendar, driller Baker Hughes reported another drop in US oil rig count, this time by 8, totalling 592 US active oil rigs in the week to March 3.
The WTI now trades at shouting distance from the key $80.00 mark per barrel. The breakout of this zone should rapidly test the February high at $80.57 (February 13) followed by the 2023 top at $82.60 (January 23) and the December 2022 peak at $83.32 (December 1). Further north emerges the $90.08 level (November 11 2022) prior to the November 2022 high at $93.73 (November 7). In the opposite direction, the weekly low at $73.83 (February 22) should hold the initial test ahead of the 2023 low at $72.30 (February 6) and the 2022 low at $70.10 (December 9). The breakdown of this level could put a test of the key round level at $70.00 back to the traders’ radar.
Resistance levels: $79.85 $80.57 $82.44 (4H chart)
Support levels: $75.80 $74.96 $74.06 (4H chart)
GER40
European equities extended the upbeat mood in the second half of the week and navigated a “sea of green” on Friday.
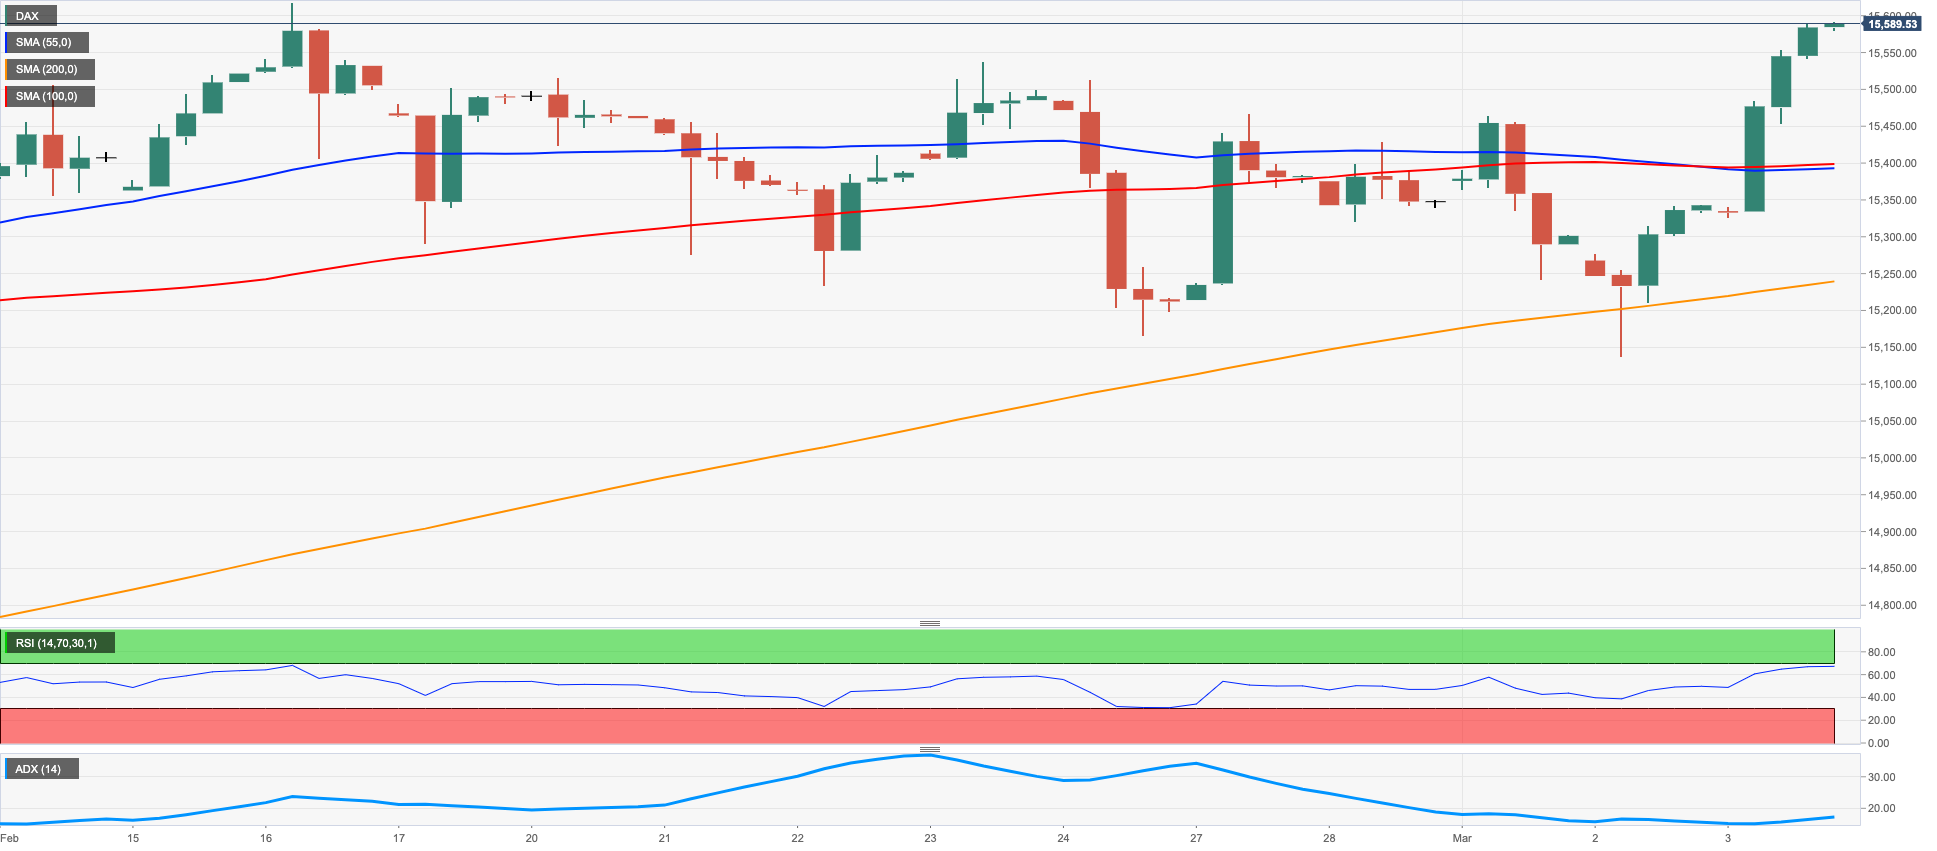
Following its peers, the German benchmark index DAX40 approached the 15600 level and closed at shouting distance from levels last seen at the beginning of 2022 on the back of the generalized optimism among investors.
In fact, Chinese positive results early in the Asian session coupled with the firm note in the European services sector boosted the sentiment and bolstered further the upside in the stock markets.
In the German money market, the key 10-year Bund yields corrected lower and slipped back below the 2.70% following five consecutive sessions with gains.
In the docket, the trade surplus widened to €16.7B in January, with Exports expanding 2.1% MoM and Imports contracting 3.4% MoM. In addition, the final Services PMI ticked a tad higher to 50.9 in February.
In light of the recent price action, the DAX40 now faces the next up-barrier at the 2023 peak at 15658 (February 9) followed by the February 2022 high at 15736 (February 2 2022). North from here comes the round level at 16000 ahead of the 2022 top at 16285 (January 5). The other way around, the weekly low at 15150 (March 2) emerges as the immediate contention before another weekly low at 14906 (January 19), which looks underpinned by the proximity of the temporary 55-day SMA. Further losses could pave the way to a move to the December 2022 low at 13791 (December 20) seconded by the key 200-day SMA at 13795. The daily RSI climbed past the 61 mark.
Best Performers: Volkswagen VZO, Porsche, Continental AG
Worst Performers: Beiersdorf AG, Hannover Rueck SE, RWE AG ST
Resistance levels: 15590 15634 15658 (4H chart)
Support levels: 15150 14906 14837 (4H chart)
NASDAQ
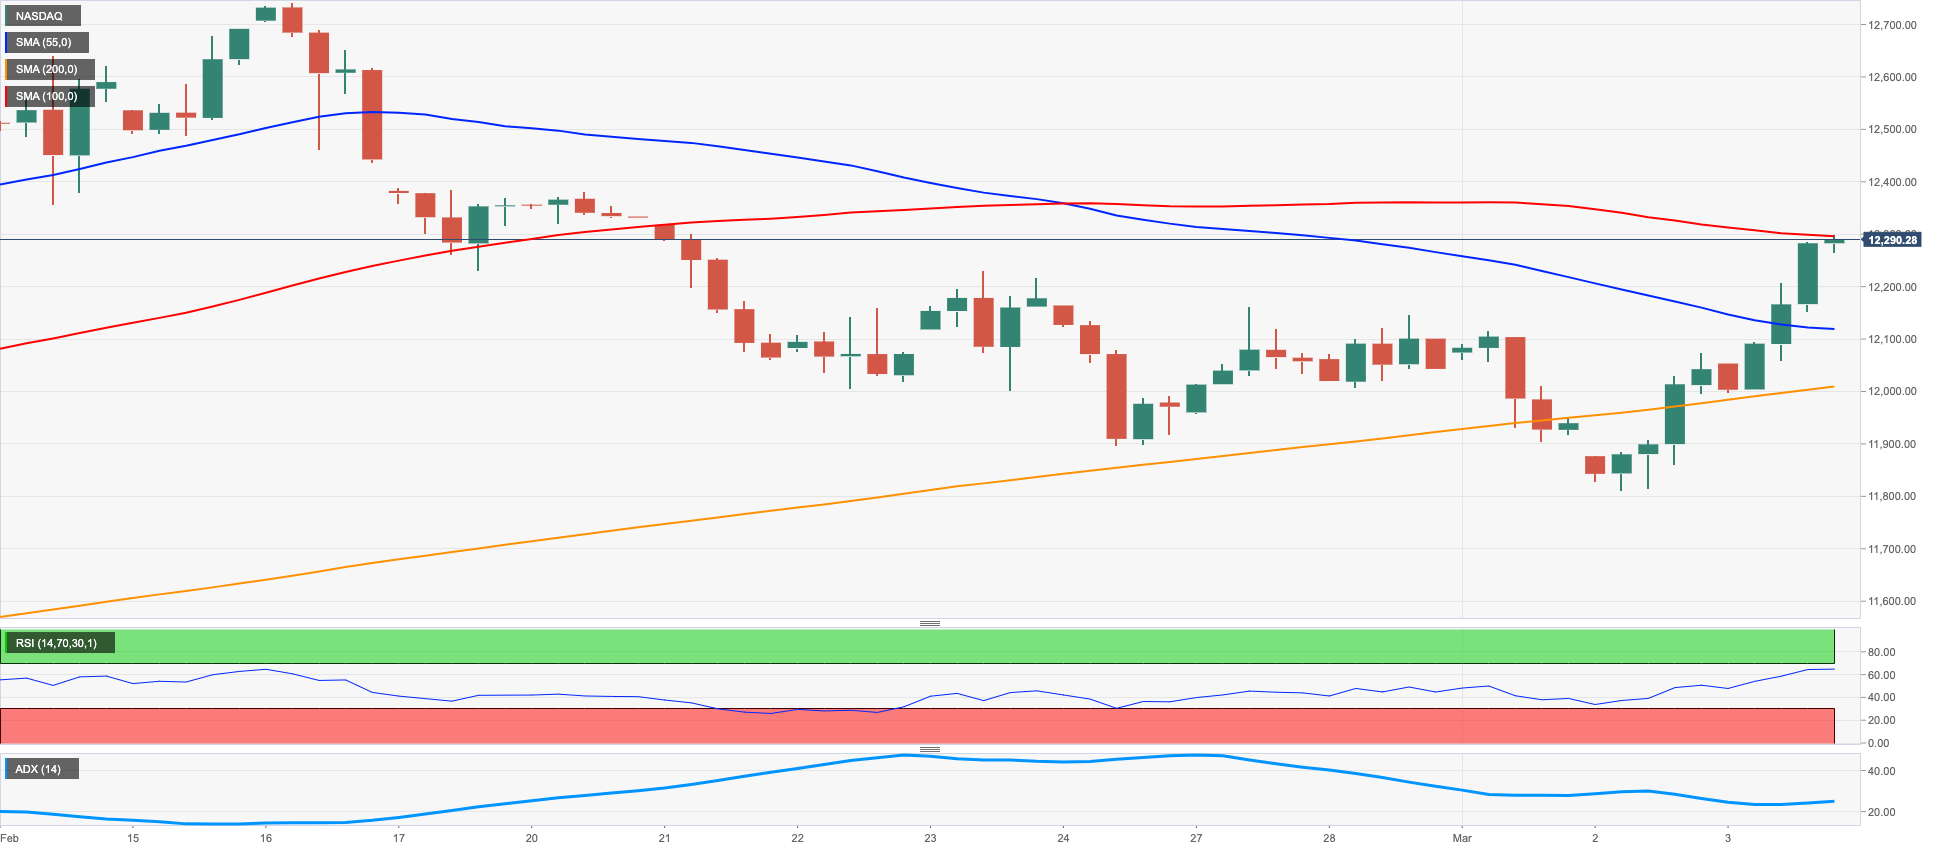
Tech equities gauged by the Nasdaq 100 added to Thursday’s gains and advanced to multi-session tops at the end of the week, flirting at the same time with the 12300 level.
The selling pressure in the greenback in combination with the corrective retracement in US yields across the curve bolstered the strong rebound in the sector, which was also helped by renewed speculation of a Fed’s pivot in the not-so-distant future and the firm note in the risk complex.
Further upside impulse could motivate the Nasdaq 100 to confront the weekly high at 12689 (February 15) just ahead of the 2023 peak at 12880 (February 2), which precedes the round level at 13000 and the weekly high at 13175 (August 26 2022). On the opposite side, the 200-day SMA at 11902 should offer decent contention prior to the weekly low at 11830 (March 2), which is followed by the 55- and 100-day SMAs at 11748 and 11591, respectively. South of this zone appears weekly lows at 11550 (January 25) and 11251 (January 19) before the 2023 low at 10696 (January 6) and the December 2022 low at 10671 (December 22). The daily RSI gathered upside traction and poked with the 55 area.
Top Gainers: Rivian Automotive, Illumina, Atlassian Corp Plc
Top Losers: Zscaler, Marvell, Costco
Resistance levels: 12300 12689 12880 (4H chart)
Support levels: 11830 11580 11251 (4H chart)
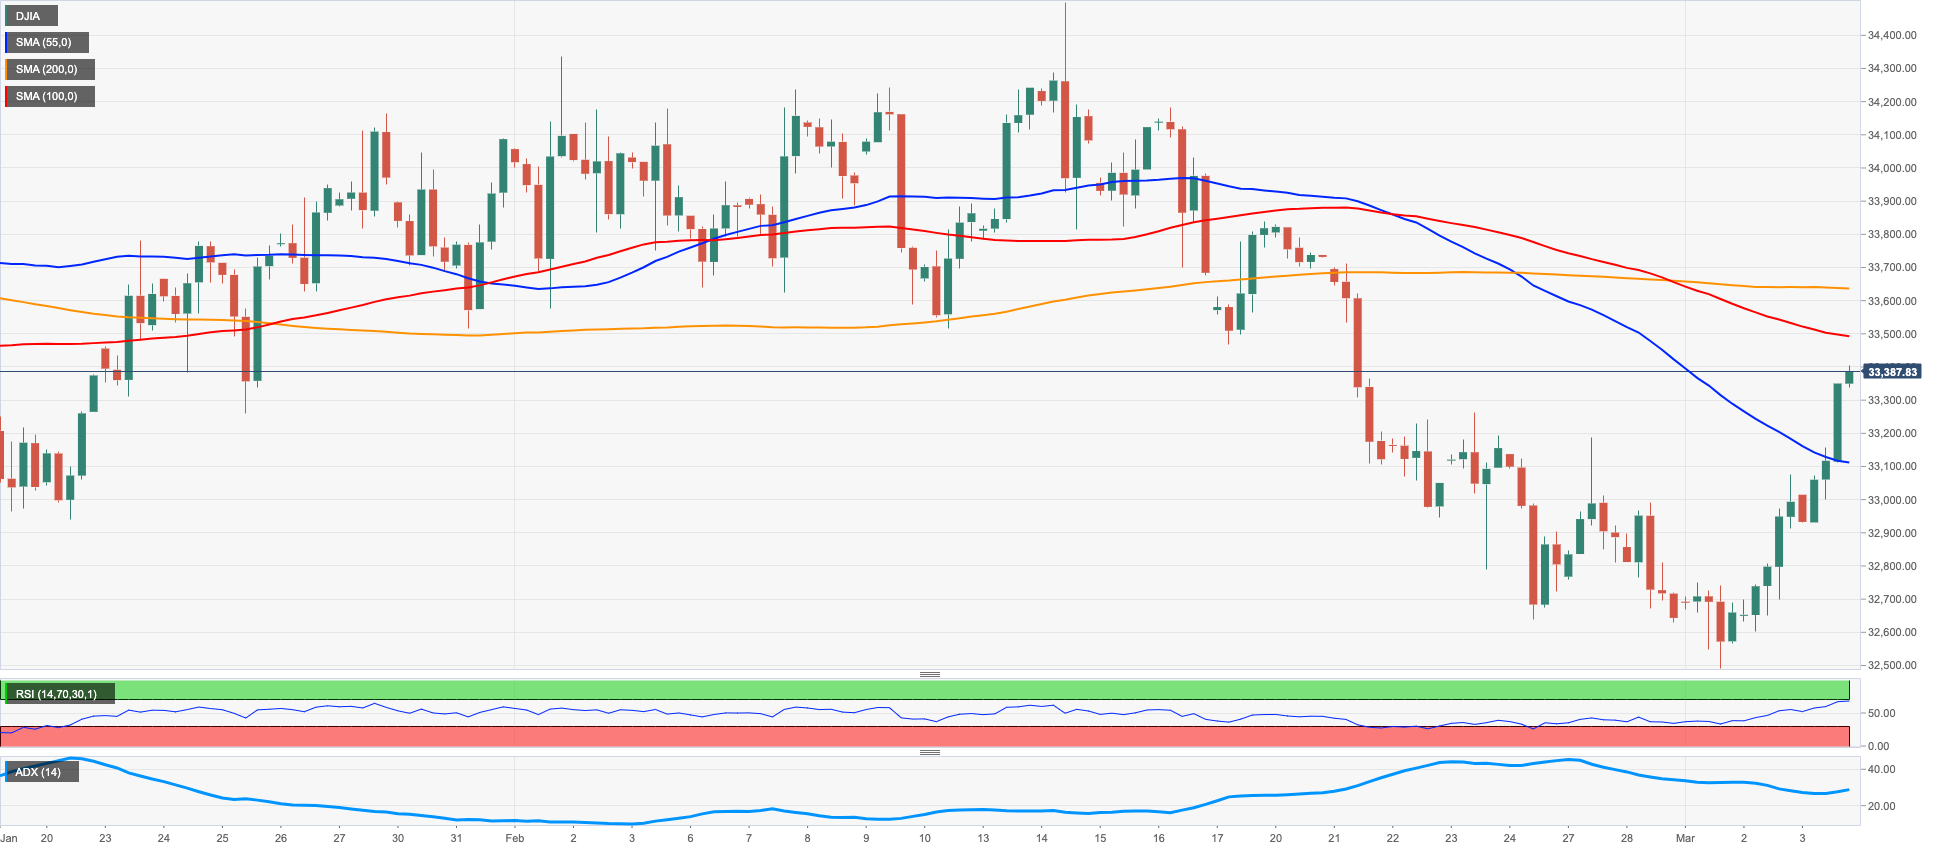
DOW JONES
US equities tracked by the three major US stock indices extended the auspicious start of March on Friday, as speculation of some impasse in the Fed’s normalization cycle appears to have propped up an incipient optimism among investors.
The move higher in the Dow (and the rest of its peers) was also underpinned by the strong retracement in the dollar and the knee-jerk in the US yields across the curve, all submerged into a firm bias towards the risk-linked galaxy.
Overall, the Dow Jones rose 1.17% to 33390 the S&P500 gained 1.62% to 4045 and the tech-heavy Nasdaq Composite advanced 1.97% to 11689.
So far, the Dow Jones appears decently supported by the 200-day SMA, today at 32368. The loss of this key region could put the November 2022 low at 31727 (November 3) to the test ahead of the 2022 low at 28660 (October 13). On the flip side, the immediate resistance aligns at the provisional 55-day SMA at 33516. The break above this level could open the door to the 2023 high at 34342 (January 13) and the December 2022 top at 34712 (December 13). Further up emerges the April 2022 peak at 35492 (April 21) before the February 2022 peak at 35824 (February 9). The daily RSI improved markedly and flirted with the 50 level.
Top Performers: Apple, Boeing, Goldman Sachs
Worst Performers: Coca-Cola, Verizon, Dow
Resistance levels: 33405 33607 34334 (4H chart)
Support levels: 33052 32500 31727 (4H chart)
MACROECONOMIC EVENTS

All Information & Updates provided by:

All information relating to the financial markets available on this page has been prepared and issued by FXStreet (Forexstreet SL, Spain, Reg: B62498233) on the basis of publicly available information and all information believed to be reliable and does not conflict with Kuwaiti local laws, and all necessary care has been taken to before the company to ensure that the facts mentioned are correct from the source.
NCM Investment nor any of its directors or employees shall in any way be held responsible for the contents of this news, and the information contained on this page is intended only to provide clients with publicly available information and should not be construed as investment advice, report or analysis and/or constitute an offer or invitation to buy or sell financial instruments of any kind.
RISK WARNING: Forex and CFDs are highly risky leveraged products, as losses can exceed deposits. Please ensure you understand all the risks and take independent advice if necessary. NCM will segregate the clients based on the criteria of the regulator and its bylaws. NCM does not provide any advisory service; the material published does not constitute advice or a recommendation for a transaction in any financial instrument. NCM accepts no responsibility for any use of the content presented and any consequences of that use. Anyone acting on the information provided does so at their own risk.