
- Contact Us:
-

-

-

-


Daily Market Updates
07 Mar 2023
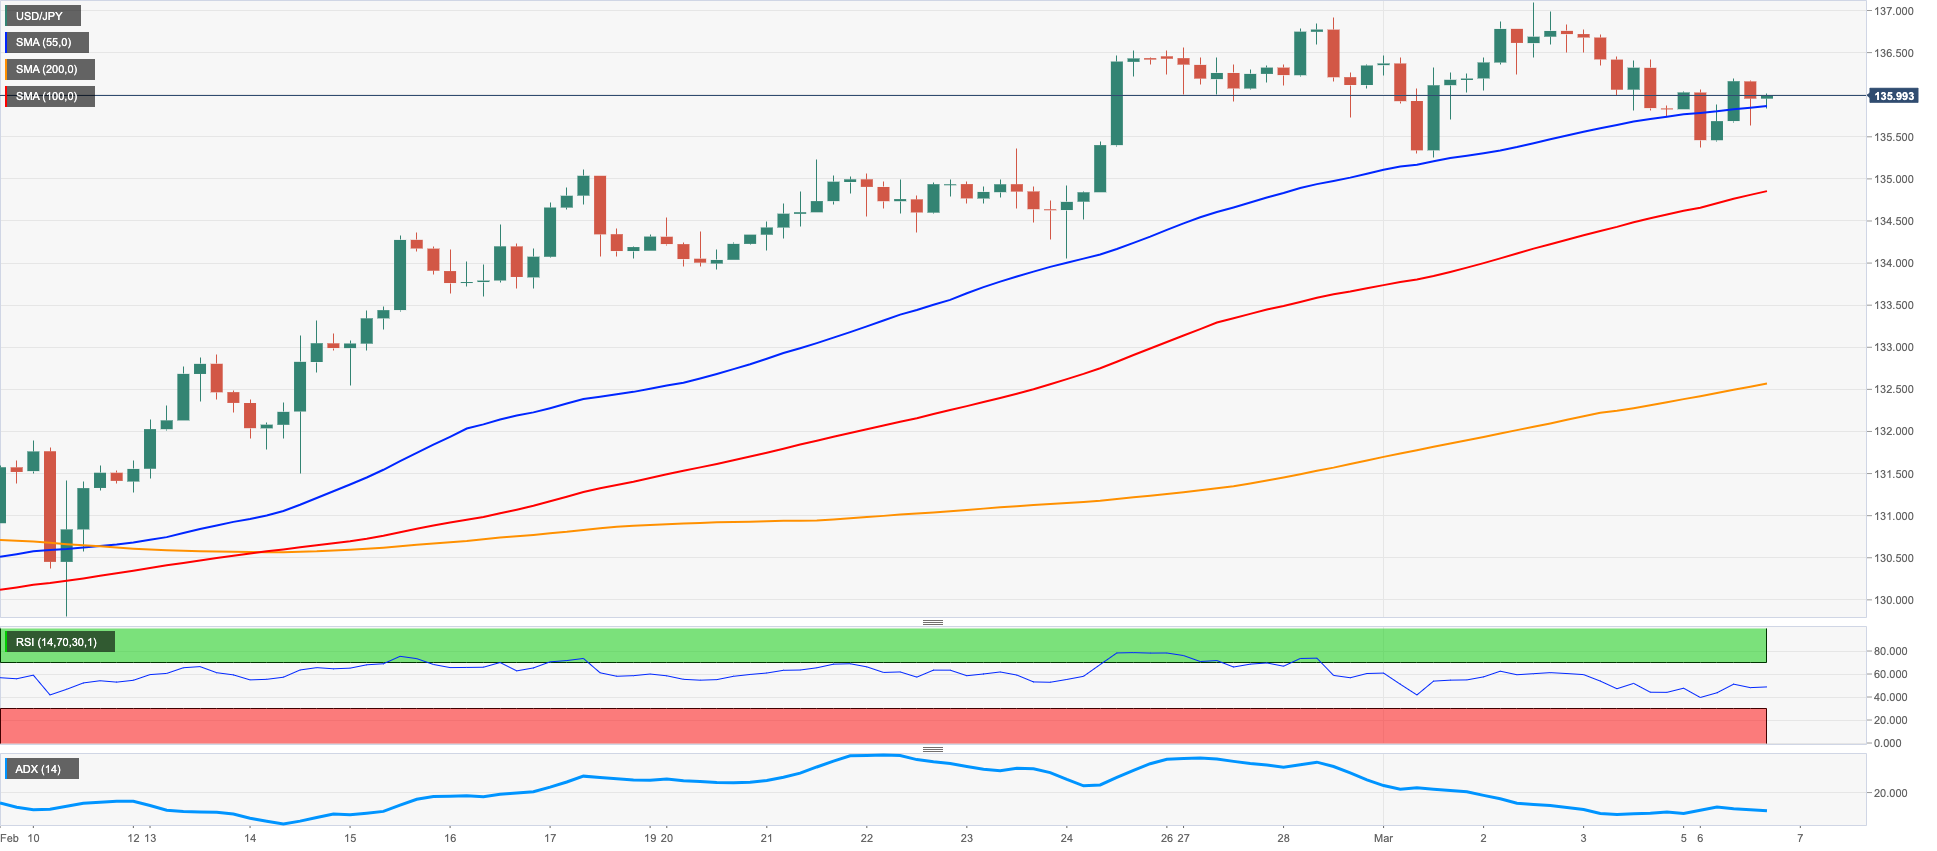
USDJPY
The small recovery in US yields seems to have been enough to sponsor decent gains in USD/JPY at the beginning of the week.
In fact, spot managed to regain the area just above the 136.00 hurdle on the back of the late rebound in US yields and despite the dollar extending further Friday’s corrective decline.
In Japan, yields of the JGB 10-year remained broadly side-lined around the 0.50% region, the upper end of the YCC band.
The Japanese calendar was empty on Monday.
The resumption of the upside bias in USD/JPY should challenge the 2023 high at 137.10 (March 2) just above the key 200-day SMA at 137.33. The breakout of the latter exposes a probable visit to weekly tops at 138.17 (December 15 2022) and 139.89 (November 30 2022) prior to the key round level at 140.00. Just the opposite, the 134.05 level (February 24) should hold the initial test before the provisional 55-day SMA at 132.14 and the weekly low at 129.79 (February 10). South from here emerges the February low at 128.08 (February 2) ahead of the 2023 low at 127.21 (January 16) and the May 2022 low at 126.36 (May 24). The daily RSI edged marginally higher and approached the 63 mark.
Resistance levels: 137.10 137.47 138.17 (4H chart)
Support levels: 135.25 134.05 132.82 (4H chart)
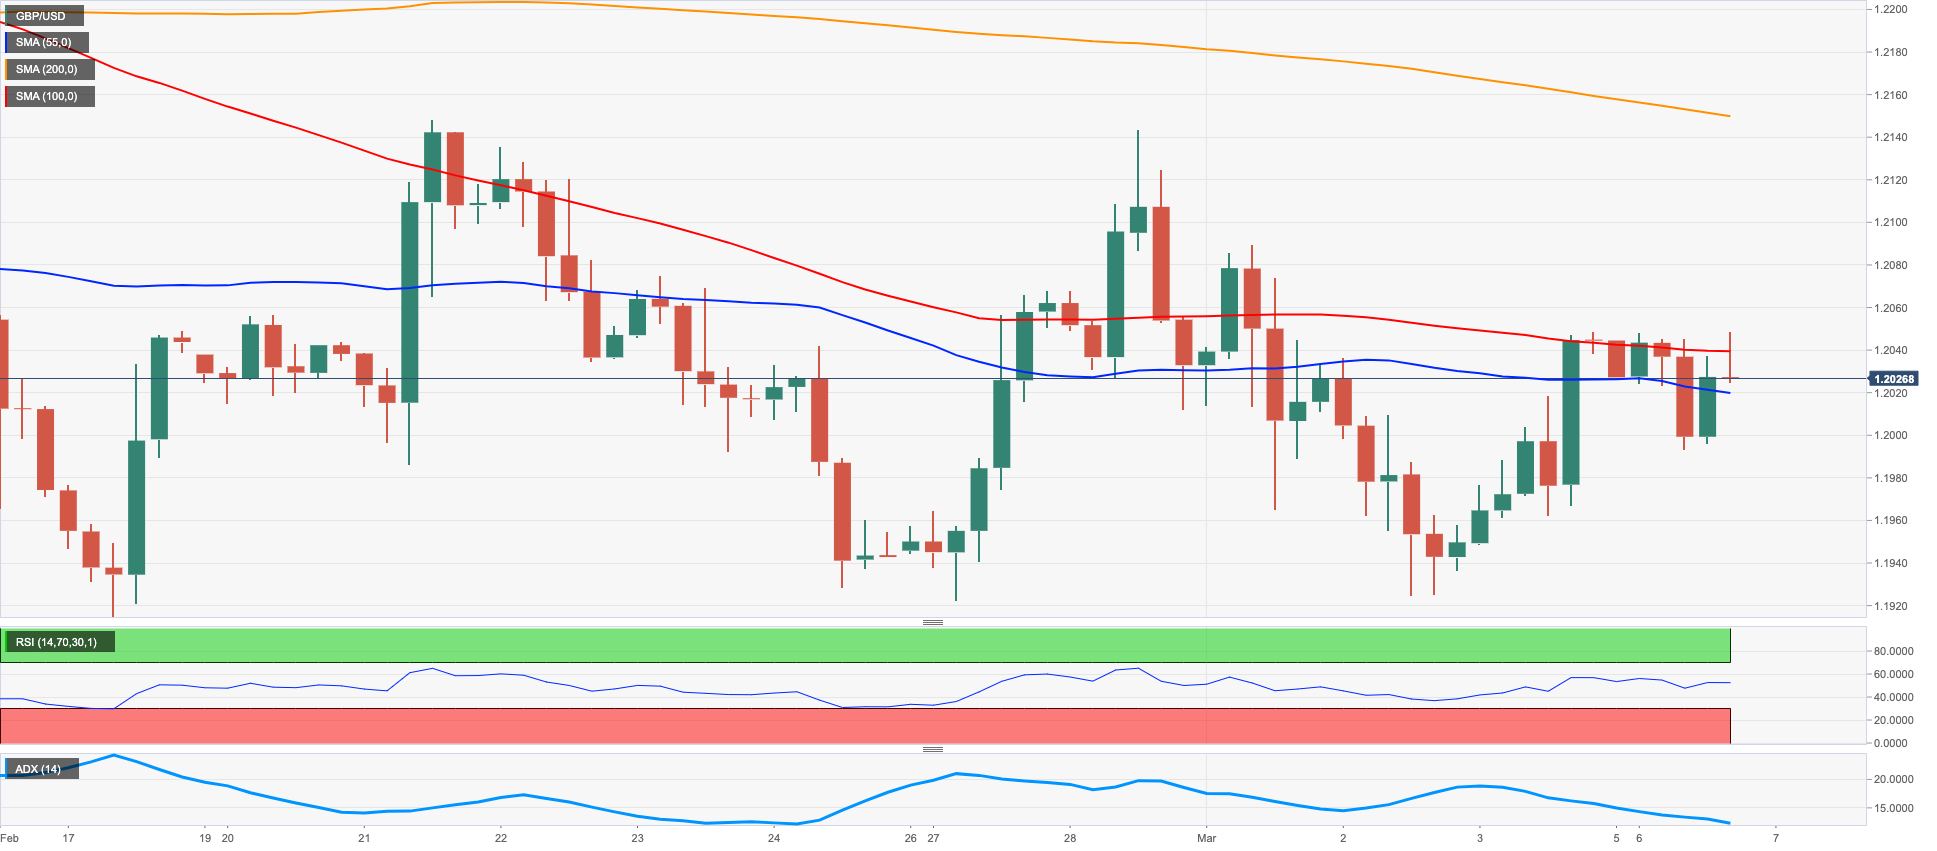
GBPUSD
GBP/USD kept the protracted range bound theme well in place for yet another session at the beginning of the week, this time coming under some tepid selling pressure in spite of the moderate retracement in the dollar.
Indeed, Cable hovered around the low-1.2000s on Monday following extra losses in the greenback which forced the USD Index (DXY) to return to the 104.20/15 band at its worst moment in the day.
In line with the rest of their peers, the 10-year Gilt yields met some upside pressure and reversed Friday’s retracement, managing at the same time to flirt with the 3.90% area.
Data wise in the UK, New Car Sales expanded at an annualized 26.2% in February and the Construction PMI improved to 54.6 during last month.
GBP/USD faces the immediate support at the February low at 1.1914 (February 17), which remains propped up by the key 200-day SMA at 1.1910. Down from here comes the 2023 low at 1.1841 (January 6) prior to the November 2022 low at 1.1142 (November 4). For all that, the immediate up-barrier emerges at the temporary 55-day SMA at 1.2131 closely followed by the weekly peak at 1.2147 (February 21). The surpass of this level puts a potential test of another weekly high at 1.2269 (February 14) back on the investors’ radar before the 2023 top at 1.2447 (January 23) and the May 2022 peak at 1.2666 (May 27). North from here aligns the 200-week SMA at 1.2876 ahead of the psychological 1.3000 mark. The daily RSI deflated to the sub-47 region.
Resistance levels: 1.2048 1.2143 1.2159 (4H chart)
Support levels: 1.1924 1.1914 1.1841 (4H chart)
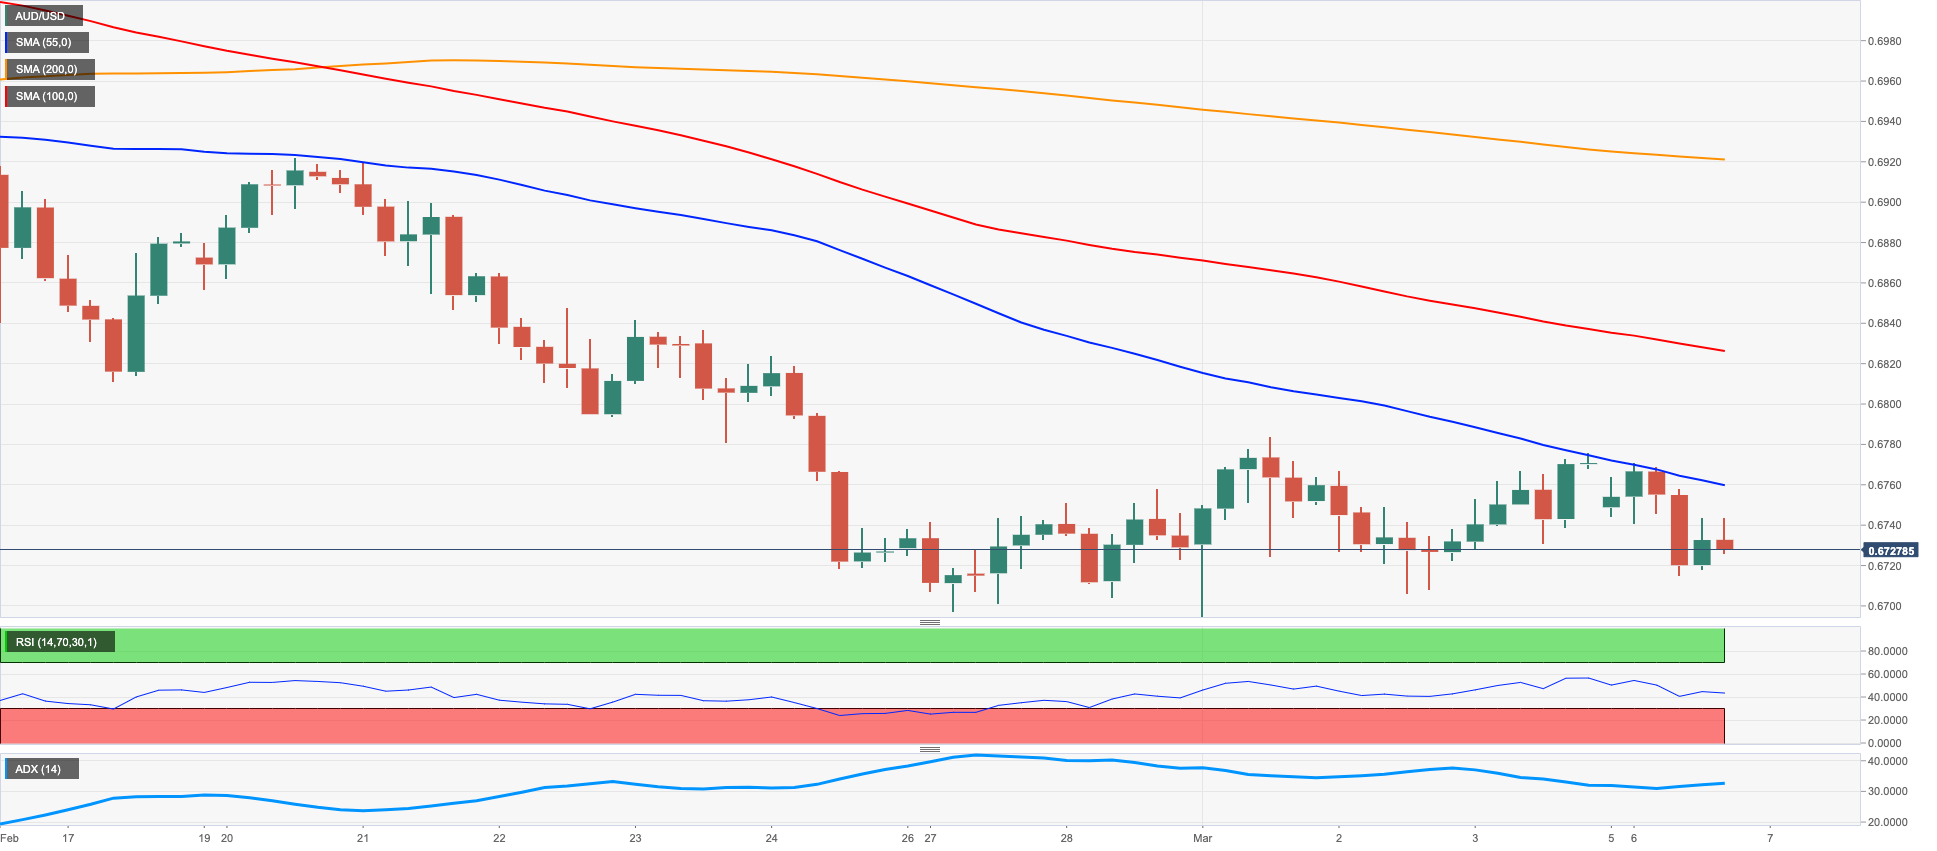
AUDUSD
AUD/USD maintained the erratic performance well in place and started the week on the defensive, trading in a bearish note just above 0.6700 the figure on Monday.
Despite the negative tone in the greenback, the Aussie dollar could not take any advantage from that and traded with strong losses in the low-0.6700s mainly after China set a GDP target of around 5% for the current year, which disappointed investors.
The slight advance in the commodity complex, in the meantime, did nothing to help AUD either.
Extra cautiousness, in the meantime, weighed on investors ahead of the RBA monetary policy meeting on March 7, where the central bank is expected to raise the OCR by 25 bps.
There were no data releases scheduled in Oz on Monday.
AUD/USD could see its losses accelerate on a breach of the March low at 0.6694 (March 1). That said, the next support of note emerges at the 2023 low at 0.6688 (January 3) ahead of the December 2022 low at 0.6629 (December 20) and the weekly low at 0.6584 (November 21 2022). On the other hand, the weekly high at 0.6783 (March 1) remains propped up by the key 200-day SMA at 0.6787. The surpass of this region could confront the provisional 55-day SMA at 0.6878 before the weekly top at 0.6920 (February 20) and the weekly peak at 0.7029 (February 14). Further gains should meet the next hurdle at the 2023 high at 0.7157 (February 2) before the round level at 0.7200 and the June 2022 high at 0.7282 (June 3). The daily RSI deflated to the proximity of 38.
Resistance levels: 0.6783 0.6841 0.6920 (4H chart)
Support levels: 0.6694 0.6688 0.6650 (4H chart)
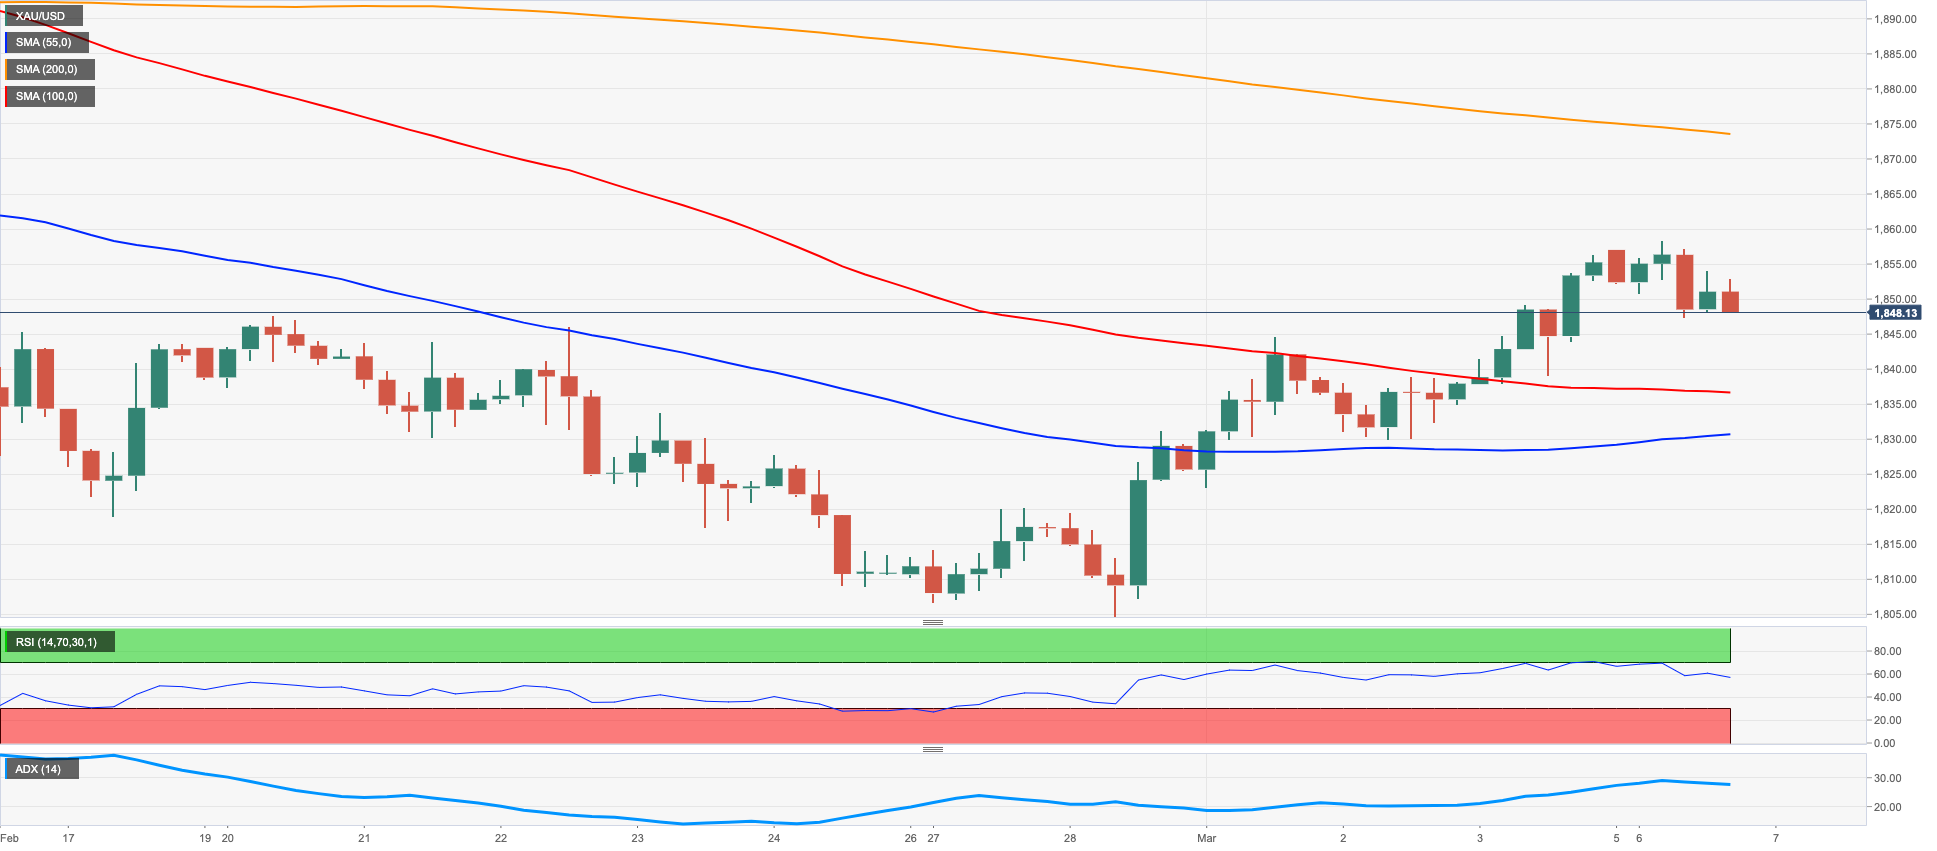
GOLD
Gold prices could not capitalize on the continuation of the selling bias in the greenback and instead succumbed to the rebound in US yields, revisiting at the same time the $1850 region per ounce troy on Monday.
Indeed, the USD Index (DXY) traded on the defensive for the second session in a row and deflated to 3-day lows near the 104.00 neighbourhood at the beginning of the week.
The precious metal, however, gave away part of Friday’s strong gains in response to the U-turn in USD yields across the curve, which managed to reverse the initial pessimism and resume the ongoing multi-week advance.
Next risk event for bullion is expected to come from the semiannual testimony by Chief Powell before Congress on Tuesday and Wednesday ahead of the release of the US jobs report on Friday.
Next on the upside for gold appears the provisional 55-day SMA at $1862 ahead of the weekly top at $1890 (February 9) and the 2023 peak at $1959 (February 2). Once this level is cleared, the yellow metal could confront the April 2022 high at $1998 (April 18) just before the psychological $2000 level and the 2022 top at $2070 (March 8). In the opposite direction, the 2023 low at $1804 (February 28) remains bolstered by the key $1800 region as well as by the temporary 100-day SMA at $1799. Down from here lines up the key 200-day SMA at $1775 before the weekly low at $1727 (November 23) and the November 2022 low at $1616 (November 3).
Resistance levels: $1858 $1870 $1890 (4H chart)
Support levels: $1830 $1804 $1784 (4H chart)
CRUDE WTI
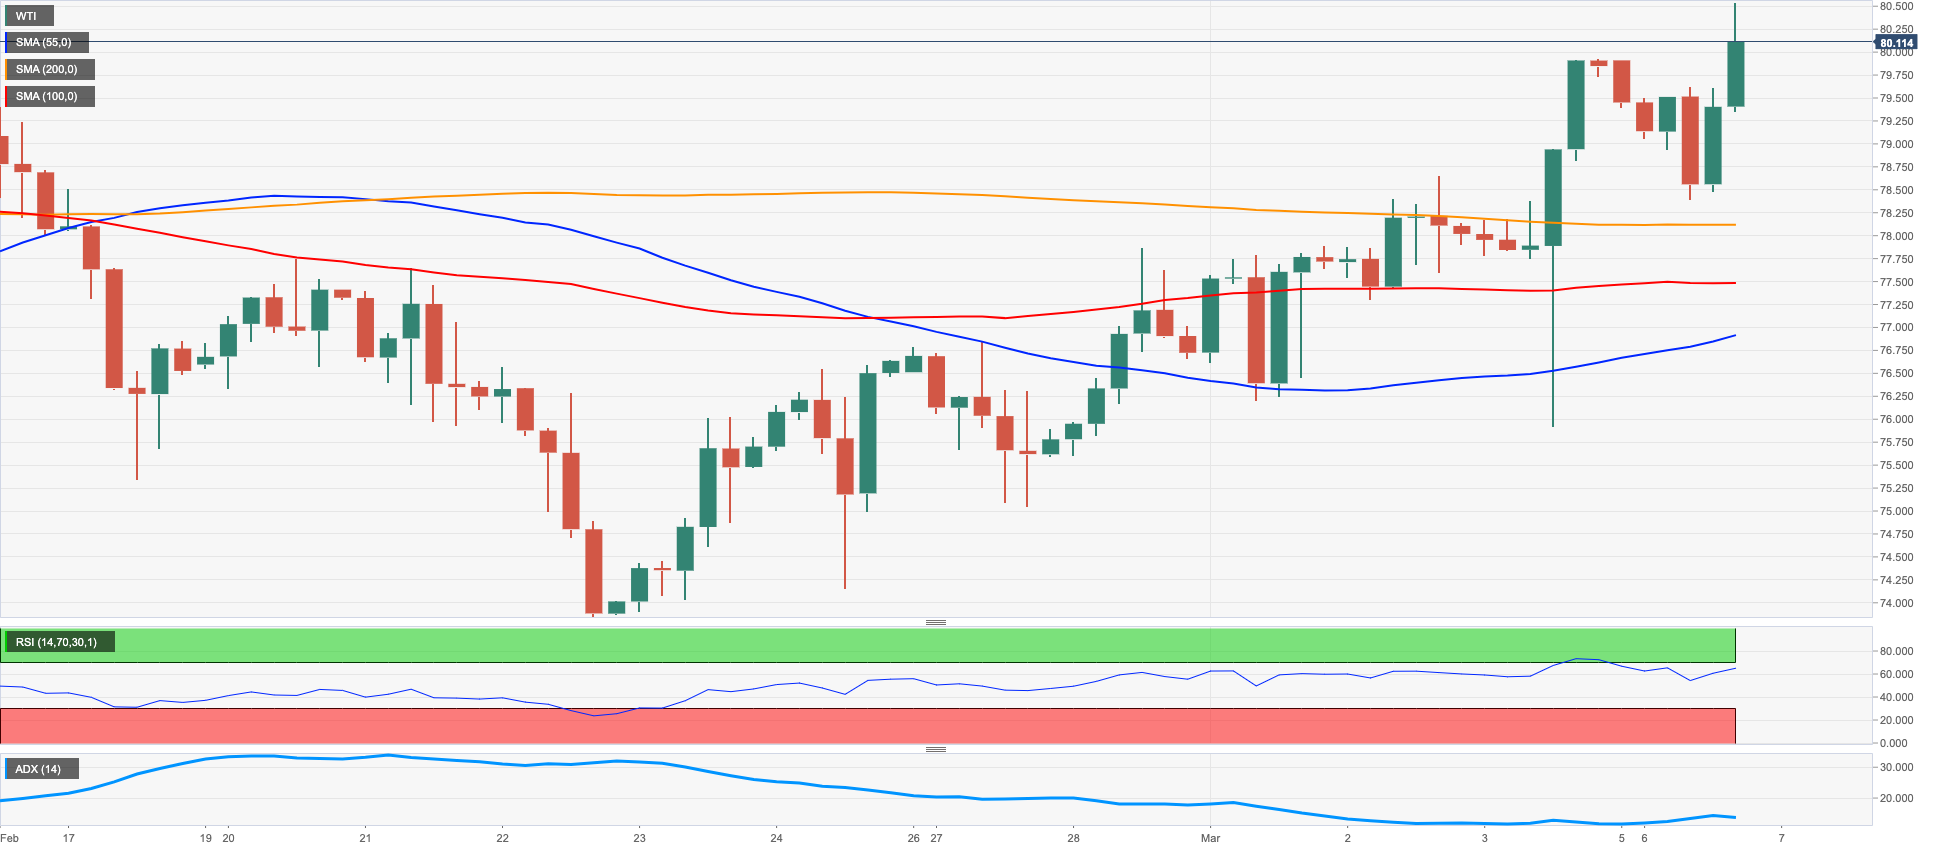
Prices of the American reference for the sweet light crude oil extended the bullish bias for the fifth consecutive session and started the second week in a row with gains on Monday.
In fact, prices of the WTI surpassed the key $80.00 mark per barrel on the back of positive prospects for the demand of the commodity despite China setting its GDP growth target below markets’ expectations.
In addition, traders managed to set aside recession fears in spite of the persevering hawkish narrative from Fed speakers and the bank’s intentions to keep the hiking cycle well in place for the time being.
The continuation of the bid bias in the WTI could lead up to a test of the 2023 peak at $82.60 (January 23) ahead of the December 2022 high at $83.32 (December 1). The surpass of this level could open the door to a potential visit of the $90.08 level (November 11 2022) before the November 2022 top at $93.73 (November 7). On the flip side, bears should meet the next support of note at the weekly low at $73.83 (February 22) prior to the 2023 low at $72.30 (February 6) and the 2022 low at $70.10 (December 9), all preceding the key round level at $70.00.
Resistance levels: $80.57 $82.60 $83.32 (4H chart)
Support levels: $78.02 $75.80 $74.06 (4H chart)
GER40
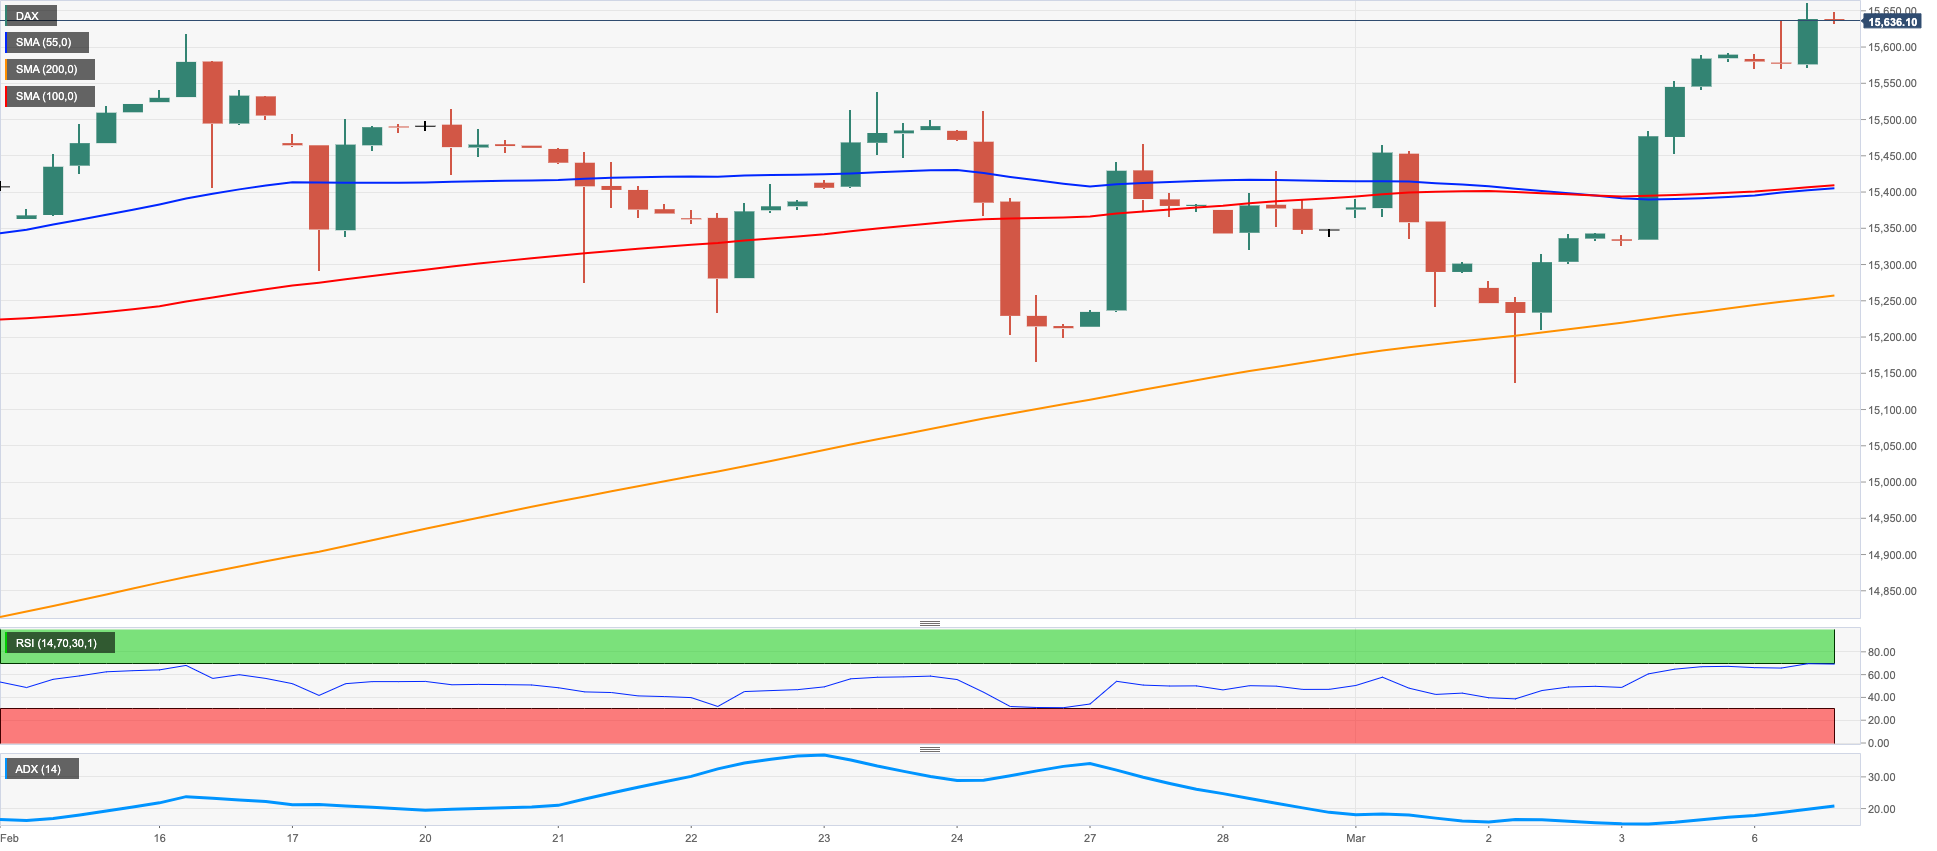
German equities gauged by the DAX40 added to recent gains and recorded new YTD highs near 15700 on Monday.
Investors kept their optimism unchanged despite the humble GDP target set by Chinese authorities on Sunday and disappointing results from retail sales in the broader euro bloc and the unexpected worsening of the investors’ morale – as per the drop in the Sentix index.
The generalized better tone in the risk complex supported the buying interest in stocks, which in turn was also propped up by another poor session in the greenback.
In Germany, the Construction PMI improved to 48.6 in February (from 43.3) and New Car Registrations rose 2.8% in the year to February.
Immediately to the upside in the DAX40 now comes the 2023 high at 15677 (March 6) just ahead of the February 2022 top at 15736 (February 2 2022). The breakout of the latter could put the round level at 16000 back on the traders’ radar before the 2022 peak at 16285 (January 5). On the flip side, the so far March low at 15150 (March 2) should hold the initial test ahead of the interim 55-day SMA at 14970 and the weekly low at 14906 (January 19). The loss of the latter could put the 200-day SMA at 13801 to the test before the December 2022 low at 13791 (December 20). The daily RSI advanced past the 63 yardstick.
Best Performers: Vonovia, Daimler Truck Holding, SAP
Worst Performers: Covestro, BASF, Volkswagen VZO
Resistance levels: 15677 15736 15912 (4H chart)
Support levels: 15431 15317 15150 (4H chart)
NASDAQ
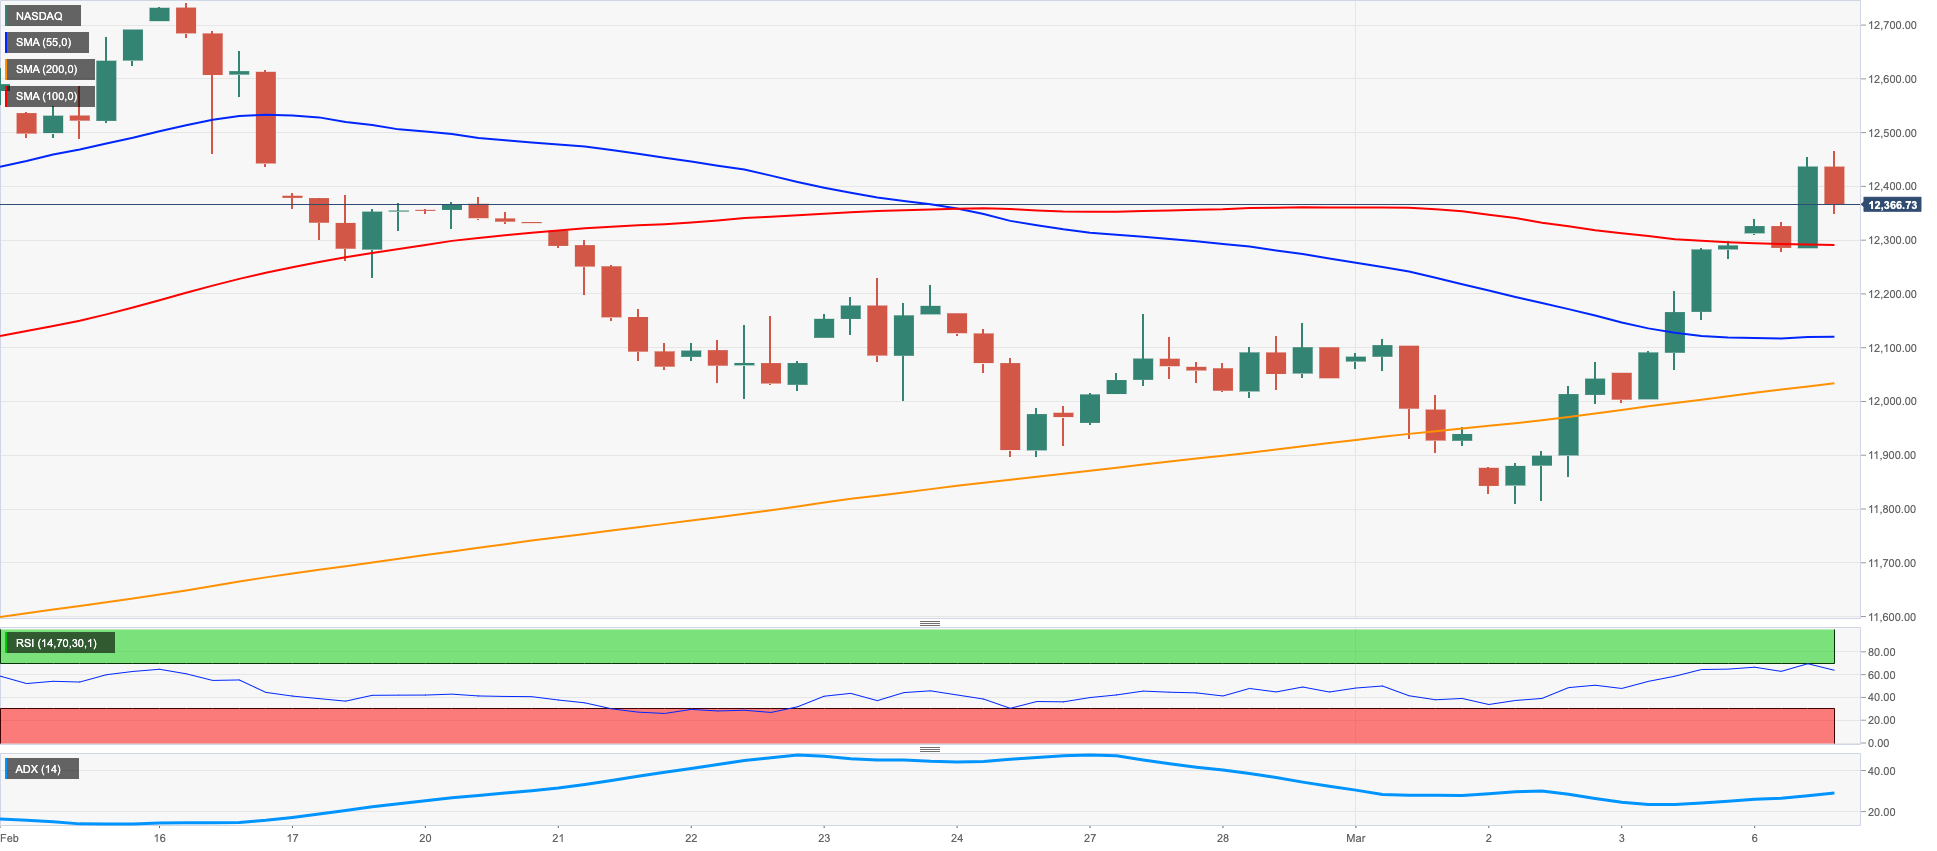
The Nasdaq 100 clinched the third consecutive session with gains and recorded new 3-week highs near the 12500 level at the beginning of the week.
Further weakness hurt the dollar and lent extra legs to the US tech sector and the rest of the risk-linked assets in general on Monday, while investors appear to have started to look past Powell’s testimony on Tuesday and Wednesday and refocus instead of the release of the February Non-farm Payrolls on Friday.
In the meantime, expectations of a 25 bps rate hike at the March 22 event appeared largely priced in despite some Fed speakers leaving the door open to a potential larger raise.
In light of the ongoing price action, the Nasdaq 100 is now expected to dispute the weekly peak at 12689 (February 15) prior to the 2023 high at 12880 (February 2), closely followed by the round level at 13000 and the weekly top at 13175 (August 26 2022). The other way around, there is an initial support at the 200-day SMA at 11901 ahead of the weekly low at 11830 (March 2) and the 55- and 100-day SMAs at 11758 and 11605, respectively. The loss of the latter could prompt weekly lows at 11550 (January 25) and 11251 (January 19) to emerge on the horizon ahead of the 2023 low at 10696 (January 6) and the December 2022 low at 10671 (December 22). The daily RSI climbed past the 56 mark.
Top Gainers: Enphase, MercadoLibre, Apple
Top Losers: DexCom, Marvell, Dollar Tree
Resistance levels: 12466 12689 12880 (4H chart)
Support levels: 11830 11587 11251 (4H chart)
DOW JONES
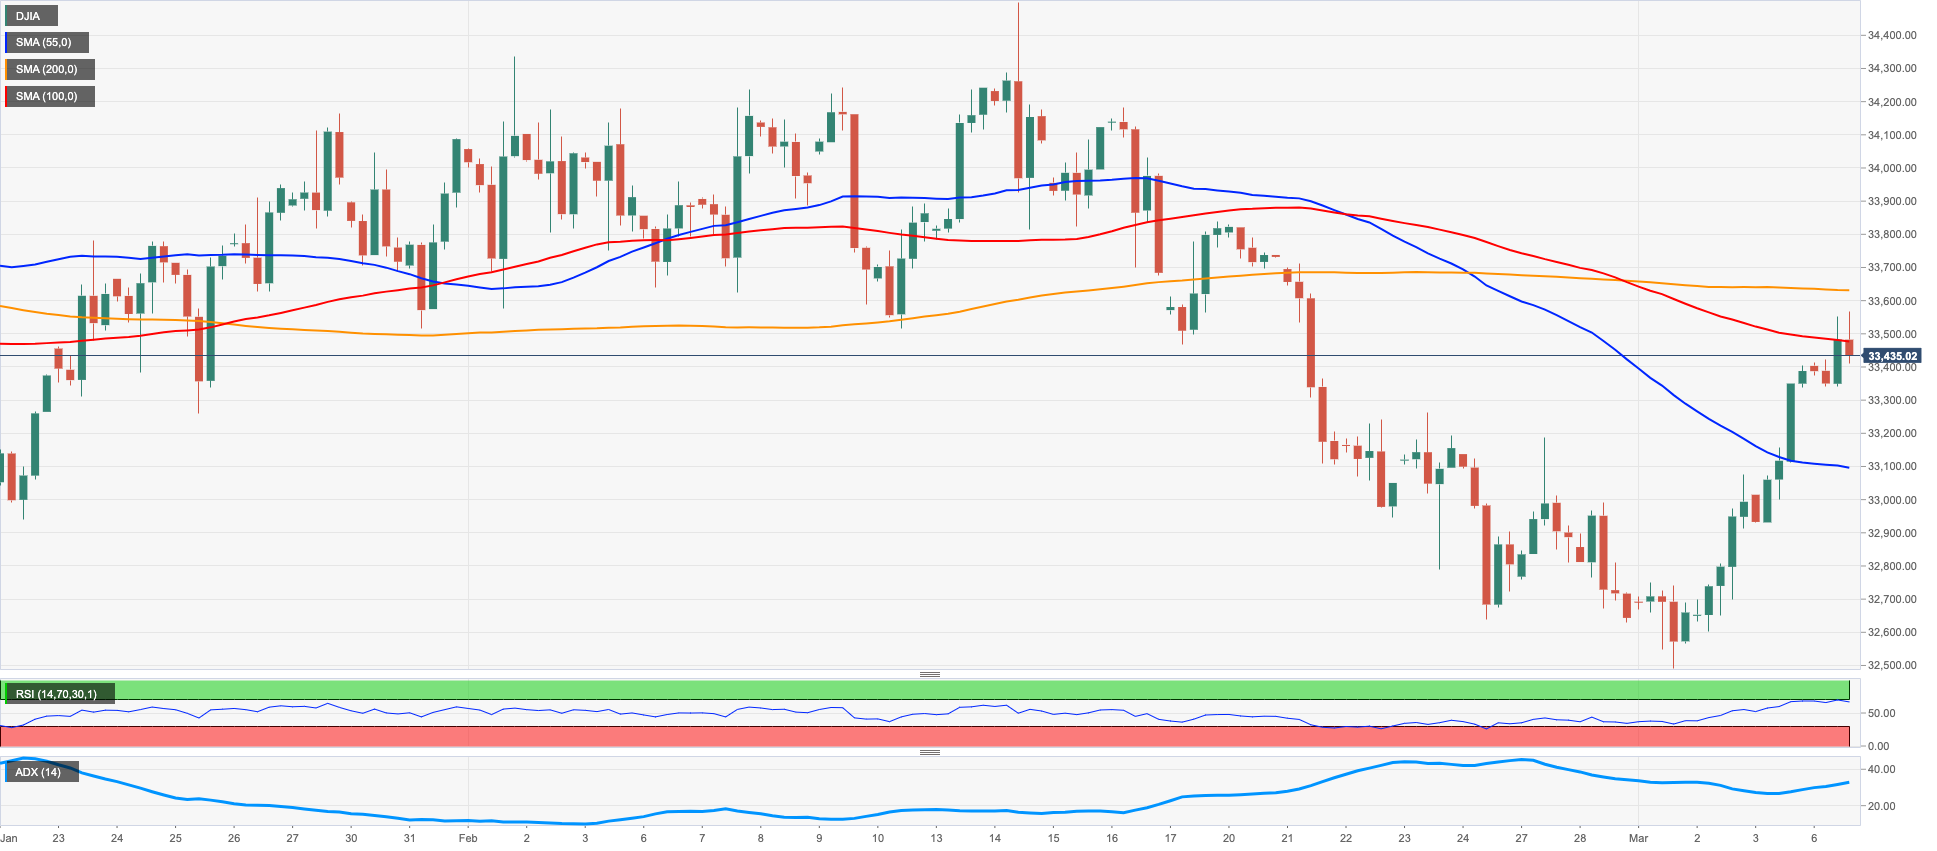
US equities extended the optimism seen at the end of last week into the beginning of the new one, encouraging the Dow Jones to clock new multi-day highs past the 33500 level, an area also coincident with the 55-day SMA.
US stocks rose further amidst speculation that the Fed might not raise rates as high as it initially intended to do, while investors expect no surprises at Chief Powell’s semiannual testimonies on Tuesday and Wednesday.
On the whole, the Dow Jones advanced 0.25% to 33473 the S&P500 rose 0.39% to 4061 and the tech-reference Nasdaq Composite gained 0.44% to 11741.
Further gains should prompt the Dow to challenge the 2023 top at 34342 (January 13) ahead of the December 2022 peak at 34712 (December 13). Once this level is cleared, the index could revisit the April 2022 high at 35492 (April 21) ahead of the February 2022 high at 35824 (February 9). In the opposite direction, the 2023 low at 32500 (March 1) should offer decent contention just ahead of the key 200-day SMA at 32372. Further down turns up the November 2022 low at 31727 (November 3) seconded by the 2022 low at 28660 (October 13). The daily RSI picked up pace and approached 51.
Top Performers: Merck&Co, Apple, Visa A
Worst Performers: Dow, Boeing, Intel
Resistance levels: 33572 33607 34334 (4H chart)
Support levels: 33073 32500 31727 (4H chart)
MACROECONOMIC EVENTS

All Information & Updates provided by:

All information relating to the financial markets available on this page has been prepared and issued by FXStreet (Forexstreet SL, Spain, Reg: B62498233) on the basis of publicly available information and all information believed to be reliable and does not conflict with Kuwaiti local laws, and all necessary care has been taken to before the company to ensure that the facts mentioned are correct from the source.
NCM Investment nor any of its directors or employees shall in any way be held responsible for the contents of this news, and the information contained on this page is intended only to provide clients with publicly available information and should not be construed as investment advice, report or analysis and/or constitute an offer or invitation to buy or sell financial instruments of any kind.
RISK WARNING: Forex and CFDs are highly risky leveraged products, as losses can exceed deposits. Please ensure you understand all the risks and take independent advice if necessary. NCM will segregate the clients based on the criteria of the regulator and its bylaws. NCM does not provide any advisory service; the material published does not constitute advice or a recommendation for a transaction in any financial instrument. NCM accepts no responsibility for any use of the content presented and any consequences of that use. Anyone acting on the information provided does so at their own risk.