
- Contact Us:
-

-

-

-


Daily Market Updates
08 Mar 2023
USDJPY
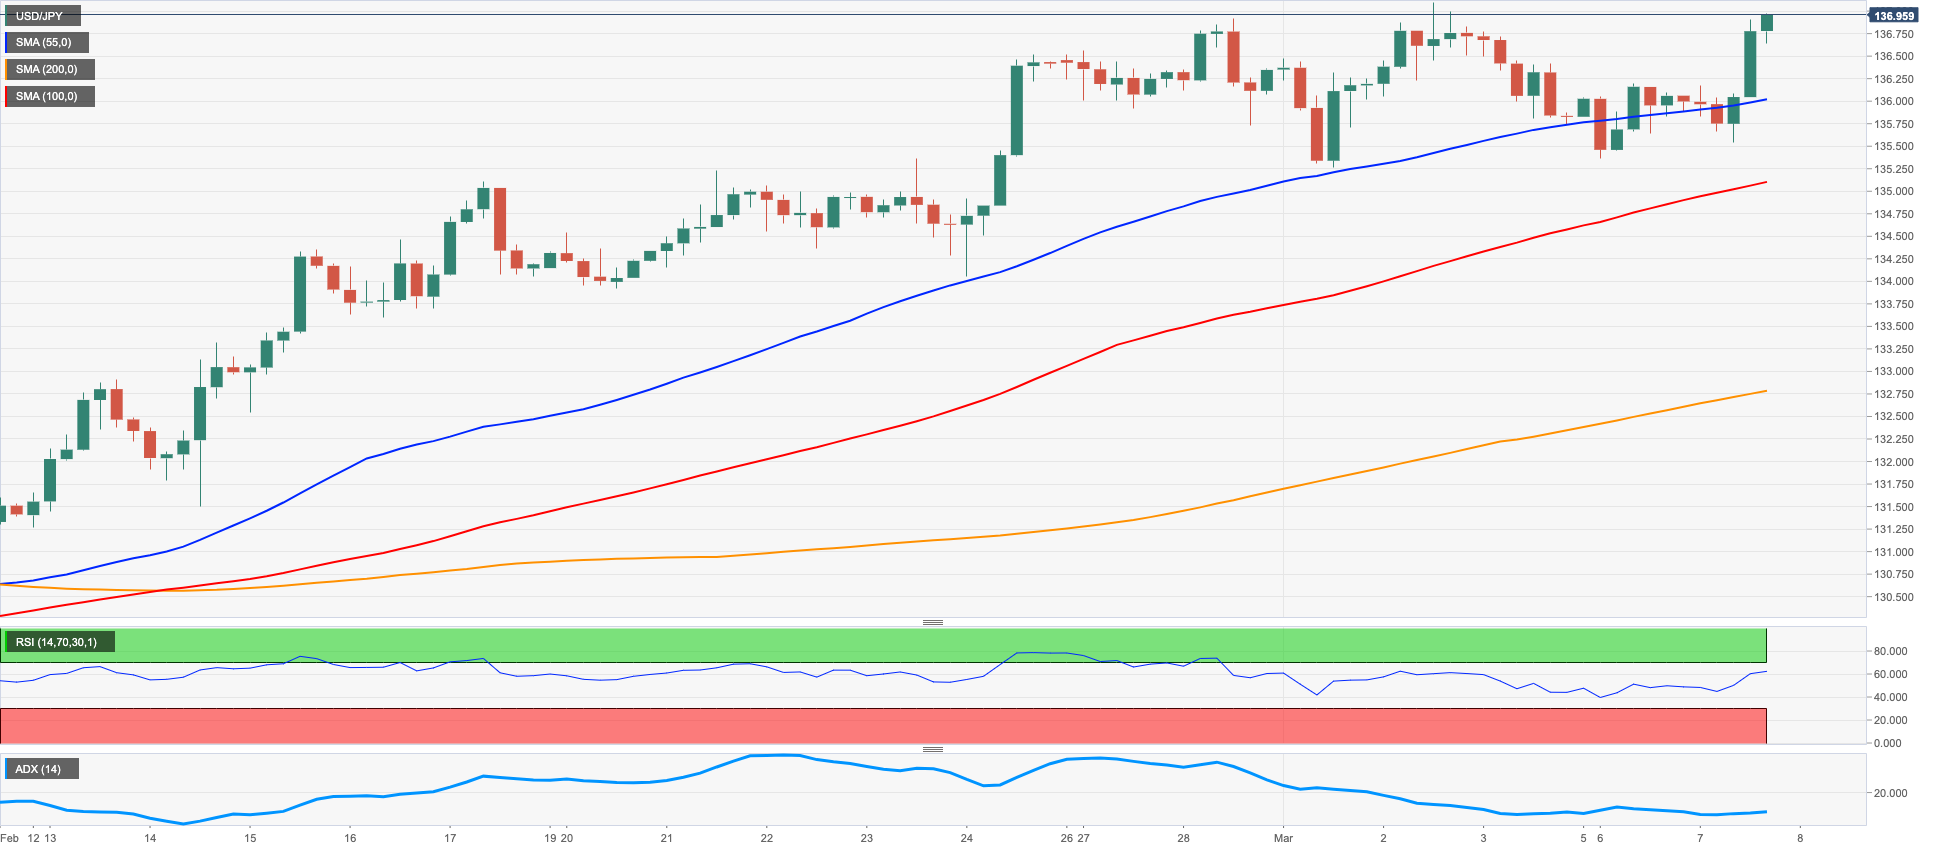
USD/JPY added to Monday’s small uptick and advanced markedly on the back of the intense bounce in the greenback and the march north in US yields.
Indeed, the dollar gathered extra upside traction following the hawkish appearance of Chief Powell before the Congress, while the resumption of the uptrend in US yields also favoured further USD-buying. Back to the US bond market, the 2-year yields poked with the 5% threshold for the first time since mid-June 2007.
In the Japanese money market, the JGB 10-year yields extended further the consolidative range around the 0.50% area.
There were no data releases in Japan on Tuesday.
In case the downward pressure gathers impulse, USD/JPY could then revisit the 134.05 level (February 24) ahead of the temporary 55-day SMA at 132.22 and the weekly low at 129.79 (February 10). The breach of this level could put the February low at 128.08 (February 2) to the test prior to the 2023 low at 127.21 (January 16) and the May 2022 low at 126.36 (May 24). For all that, the 2023 top at 137.10 (March 2) remains the immediate target on the upside just ahead of the key 200-day SMA at 137.37. North from here comes weekly peaks at 138.17 (December 15 2022) and 139.89 (November 30 2022) just before the key round level at 140.00. The daily RSI edged higher past the 66 level.
Resistance levels: 137.10 137.47 138.17 (4H chart)
Support levels: 135.25 134.05 132.82 (4H chart)
GBPUSD
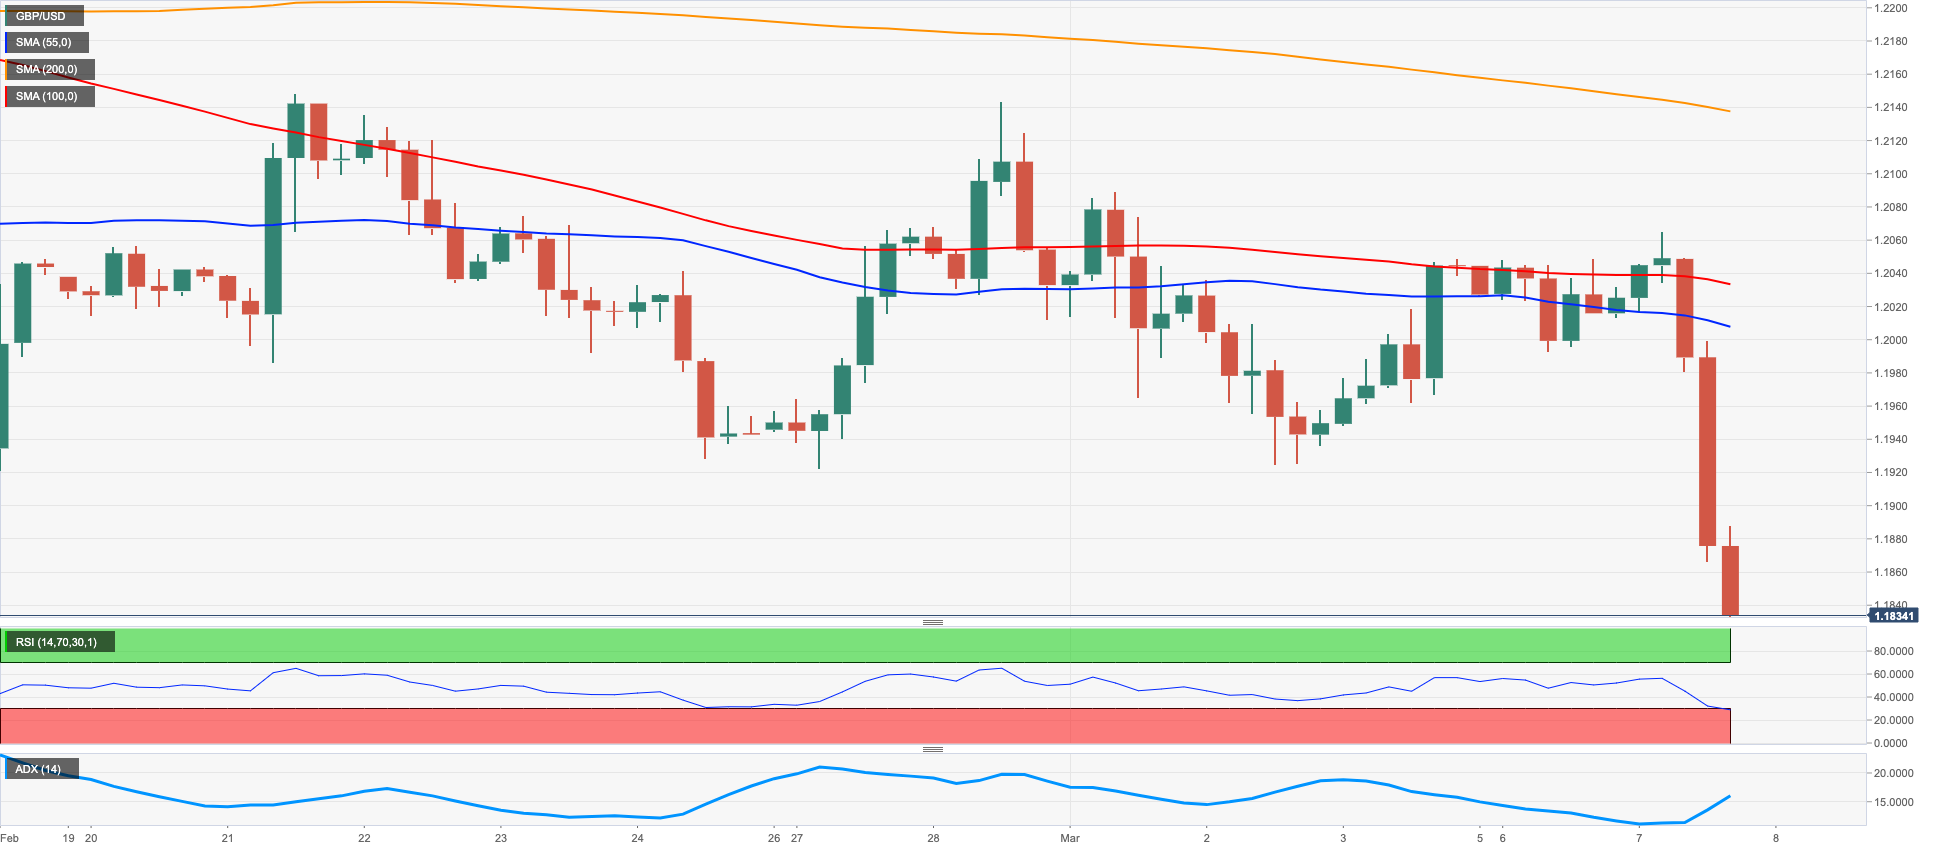
GBP/USD dropped markedly on Tuesday, quickly breaching the 1.1900 support and recording new 2023 lows near 1.1830 on the back of the acute Powell-led rebound in the greenback.
The increased selling interest around the British pound came in response to extra upside pressure around the greenback, which was particularly exacerbated following the unexpected hawkish tone at the semiannual testimony by Fed’s Powell earlier in the session.
From the BoE, MPC member C.Mann (hawk) suggested that prices for goods are not expected to rise as quickly this year at the time when she showed concern over the persevering core inflation. Mann also reiterated that more needs to be done when it comes to the interest rate and noted that a weak currency is important for inflation. She also said that QT is operating in the background.
In the UK, the BRC Retail Sales Monitor rose 4.9% in the year to February, while house prices tracked by the Halifax index gained 1.1% MoM in February and 2.1% from a year earlier.
The breach of the 2023 low at 1.1837 (March 7) should meet the next support of note at the November 2022 low at 1.1142 (November 4). On the opposite side, the initial hurdle emerges at the weekly high at 1.2147 (February 21) ahead of another weekly top at 1.2269 (February 14) and the 2023 peak at 1.2447 (January 23). If GBP/USD breaks above this level, it could then shift its attention to the May 2022 high at 1.2666 (May 27) followed by the 200-week SMA at 1.2876 and the psychological 1.3000 mark. The daily RSI collapsed to the sub-38 region.
Resistance levels: 1.2065 1.2143 1.2269 (4H chart)
Support levels: 1.1837 1.1762 1.1333 (4H chart)
AUDUSD
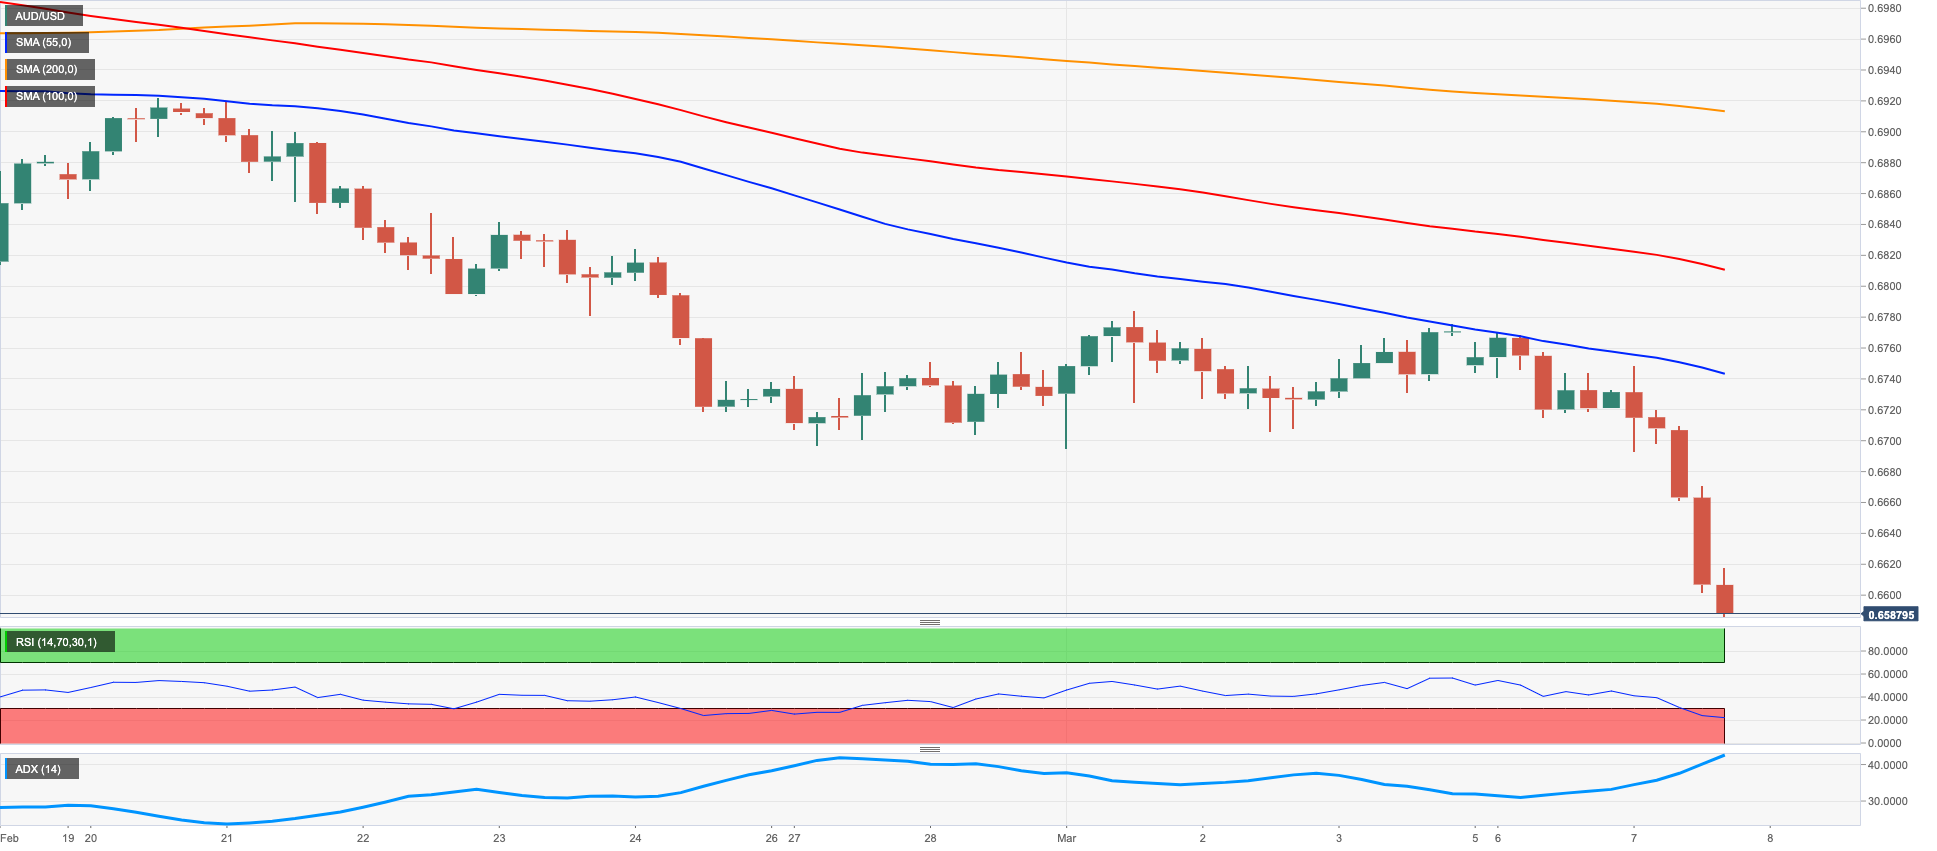
AUD/USD plummeted to new 2023 lows south of 0.6600 the figure on Tuesday, returning to levels last seen back in mid-November 2022.
In fact, the Aussie dollar collapsed to 4-month lows after the dovish hike from the RBA and the sharp rebound in the dollar in the wake of Powell’s testimony.
Back to the RBA event, the central bank matched estimates and raised the OCR by 25 bps to 3.60% at its event earlier on Tuesday, its 10th consecutive rate hike.
Governor P.Lowe, in the meantime, said the central bank is committed to bring inflation back to the 2%-3% target and anticipated that further rate hikes remain in store, at the time when he hinted at the likelihood that the route to a soft landing remains bumpy and that inflation could have already peaked.
Lowe also added that further decisions on the interest rate will depend on household spending, inflation, the global economy and the labour market.
Other than the RBA interest rate decision, the Australian docket showed the trade surplus narrowed to A$11.688B in January, with Exports up 1.4% MoM and Imports rising 5% MoM.
Further weakness in AUD/USD could now revisit the December 2022 low at 0.6629 (December 20) ahead of the weekly low at 0.6584 (November 21 2022). Just the opposite, the immediate up-barrier comes at the weekly top at 0.6783 (March 1), which appears reinforced by the key 200-day SMA at 0.6785. Further gains from here could revisit the provisional 55-day SMA at 0.6878 prior to the weekly peak at 0.6920 (February 20) and another weekly high at 0.7029 (February 14). The breakout of the latter could prompt the 2023 top at 0.7157 (February 2) to emerge on the horizon ahead of the round level at 0.7200 and the June 2022 top at 0.7282 (June 3). The daily RSI sunk to the oversold territory below 30.
Resistance levels: 0.6783 0.6819 0.6916 (4H chart)
Support levels: 0.6591 0.6386 0.6271 (4H chart)
GOLD
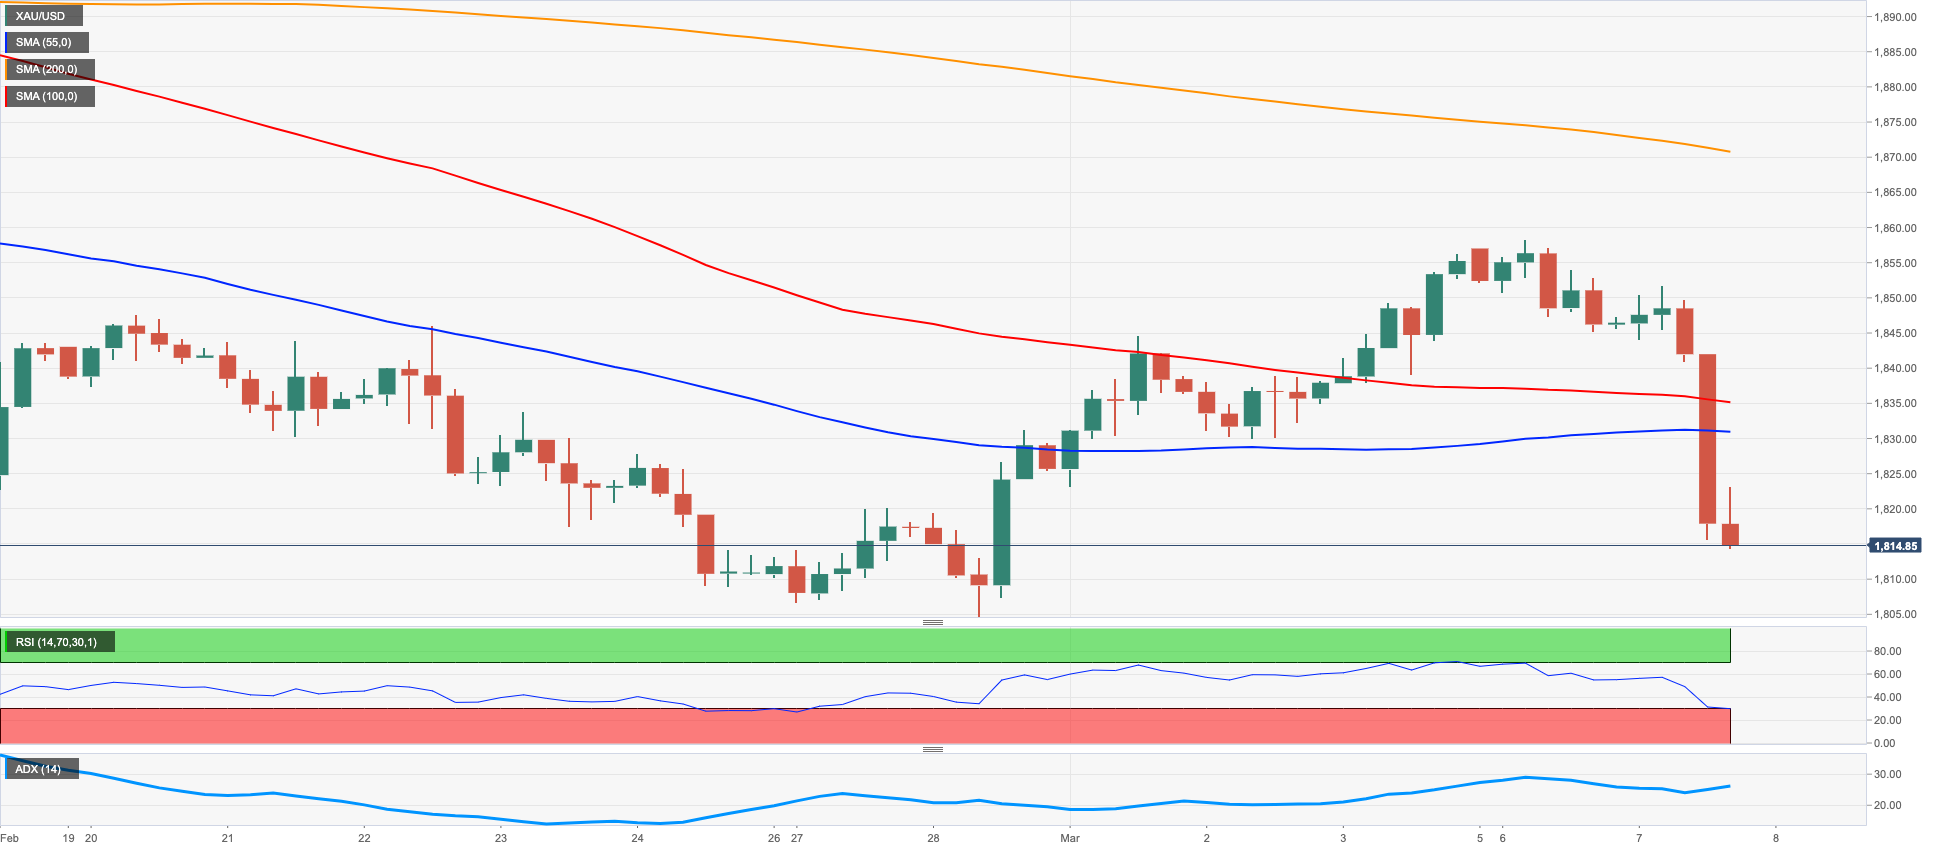
Prices of the ounce troy of gold dropped to multi-day lows near the $1815 level on Tuesday, recording at the same time the second daily pullback in a row.
Indeed, the precious metal accelerated its weekly leg lower following the resumption of the buying pressure in the greenback after Powell’s hawkish testimony surprised everybody on Tuesday.
In addition, US yields in the short end and the belly of the curve reversed the initial pessimism and extended the recent advance against the backdrop of renewed bets on a 50 bps rate hike by the Fed at the March gathering.
Moving forward, Bullion faces the next risk event at Powell’s second testimony on Wednesday and the publication of the US Non-farm Payrolls on Friday.
If the corrective pullback picks up pace, the gold should remain vulnerable to a deeper drop to the 2023 low at $1804 (February 28) just ahead of the temporary 100-day SMA at $1801 and the key $1800 region. Further down aligns the key 200-day SMA at $1775 ahead of the weekly low at $1727 (November 23) and the November 2022 low at $1616 (November 3). On the other hand, the March top at $1858 (March 6) should offer initial resistance just ahead of the interim 55-day SMA at $1863 and the weekly peak at $1890 (February 9). The surpass of the latter could put a potential visit to the 2023 high at $1959 (February 2) back on the traders’ radar prior to the April 2022 top at $1998 (April 18) and the psychological $2000 level.
Resistance levels: $1858 $1873 $1890 (4H chart)
Support levels: $1814 $1804 $1784 (4H chart)
CRUDE WTI
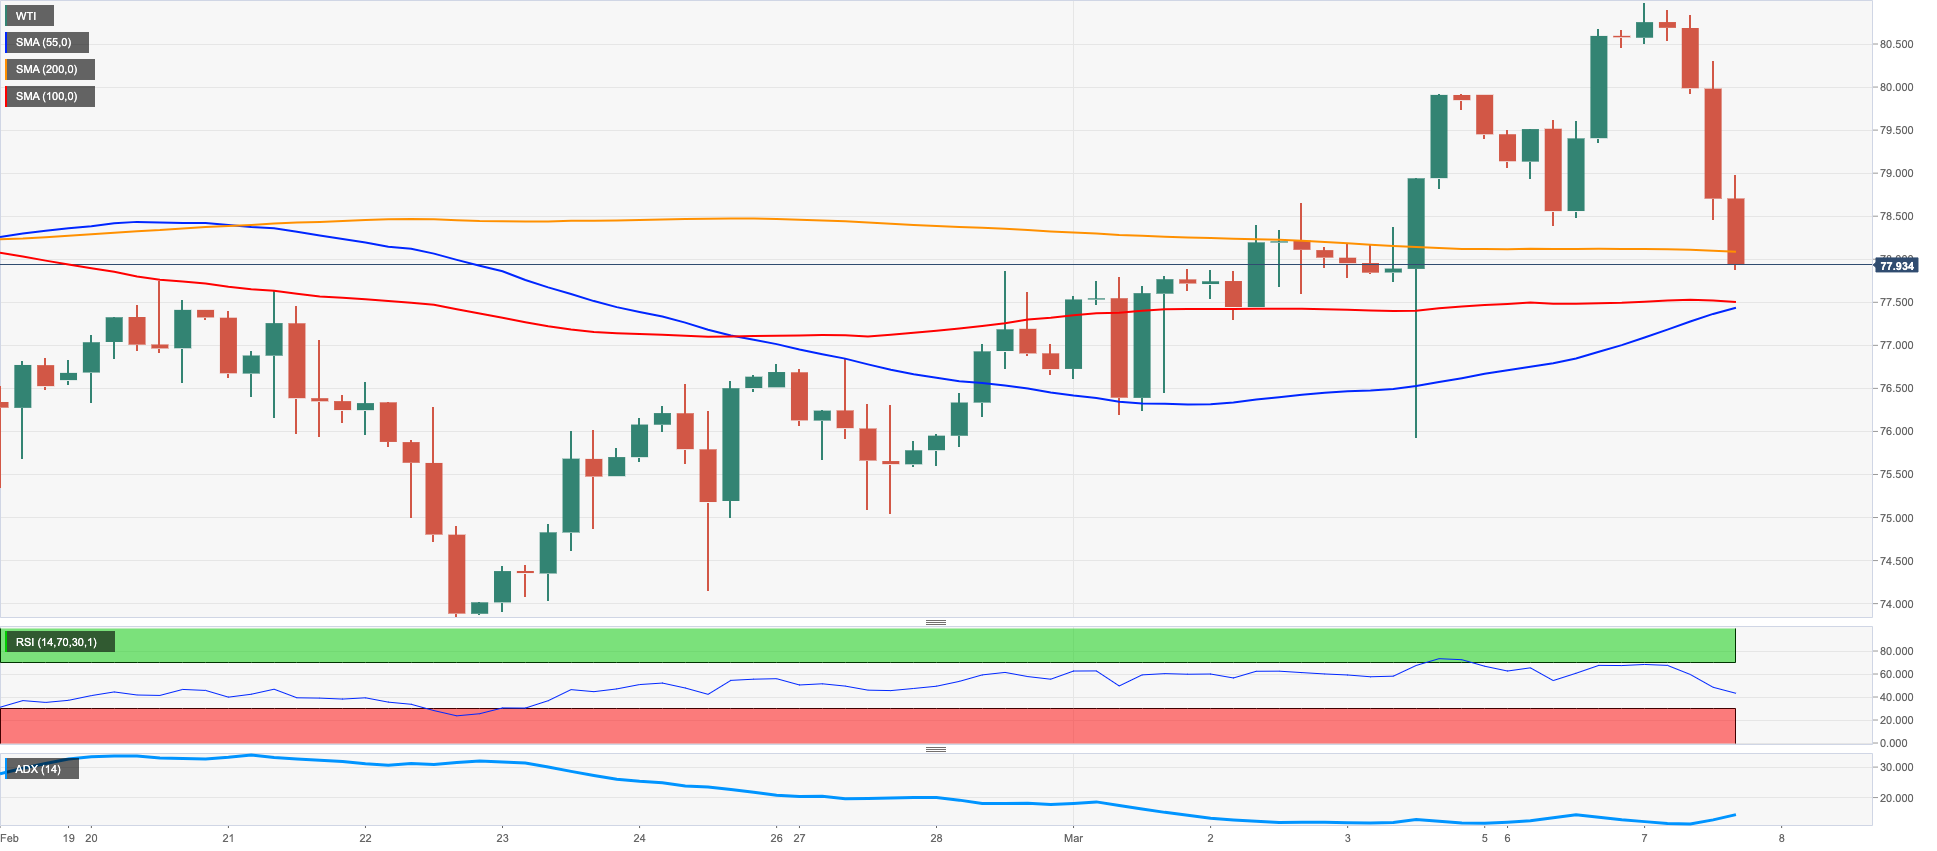
WTI prices quickly dropped to 2-day lows and broke below the $78.00 mark per barrel on turnaround Tuesday, revisiting the 55-day SMA ($77.82).
In fact, and in line with the rest of the risk-associated universe and USD-labeled assets, crude oil prices abruptly reversed the 5-day positive streak in response to the unexpectedly hawkish message from Chief Powell, which sparked a sudden spike in the greenback and reignited recession concerns among traders.
Later in the NA session, the API will release its usual weekly report on US crude oil inventories in the week to March 3.
In case sellers push harder, then the WTI could extend the decline to the so far March low at $75.88 (March 1) prior to the weekly low at $73.83 (February 22) and the 2023 low at $72.30 (February 6). South from here turns up the 2022 low at $70.10 (December 9) just ahead of the key round level at $70.00. By contrast, the immediate hurdle appears at the March peak at $80.90 (March 7) seconded by the 2023 high at $82.60 (January 23) and the December 2022 top at $83.32 (December 1). Once the latter is cleared, the WTI could dispute the $90.08 level (November 11 2022) prior to the November 2022 peak at $93.73 (November 7).
Resistance levels: $80.90 $82.60 $83.32 (4H chart)
Support levels: $77.83 $75.80 $73.77 (4H chart)
GER40
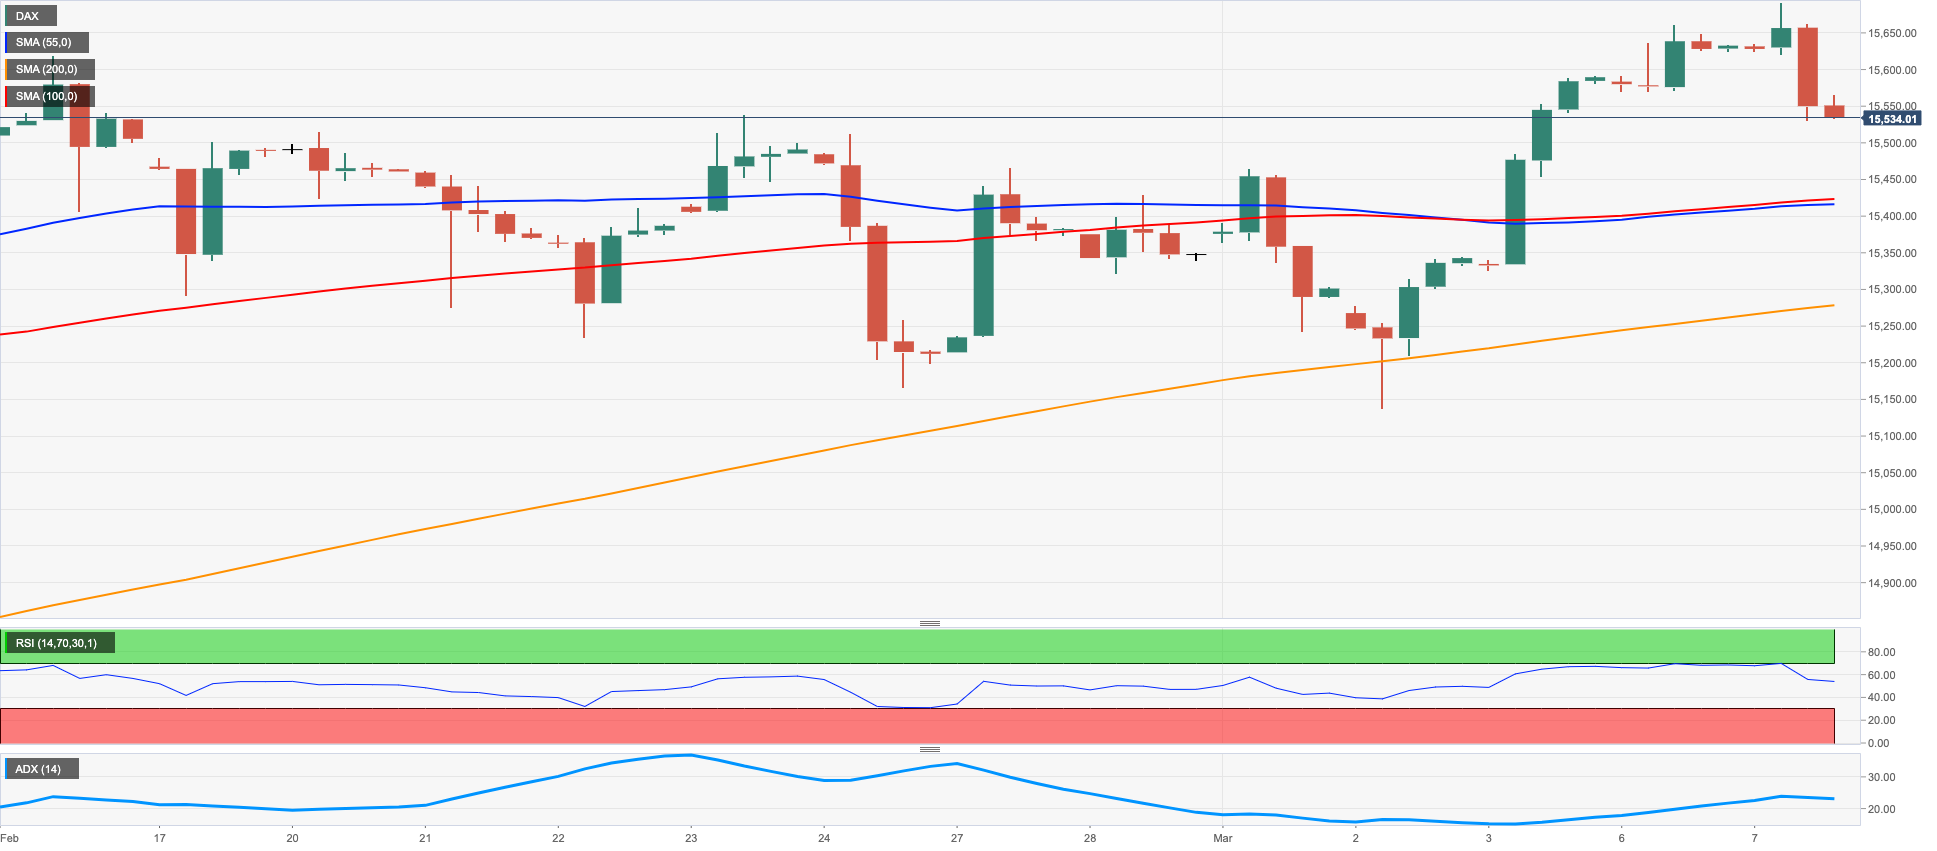
The German stock benchmark DAX40 reversed three straight sessions with gains and eased to 2-day lows on Tuesday. German equities were no exception in a context where all their European peers traded on the defensive.
German equities succumbed to the prevailing selling pressure amidst recent calls from ECB speakers for extra rate hikes after the March event, when the ECB has already anticipated it will raise rates by 50 bps.
In addition, cautiousness among investors remained high ahead of the testimony by Chair Powell in an atmosphere where the risk-off mood prevailed.
The downtick in the DAX40 came in line with the corrective retracement in the German 10-year Bund yields, which revisited the 2.65% region.
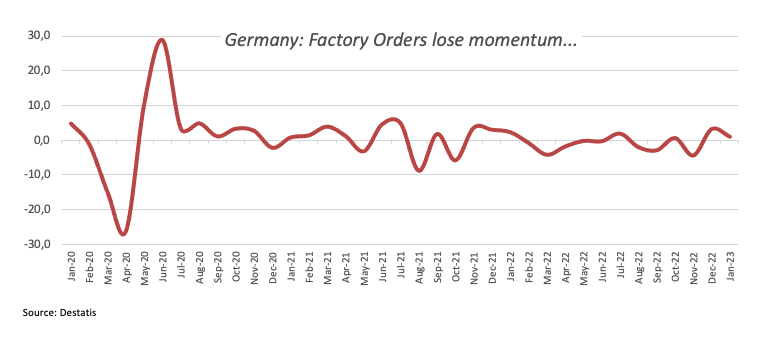
In Germany, Factory Orders expanded more than expected at a monthly 1.0% during January.
Next on the downside for the DAX is the March low at 15150 (March 2) prior to the provisional 55-day SMA at 14999 and the weekly low at 14906 (January 19). A drop below this level could trigger further losses to the 100-day SMA at 14501 and the more relevant 200-day SMA at 13806, all prior to the December 2022 low at 13791 (December 20). In the opposite direction emerges the 2023 top at 15706 (March 6) before the February 2022 peak at 15736 (February 2 2022). Further up comes the round level at 16000 prior to the 2022 high at 16285 (January 5). The daily RSI reversed course and broke below 60.
Best Performers: Covestro, Daimler Truck Holding, Dr Ing Porsche AG Pfd
Worst Performers: Vonovia, Fresenius Medical Care, Zalando SE
Resistance levels: 15706 15736 15912 (4H chart)
Support levels: 15435 15150 14872 (4H chart)
NASDAQ
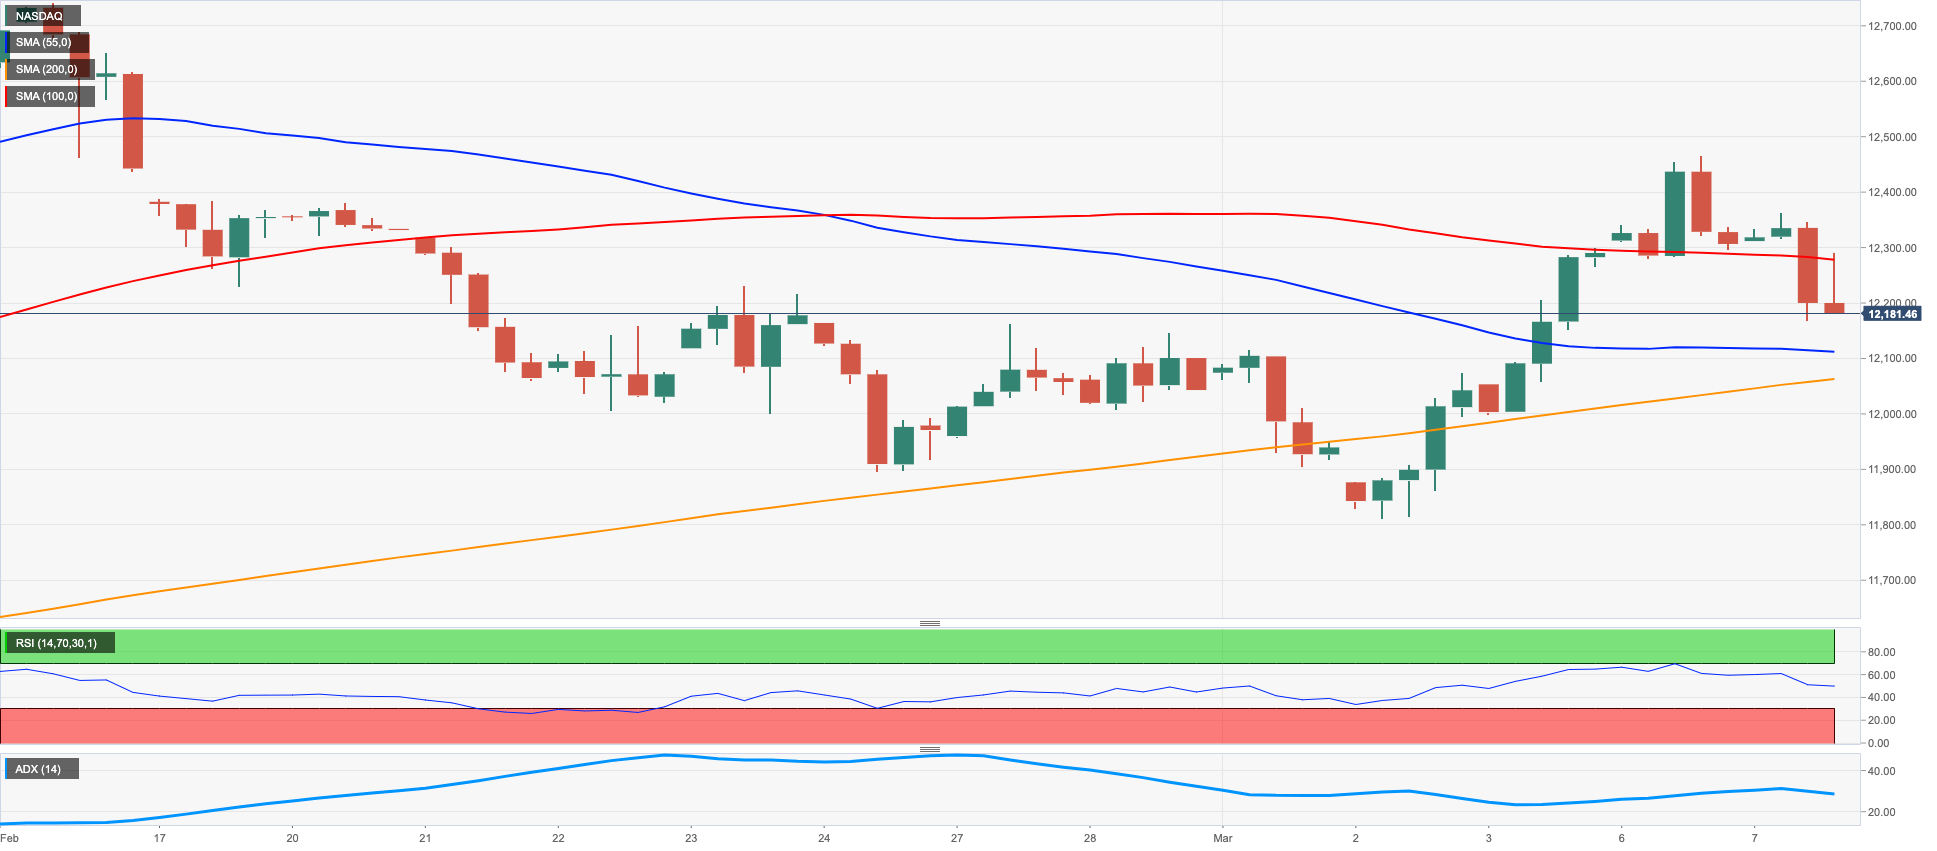
In line with the rest of its US peers, the Nasdaq 100 traded on the defensive on Tuesday in a context favourable to the greenback and 2-year yields.
In fact, Powell’s hawkish testimony lent strong support to the recent aggressive narrative from most Fed speakers, favouring a tighter-for-longer stance from the Federal Reserve as well as eventually higher terminal rates.
In the wake of Powell’s testimony before Congress, markets seem to have shifted their preference to a 50 bps rate hike instead of 25 bps raise.
Following Tuesday’s pullback, the Nasdaq 100 now faces the immediate contention at the key 200-day SMA at 11902 prior to the weekly low at 11830 (March 2) and the 55- and 100-day SMAs at 11766 and 11619, respectively. Down from here, the index could put weekly lows at 11550 (January 25) and 11251 (January 19) to the test before the 2023 low at 10696 (January 6) and the December 2022 low at 10671 (December 22). Conversely, the March peak at 12466 (March 6) should appear as the immediate up-barrier seconded by the weekly high at 12689 (February 15) and the 2023 top at 12880 (February 2). If the index clears the latter, it could then shift its focus to the round level at 13000 prior to the weekly peak at 13175 (August 26 2022). The daily RSI deflated below the 55 level.
Top Gainers: AMD, Airbnb, Atlassian Corp Plc
Top Losers: Rivian Automotive, Sirius XM, Lucid Group
Resistance levels: 12466 12689 12880 (4H chart)
Support levels: 12171 11830 11600 (4H chart)
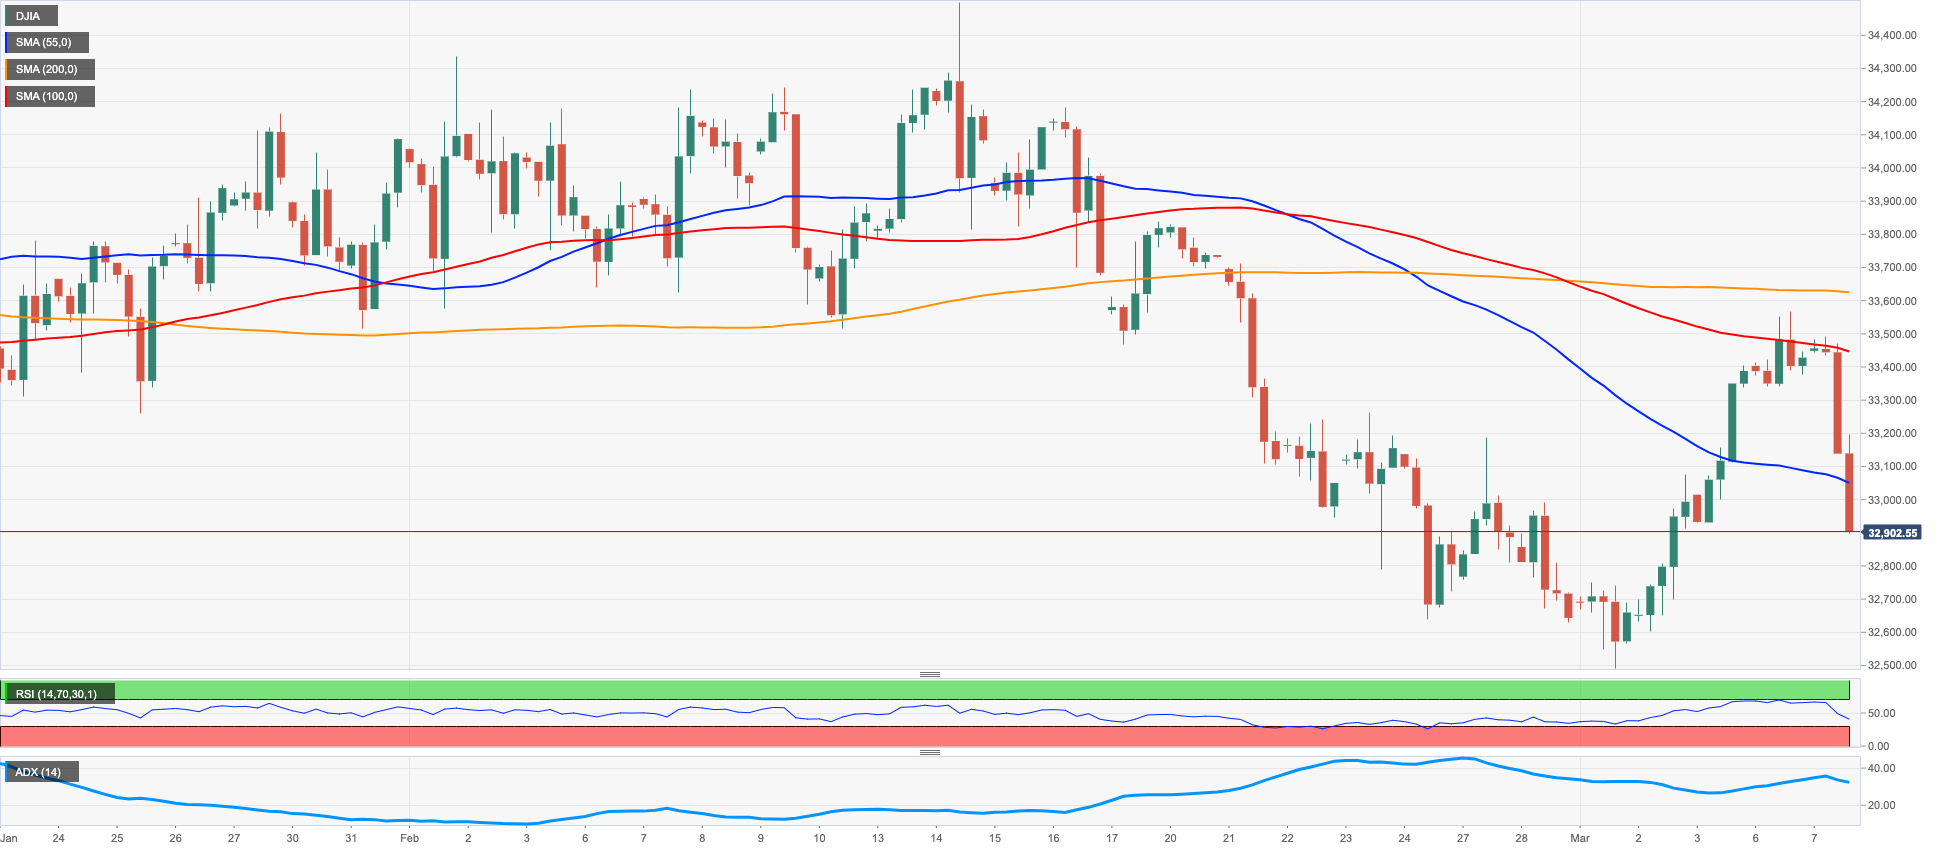
DOW JONES
Equities measured by the Dow Jones retreated to 3-day lows and breached the key support at the 33000 mark on Tuesday, setting aside at the same time four consecutive daily advances.
In fact, Chief Powell caught markets off guard after he delivered a hawkish message at his testimony before Congress on Tuesday. Indeed, Powell favoured further rate hikes amidst the continuation of the battle to tame inflation and against the backdrop of stronger-than-expected results from US fundamentals.
Powell also hinted at the idea that the terminal rate may be higher than previously thought and the Fed might keep the tight monetary conditions for longer than estimated.
The sharp move higher in the greenback coupled with gains in the short end of the US yields curve also weighed on the investors’ sentiment.
Overall, the Dow Jones retreated 1.49% to 32933 the S&P500 dropped 1.35 to 3993 and the tech-benchmark Nasdaq Composite deflated 0.90% to 11570.
In case the Dow intensifies the decline, the next support of note should emerge at the 2023 low at 32500 (March 1) closely followed by the key 200-day SMA at 32380. The breakdown of this important region could pave the way for a probable leg lower to the November 2022 low at 31727 (November 3) ahead of the 2022 low at 28660 (October 13). On the flip side, the next obstacle appears at the March top at 33572 (March 6) prior to the 2023 peak at 34342 (January 13) and the December 2022 high at 34712 (December 13). The surpass of the latter exposes the April 2022 top at 35492 (April 21) seconded by the February 2022 peak at 35824 (February 9). The daily RSI lost the grip and breached 45.
Top Performers: Nike, Salesforce Inc, Merck&Co
Worst Performers: Walgreen Boots, JPMorgan, Amgen
Resistance levels: 33572 33607 34334 (4H chart)
Support levels: 32911 32500 31727 (4H chart)
MACROECONOMIC EVENTS

All Information & Updates provided by:

All information relating to the financial markets available on this page has been prepared and issued by FXStreet (Forexstreet SL, Spain, Reg: B62498233) on the basis of publicly available information and all information believed to be reliable and does not conflict with Kuwaiti local laws, and all necessary care has been taken to before the company to ensure that the facts mentioned are correct from the source.
NCM Investment nor any of its directors or employees shall in any way be held responsible for the contents of this news, and the information contained on this page is intended only to provide clients with publicly available information and should not be construed as investment advice, report or analysis and/or constitute an offer or invitation to buy or sell financial instruments of any kind.
RISK WARNING: Forex and CFDs are highly risky leveraged products, as losses can exceed deposits. Please ensure you understand all the risks and take independent advice if necessary. NCM will segregate the clients based on the criteria of the regulator and its bylaws. NCM does not provide any advisory service; the material published does not constitute advice or a recommendation for a transaction in any financial instrument. NCM accepts no responsibility for any use of the content presented and any consequences of that use. Anyone acting on the information provided does so at their own risk.