
- Contact Us:
-

-

-

-


Daily Market Updates
09 Mar 2023
USDJPY
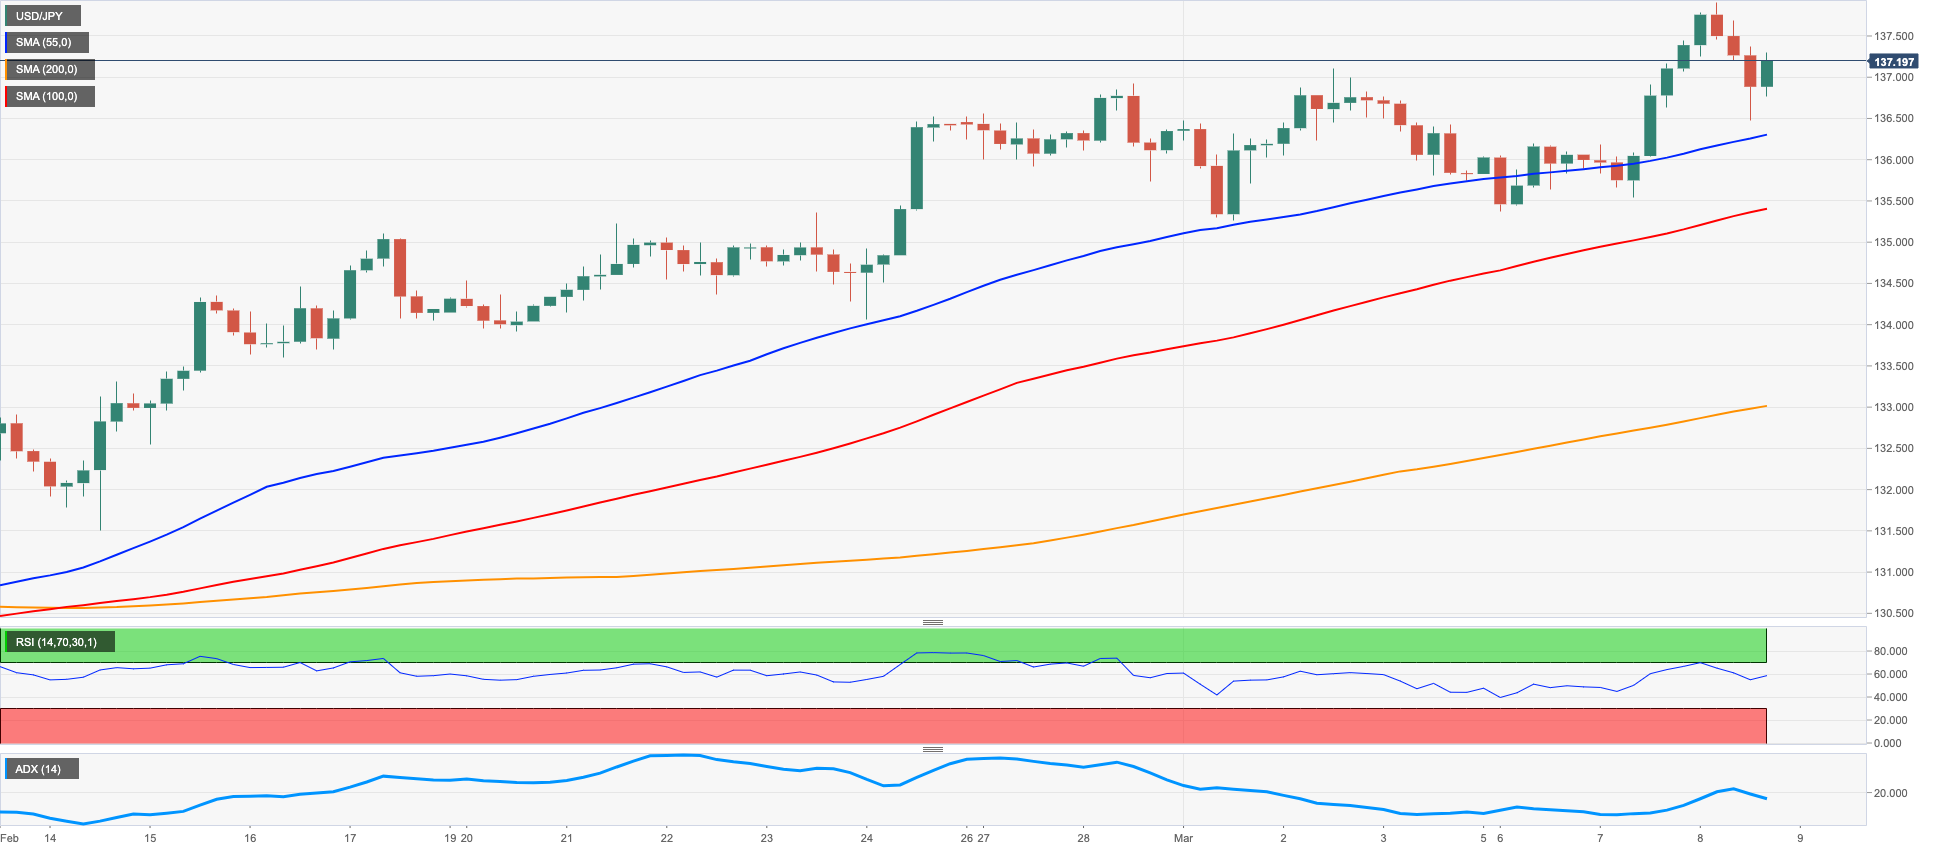
USD/JPY kept the bullish bias well in place for the third session in a row and advanced to fresh tops just below 138.00 the figure on Wednesday, an area last visited in mid-December 2022.
The continuation of the post-Powell rebound in the greenback – and fresh tops in the USD Index (DXY) - in combination with higher US yields remained supportive of further gains in spot, which at the same time left behind the key 200-day SMA (137.41).
Speaking about yields, no changes to the range bound theme in the JGB 10-year yields, which briefly probed the 0.51% region.
In Japan, Bank Lending expanded at an annualized 3.3% in February. In addition, preliminary January readings saw the Coincident Index at 96.1 and the Leading Economic Index at 96.5, while the Eco Watchers Survey Current came at 52 for the month of February and 50.8 when it came to the Eco Watchers Survey Outlook.
There are minor up-barriers for USD/JPY at weekly highs at 138.17 (December 15 2022) and 139.89 (November 30 2022) just ahead of the key round level at 140.00 and the weekly top at 142.25 (November 21 2022). On the opposite side, there is a temporary support at the 100-day SMA at 136.24 followed by the 134.05 level (February 24) and another provisional support at the 55-day SMA at 132.33. Further downside could see the weekly low at 129.79 (February 10) revisited before the February low at 128.08 (February 2) and the 2023 low at 127.21 (January 16). The daily RSI picked up pace and poked with the overbought territory near 68.
Resistance levels: 137.91 138.17 139.89 (4H chart)
Support levels: 136.19 135.25 134.05 (4H chart)
GBPUSD
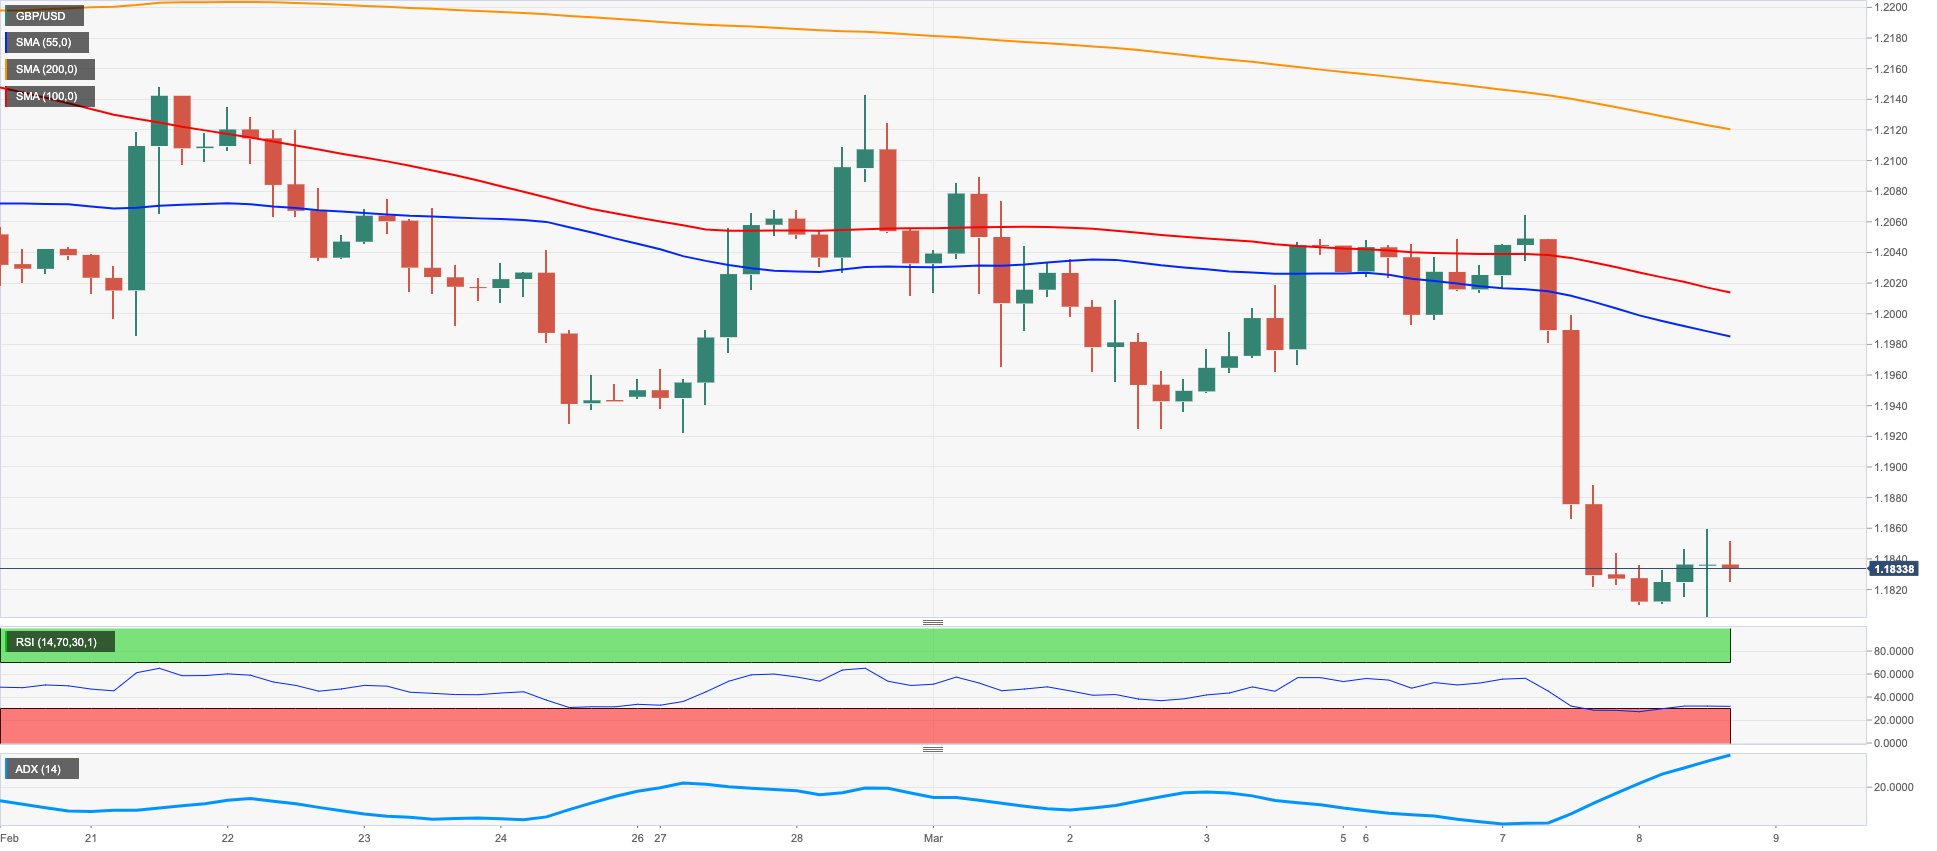
GBP/USD managed to regain a small smile and advanced modestly on Wednesday, although a test/surpass of the 1.1900 region remained elusive.
In the meantime, Cable appeared to have settled in the lower end of the weekly range, as investors continued to digest the acute sell-off in the British pound (and the risk complex in general) in the wake of Powell’s testimony before the Congress on Wednesday, which resulted in an unexpected boost for the dollar.
Somewhat denting the daily upbeat tone around the quid, BoE MPC member S.Dhingra (dove) warned against risks of overtightening. So far, investors seem to have priced in a 25 bps rate hike at both the March and May meetings, while a similar raise in August could see the policy rate at around 4.75%.
In the UK bond market, the 10-year Gilt yields remained within the consolidative mood around the 3.85% zone.
No data releases were scheduled in the UK docket on Wednesday
GBP/USD recorded a new 2023 low at 1.1809 (March 8). Below the latter, there are no contention levels of significance until the November 2022 low at 1.1142 (November 4). The other way around, the 200-day SMA emerges as the immediate up-barrier seconded by the temporary 100-day SMA at 1.2007. Further up comes the provisional 55-day SMA at 1.2120, which precedes the weekly top at 1.2147 (February 21) prior to another weekly peak at 1.2269 (February 14) and the 2023 high at 1.2447 (January 23). The daily RSI advanced marginally past the 37 barrier.
Resistance levels: 1.1995 1.20261.2065 (4H chart)
Support levels: 1.1809 1.1762 1.1333 (4H chart)
AUDUSD
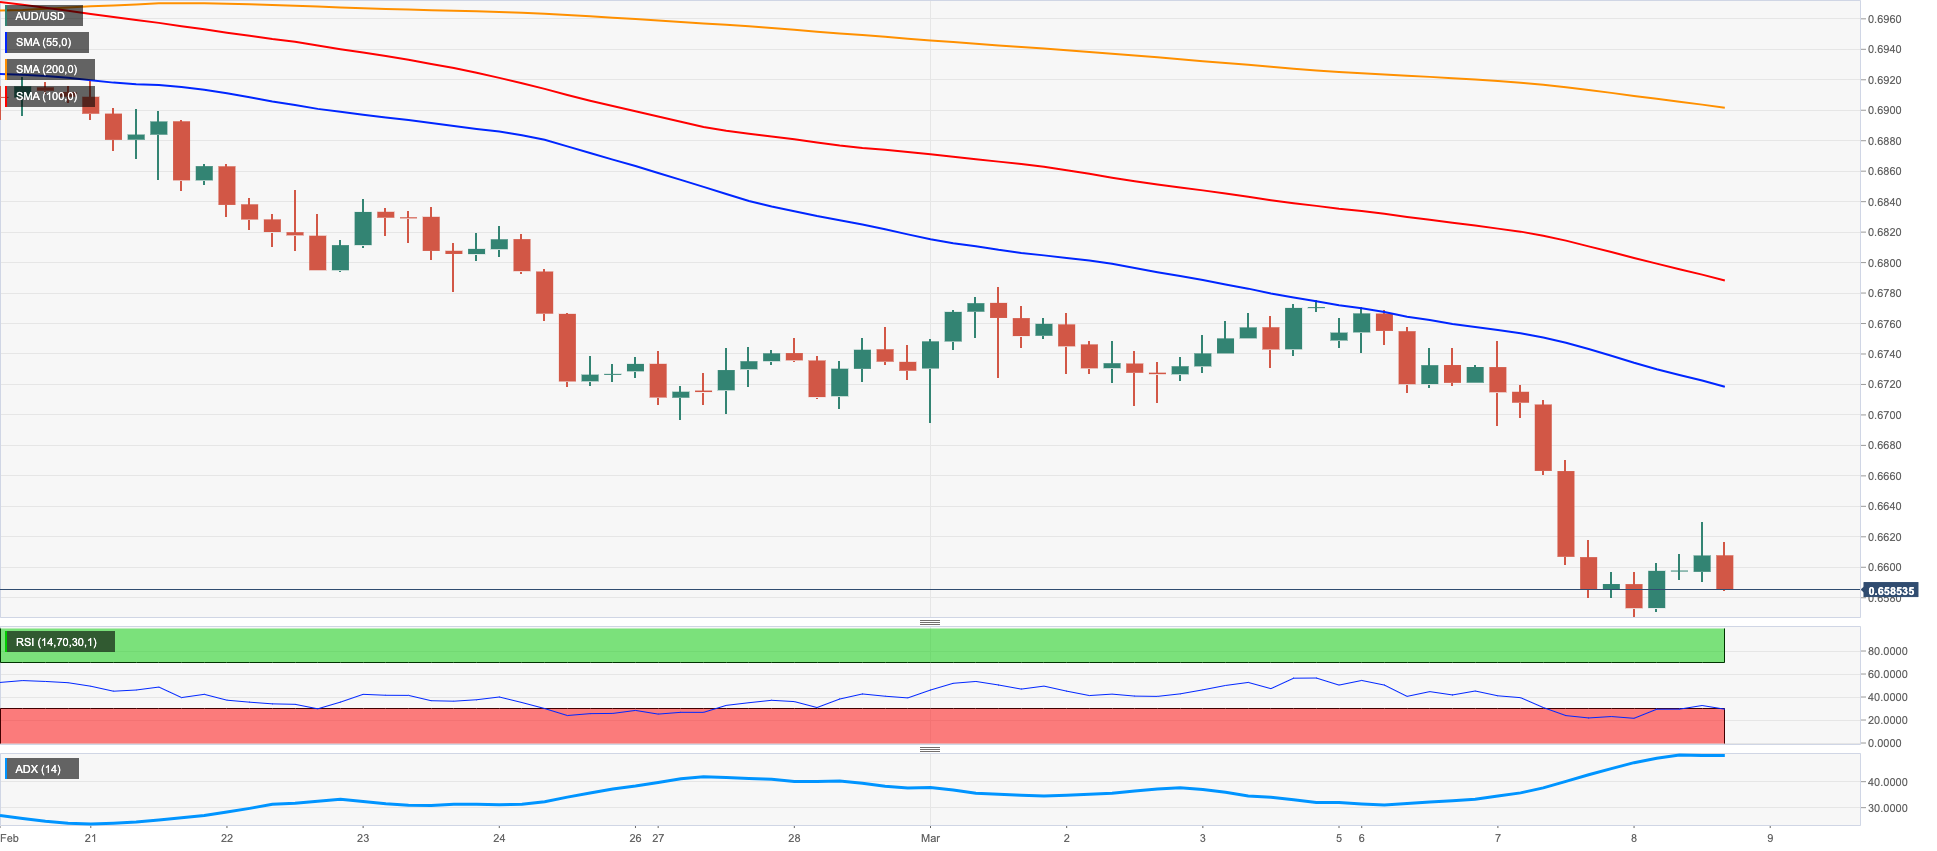
After bottoming out in fresh 4-month lows in the 0.6570/65 band, AUD/USD managed to regain some composure and regain Tuesday’s closing levels below the 0.6900 mark on Wednesday. The bounce in spot could also be deemed as a “technical” one following the move to the oversold territory after Tuesday’s sharp decline.
It has been quite a dreadful week for the Aussie dollar so far, as the currency suffered a "double whammy” of a dovish hike by the RBA and the unexpected hawkish tone from Powell at his testimony before Congress, both events on Tuesday.
In the meantime, the mixed note from the commodity complex seems to have helped the AUD following the rebound in copper prices and the iron ore.
At his speech at the Australian Financial Review’s Business Summit, Governor P.Lowe, reiterated that further rate hikes would be needed to bring inflation down to the bank’s target, at the time when he suggested that a pause to assess the state of the economy in light of the ongoing tightening cycle will have to wait a bit more. He also reiterated that decisions on rate hikes will depend on incoming data, particularly from the labour market.
If AUD/USD breaches the 2023 low at 0.6567 (March 8) it could then trigger a deeper retracement to the weekly low at 0.6386 (November 10 2022) ahead of the November 2022 low at 0.6272 (November 3). For all that, the key 200-day SMA at 0.6781 now turns up as the initial obstacle for any bullish attempts just before the weekly peak at 0.6783 (March 1). In case the rebound gathers extra impulse, then the pari could retest the interim 55-day SMA at 0.6874 ahead of the weekly high at 0.6920 (February 20), which is the last defense before an assault to the key round level at 0.7000, which in turn precedes another weekly top at 0.7029 (February 14). The daily RSI remained in the oversold territory around 29.
Resistance levels: 0.6726 0.6754 0.6799 (4H chart)
Support levels: 0.6567 0.6386 0.6271 (4H chart)
GOLD
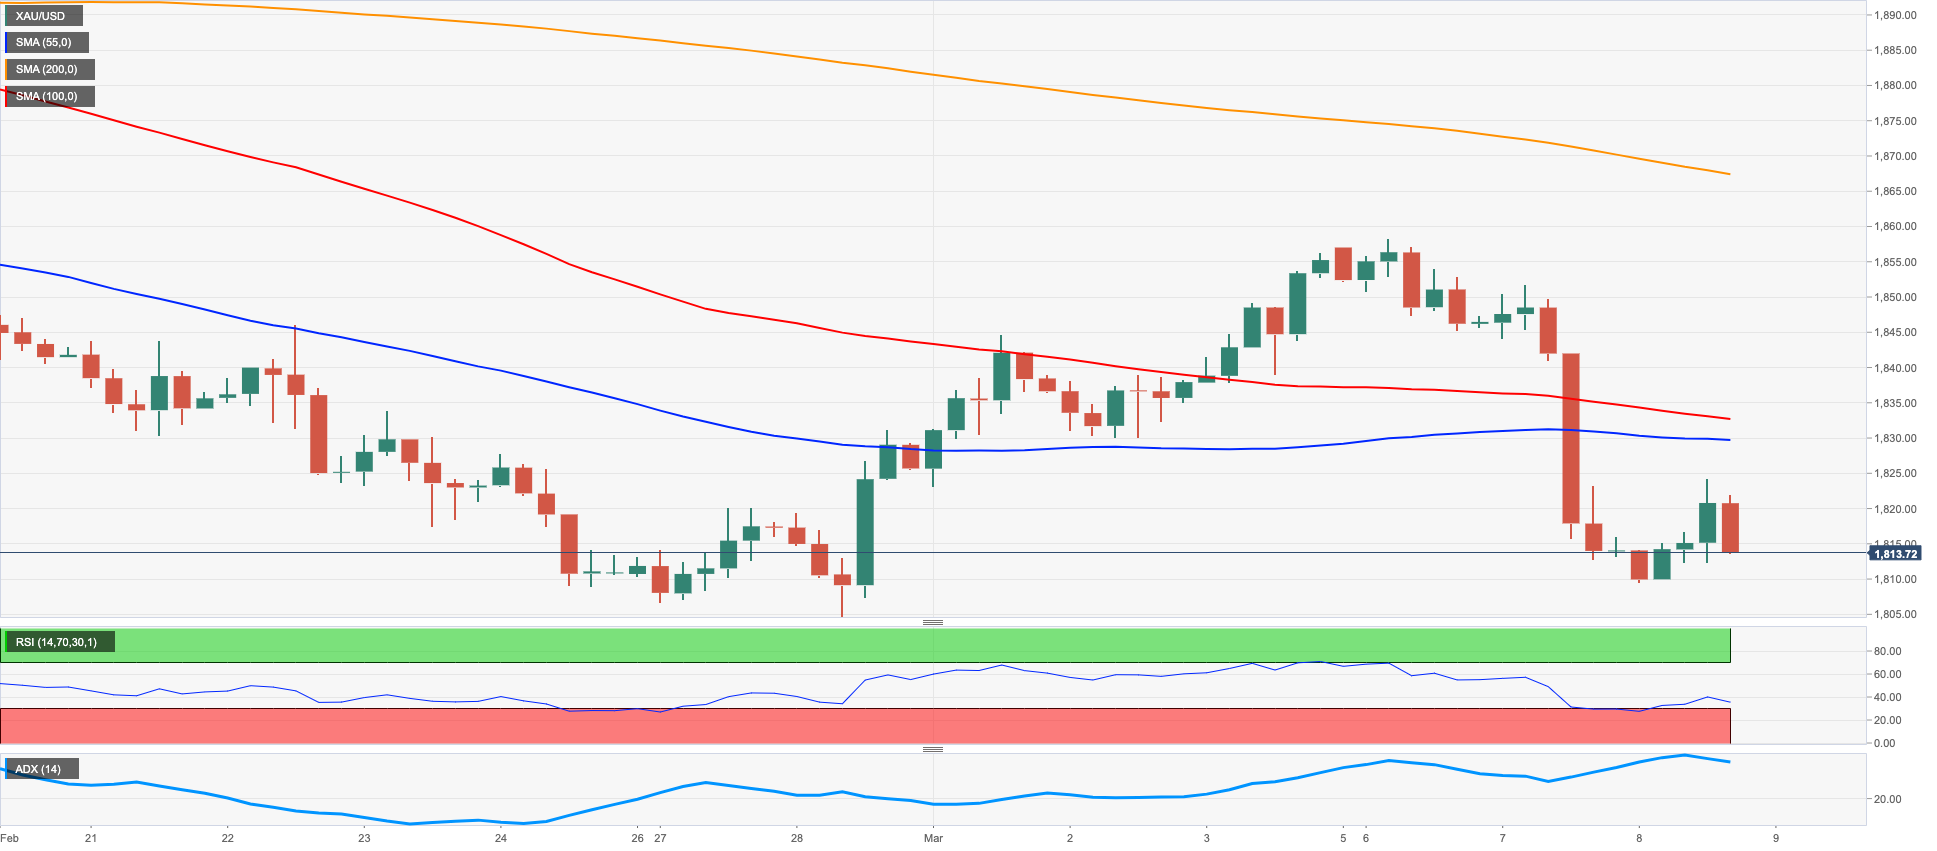
Gold prices navigated a narrow range and briefly revisited the $1810 level per ounce troy on Wednesday, or multi-session lows, where some initial support appears to have emerged.
The persistent advance in the greenback coupled with extra gains in US yields across the curve kept the price action around the precious metal subdued despite the humble gains for the day, all amidst renewed bets on a 50 bps rate hike at the March 22 event.
No news from Powell’s second testimony, which fell in line with the previous one, while traders are now expected to shift their focus of attention to Friday’s Nonfarm Payrolls and US inflation figures due on March 14.
Next on the downside for gold appears the 2023 low at $1804 (February 28), which remains propped up by the interim 100-day SMA at $1802 and the key $1800 zone. The loss of this region could put a visit to the key 200-day SMA at $1775 back on the traders’ radar before the weekly low at $1727 (November 23) and the November 2022 low at $1616 (November 3). Just the opposite, the next resistance level comes at the March peak at $1858 (March 6) just before the provisional 55-day SMA at $1863 and followed by the weekly high at $1890 (February 9). North from here turns up the 2023 top at $1959 (February 2) ahead of the April 2022 peak at $1998 (April 18) and the psychological $2000 level.
Resistance levels: $1858 $1870 $1890 (4H chart)
Support levels: $1804 $1784 $1765 (4H chart)
CRUDE WTI
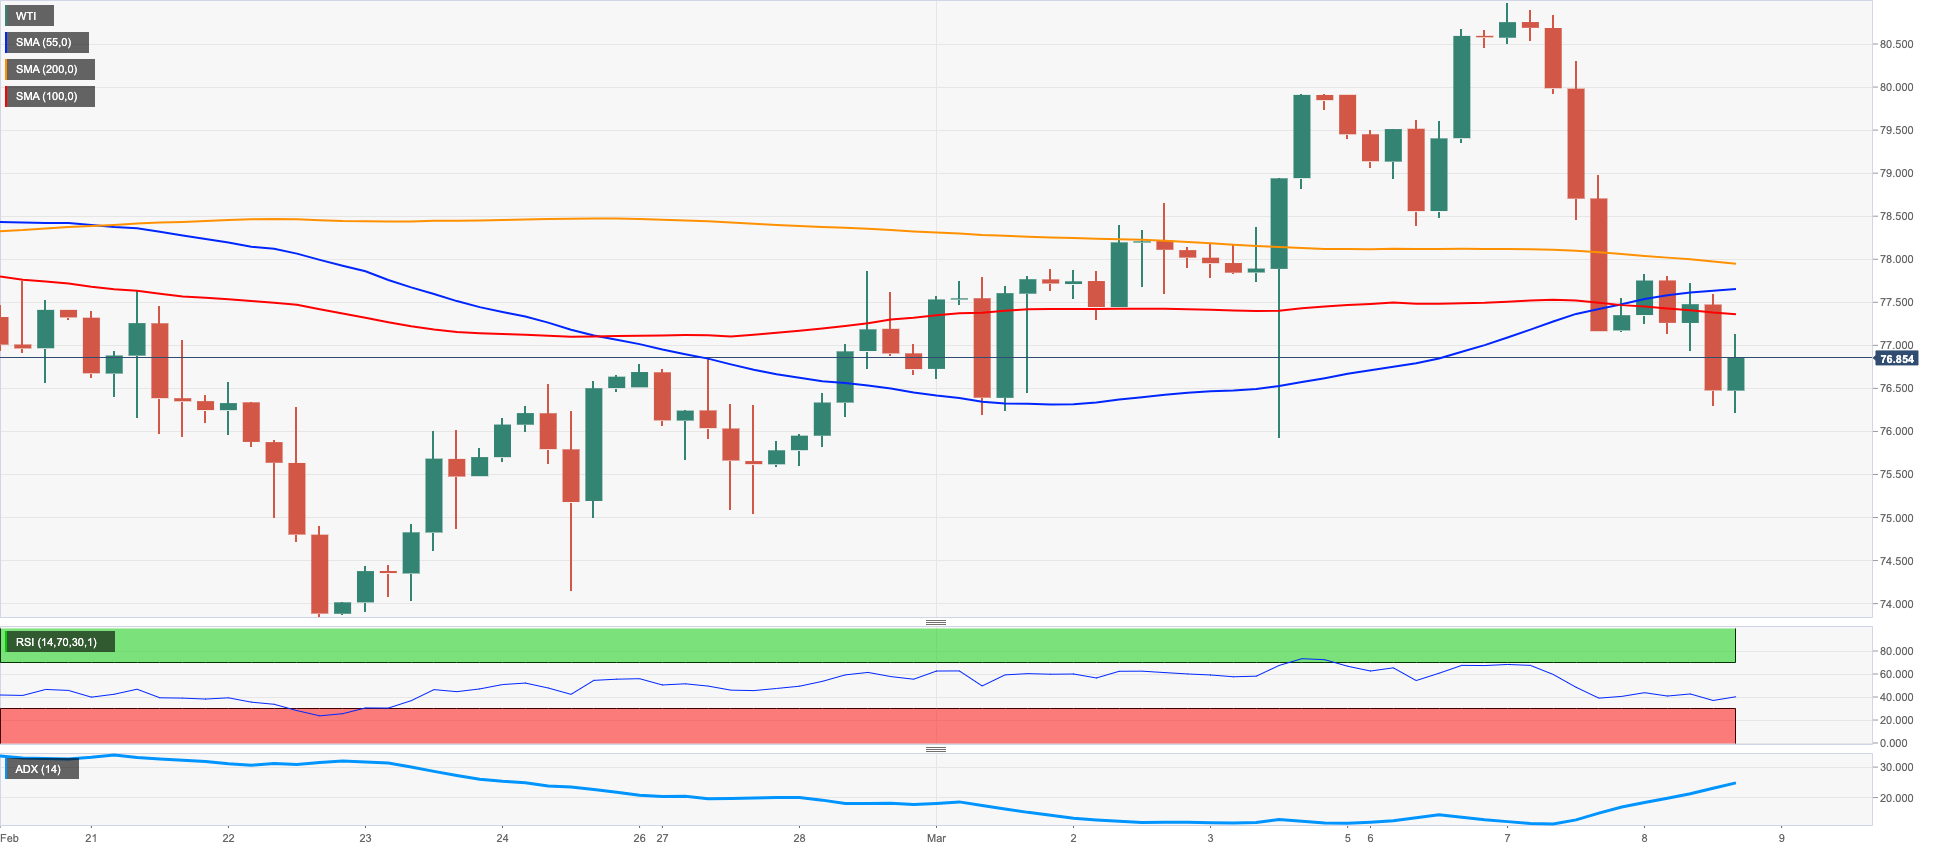
Prices of the barrel of the West Texas Intermediate (WTI) added to Tuesday’s decline and briefly visited the vicinity of the $76.00 mark on Wednesday.
The spectre of an economic slowdown was hovering around traders once again on Wednesday on the back of demand concerns, which remained well underpinned by the prospects for a tighter-for-longer stance from the Federal Reserve, as per recent testimonies by Chief Powell.
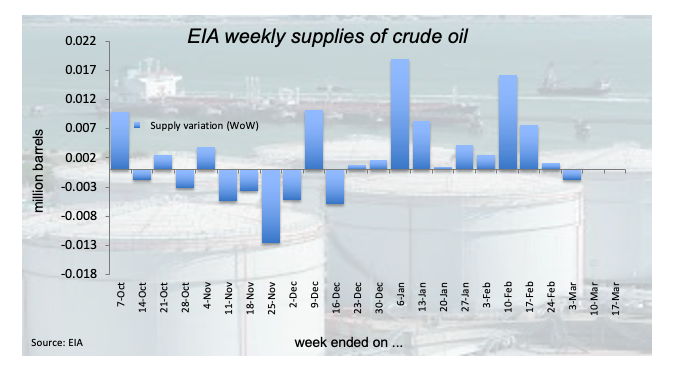
Somewhat limiting the downside in the commodity appeared the unexpected drop (after ten consecutive weekly builds) of 1.694M barrels of US crude oil inventories in the week to March 3, according to the EIA’s weekly report. In addition, supplies at Cushing dropped by 0.890M barrels, Weekly Distillate Stocks rose by 0.138M barrels and gasoline stockpiles went down by 1.134M barrels.
If bears push harder, then the WTI could put the weekly low at $73.83 (February 22) to the test prior to the 2023 low at $72.30 (February 6). The breakdown of the latter could prompt a probable visit to the 2022 low at $70.10 (December 9) to emerge on the horizon before the key round level at $70.00. Having said that, the March high at $80.90 (March 7) emerges as the initial up-barrier seconded by the 2023 top at $82.60 (January 23) and the December 2022 peak at $83.32 (December 1). Further gains could challenge the $90.08 level (November 11 2022) ahead of the November 2022 high at $93.73 (November 7).
Resistance levels: $80.90 $82.60 $83.32 (4H chart)
Support levels: $76.16 $75.80 $73.77 (4H chart)
GER40
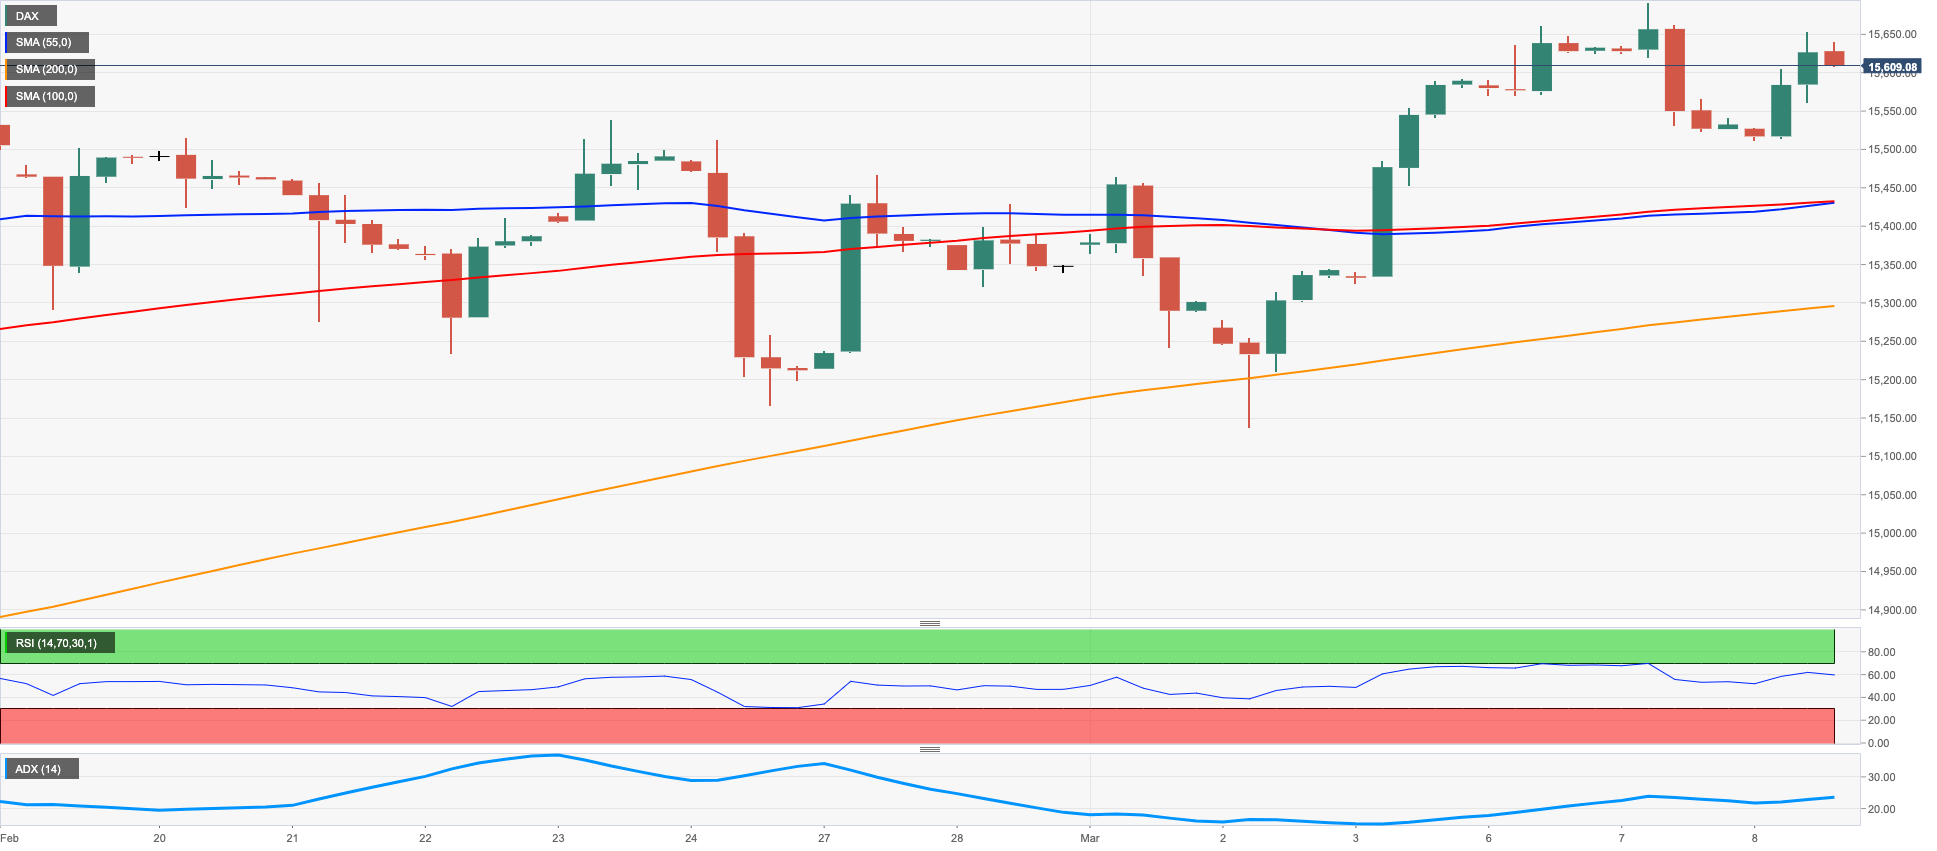
Equities tracked by the German reference DAX40 faded Tuesday’s pullback and charted decent gains beyond the 15600 level on Wednesday, in line with most of its European peers (with the exception of France’s CAC40).
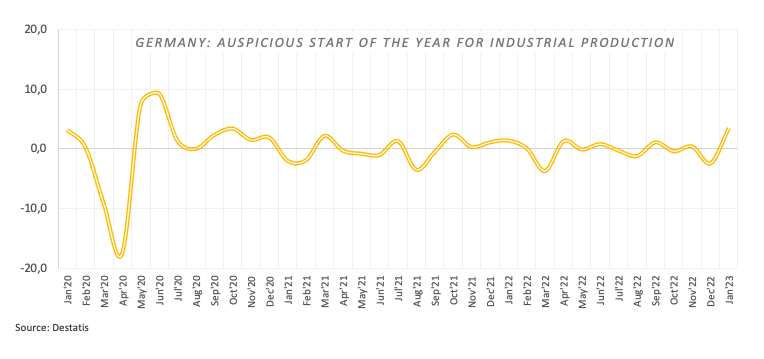
Traders managed to somewhat shrug off concerns following Powell’s hawkish message at his testimony on Tuesday, focusing instead on the positive results from German Industrial Production and despite the disheartening prints from the high street.
On the latter, Industrial Production expanded at a monthly 3.5% during January, while Retail Sales contracted 0.3% vs. the previous month.
In the money market, the 10-year Bund yields receded to multi-day lows near 2.60%, down from the second session in a row.
The resumption of the bullish pressure should motivate the DAX40 to dispute once again the 2023 peak at 15706 (March 6) ahead of the February 2022 high at 15736 (February 2 2022). The surpass of the latter exposes the round level at 16000 before the 2022 high at 16285 (January 5). On the flip side, the March low at 15150 (March 2) should hold the initial test followed by the interim 55-day SMA at 15031 and the weekly low at 14906 (January 19). Further down emerges the 100-day SMA at 14530 and the more relevant 200-day SMA at 13812. The daily RSI advanced slightly above 61.
Best Performers: Continental AG, Infineon, Bayer
Worst Performers: Sartorius AG VZO, Merck, Brenntag AG
Resistance levels: 15706 15736 15912 (4H chart)
Support levels: 15524 15150 14888 (4H chart)
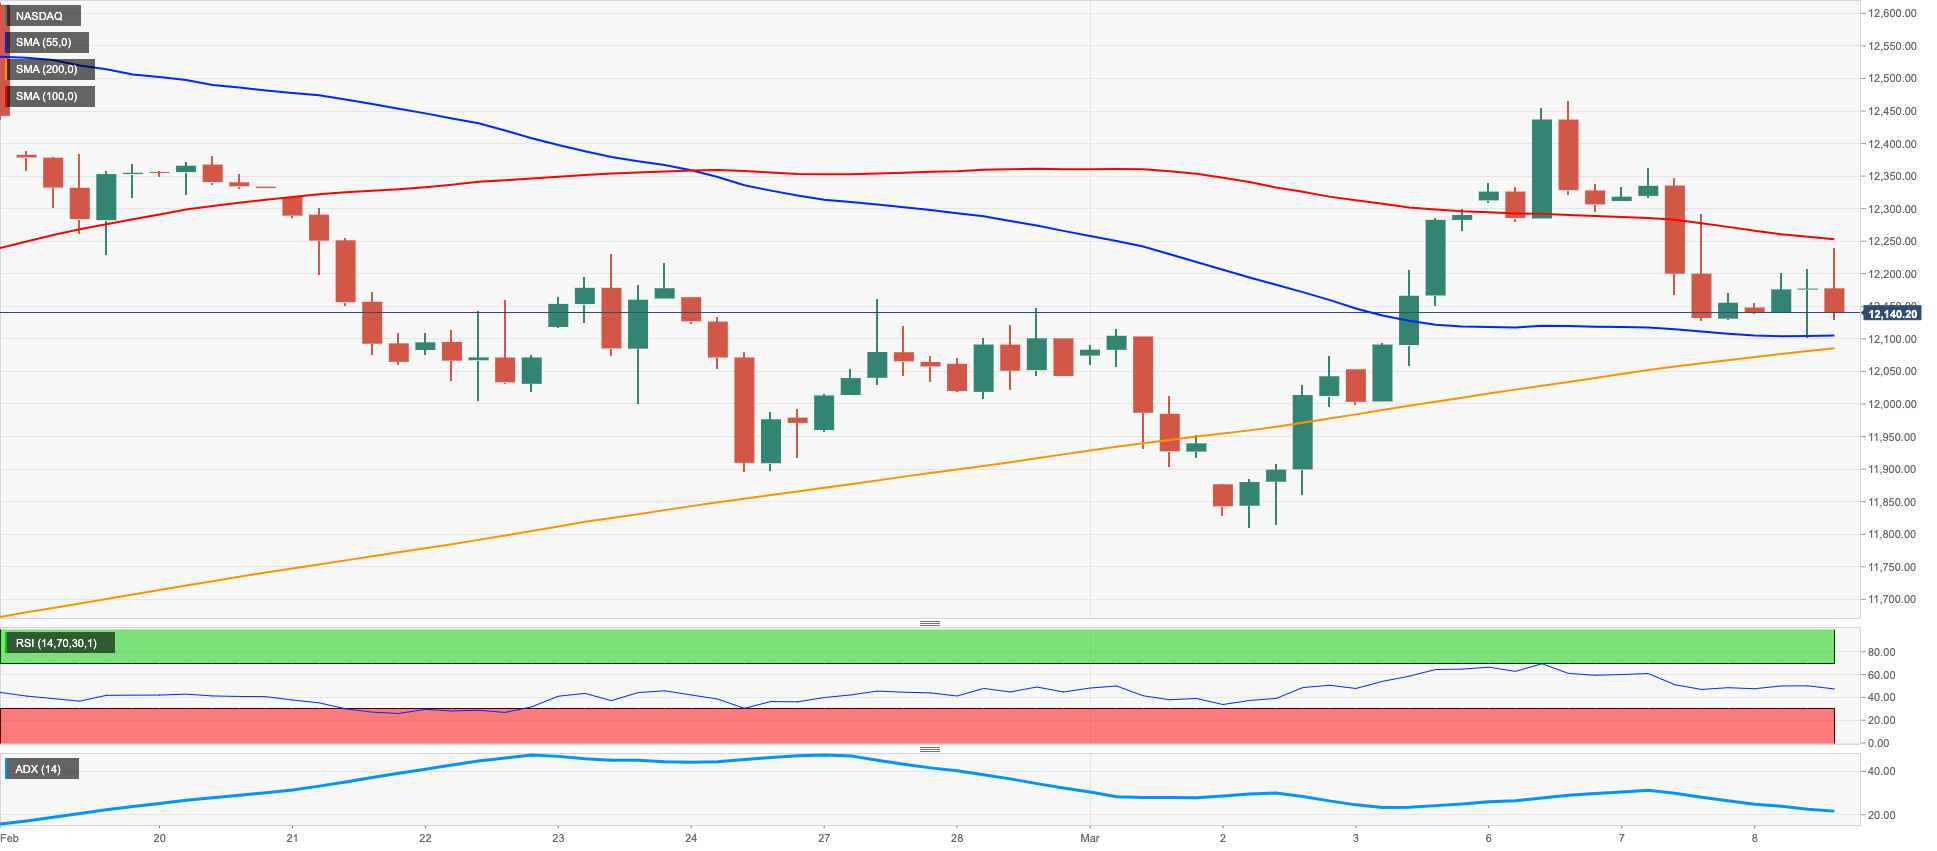
NASDAQ
Tech equities measured by the Nasdaq 100 added to Tuesday’s marked pullback amidst the persistent improvement in the sentiment surrounding the dollar and the unabated march north in US yields.
No surprises at the second testimony by Fed’s Powell, as investors continued to adjust to his recent hawkish message and prospects indicating that the Fed will stay in the restrictive territory for longer.
The key 200-day SMA at 11903 remains the immediate contention in case the selling pressure around the Nasdaq 100 accelerates. Once this region is breached, the index could challenge the March low at 11830 (March 2) followed by the 55- and 100-day SMAs at 11779 and 11632, respectively. Further weakness could see weekly lows at 11550 (January 25) and 11251 (January 19) revisited ahead of the 2023 low at 10696 (January 6) and the December 2022 low at 10671 (December 22). In the opposite direction, bullish attempts are expected to target the March high at 12466 (March 6) before the weekly top at 12689 (February 15) and the 2023 peak at 12880 (February 2). Up from here aligns the round level at 13000 before the weekly high at 13175 (August 26 2022). The daily RSI eased to the vicinity of 50.
Top Gainers: Marvell, Crowdstrike Holdings, AMD
Top Losers: Enphase, Datadog, Sirius XM
Resistance levels: 12466 12689 12880 (4H chart)
Support levels: 12102 11830 11613 (4H chart)
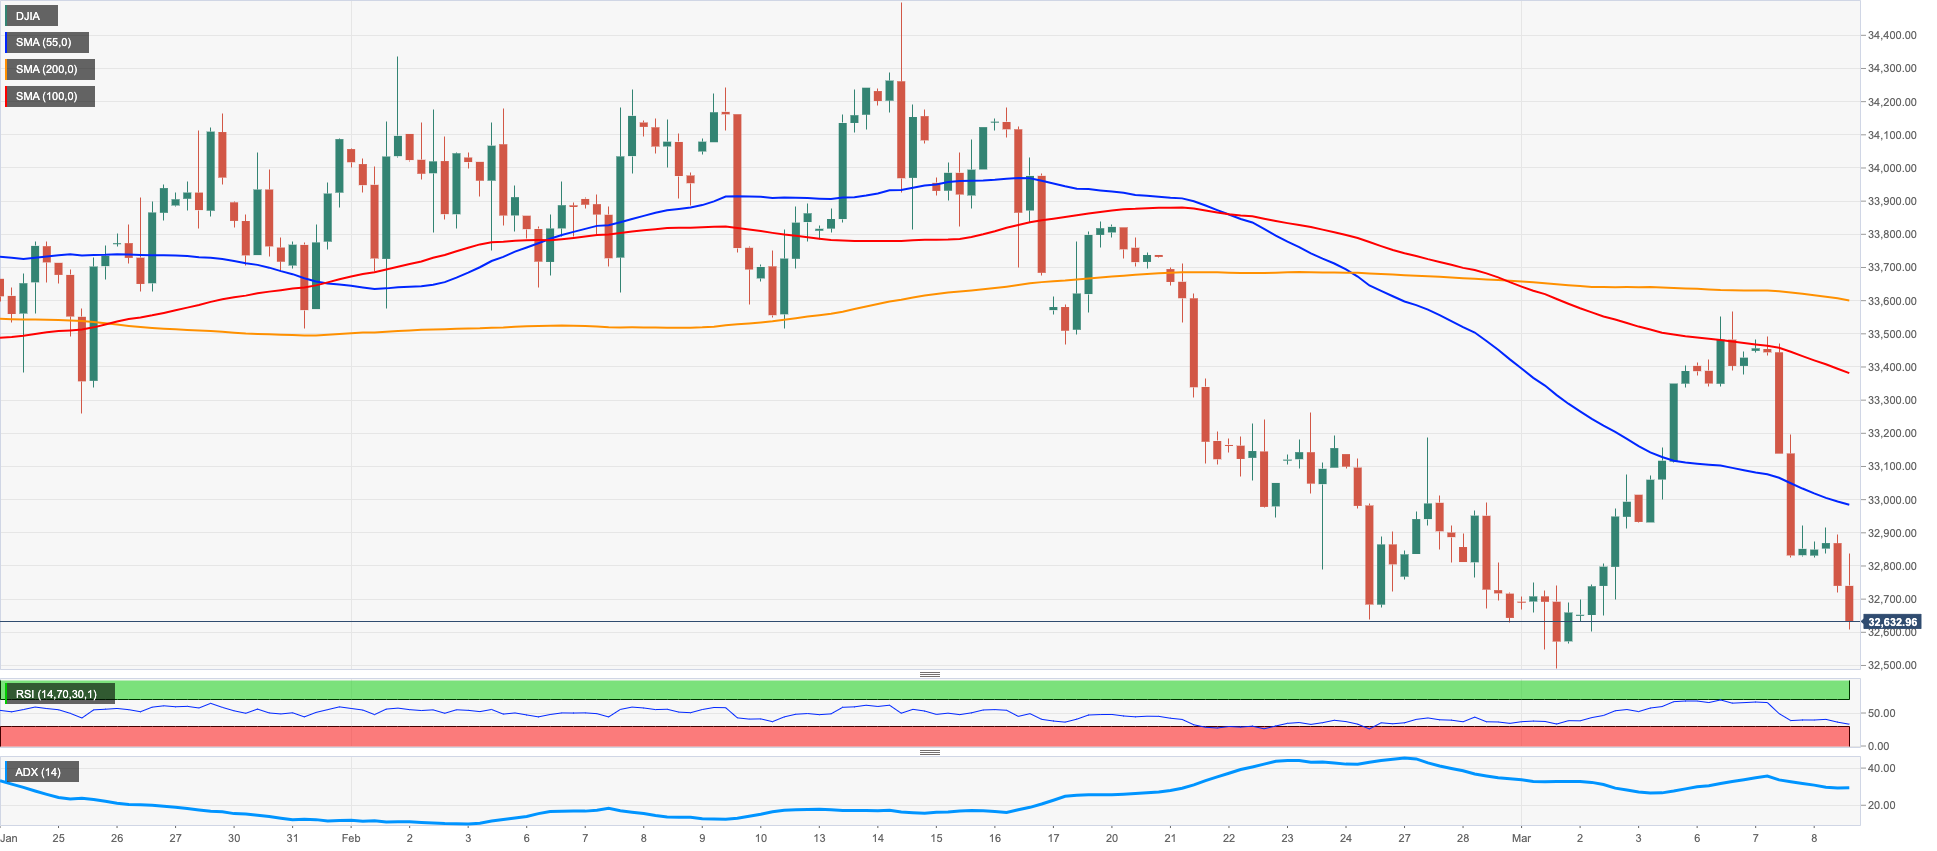
DOW JONES
The US stock benchmark Dow Jones retreated for the second consecutive session on Wednesday, almost fully fading the sharp rebound seen at the beginning of the month.
The bearish mood among traders remained justified by concerns that the Federal reserve might stick to its tightening cycle for longer than expected amidst inflation still well above the Fed’s target and no signs of any weakness in the US labour market.
Another positive session in the greenback and higher yields also undermined the sentiment midweek and propped up the increasing cautiousness ahead of the release of the US jobs report on Friday.
On the whole, the Dow Jones deflated 0.60% to 32665 the S&P500 retreated 0.24% to 3976 and the tech-heavy Nasdaq Composite dropped 0.04% to 11525.
Next on the downside for the Dow comes the 2023 low at 32500 (March 1) just before the key 200-day SMA at 32386. Once this region is cleared, the index could slip back to the November 2022 low at 31727 (November 3) prior to the 2022 low at 28660 (October 13). By contrast, the 100- and 55-day SMAs at 33203 and 33473, respectively, should offer temporary resistance closely followed by the March peak at 33572 (March 6) and the 2023 high at 34342 (January 13). North from here emerges the December 2022 top at 34712 (December 13) prior to the April 2022 peak at 35492 (April 21) and the February 2022 high at 35824 (February 9). The daily RSI deflated to the sub-40 area.
Top Performers: Dow, Caterpillar, Apple
Worst Performers: Merck&Co, McDonald’s, UnitedHealth
Resistance levels: 33147 33572 34331 (4H chart)
Support levels: 32640 32500 31727 (4H chart)
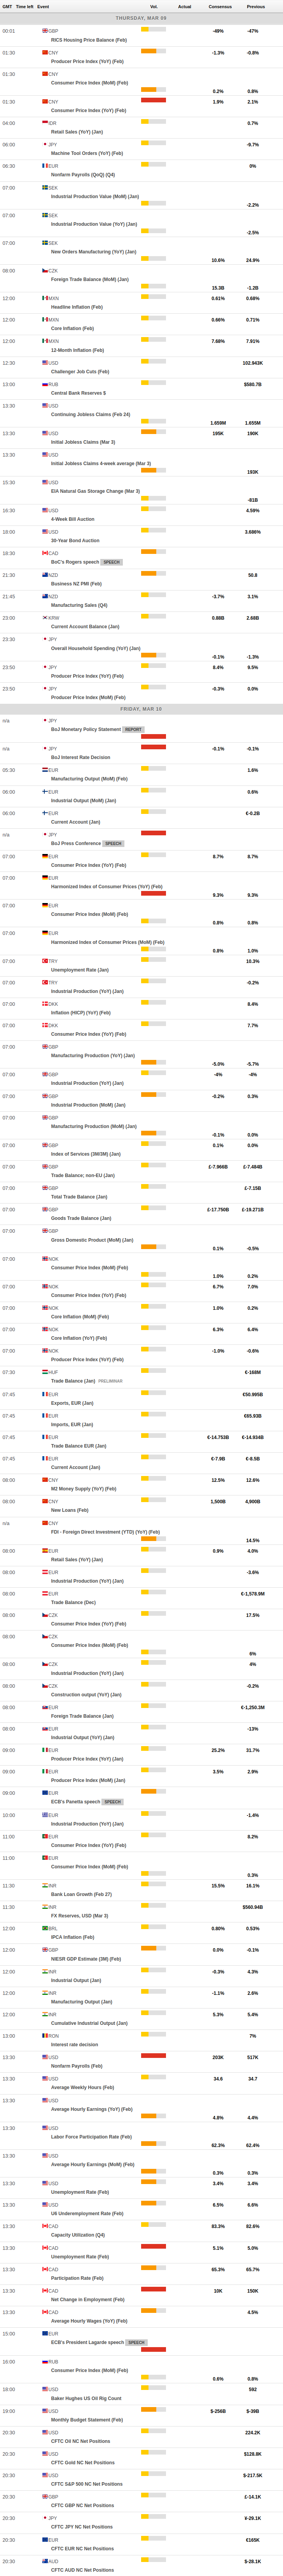
MACROECONOMIC EVENTS
All Information & Updates provided by:

All information relating to the financial markets available on this page has been prepared and issued by FXStreet (Forexstreet SL, Spain, Reg: B62498233) on the basis of publicly available information and all information believed to be reliable and does not conflict with Kuwaiti local laws, and all necessary care has been taken to before the company to ensure that the facts mentioned are correct from the source.
NCM Investment nor any of its directors or employees shall in any way be held responsible for the contents of this news, and the information contained on this page is intended only to provide clients with publicly available information and should not be construed as investment advice, report or analysis and/or constitute an offer or invitation to buy or sell financial instruments of any kind.
RISK WARNING: Forex and CFDs are highly risky leveraged products, as losses can exceed deposits. Please ensure you understand all the risks and take independent advice if necessary. NCM will segregate the clients based on the criteria of the regulator and its bylaws. NCM does not provide any advisory service; the material published does not constitute advice or a recommendation for a transaction in any financial instrument. NCM accepts no responsibility for any use of the content presented and any consequences of that use. Anyone acting on the information provided does so at their own risk.