
- Contact Us:
-

-

-

-


Daily Market Updates
10 Mar 2023
USDJPY
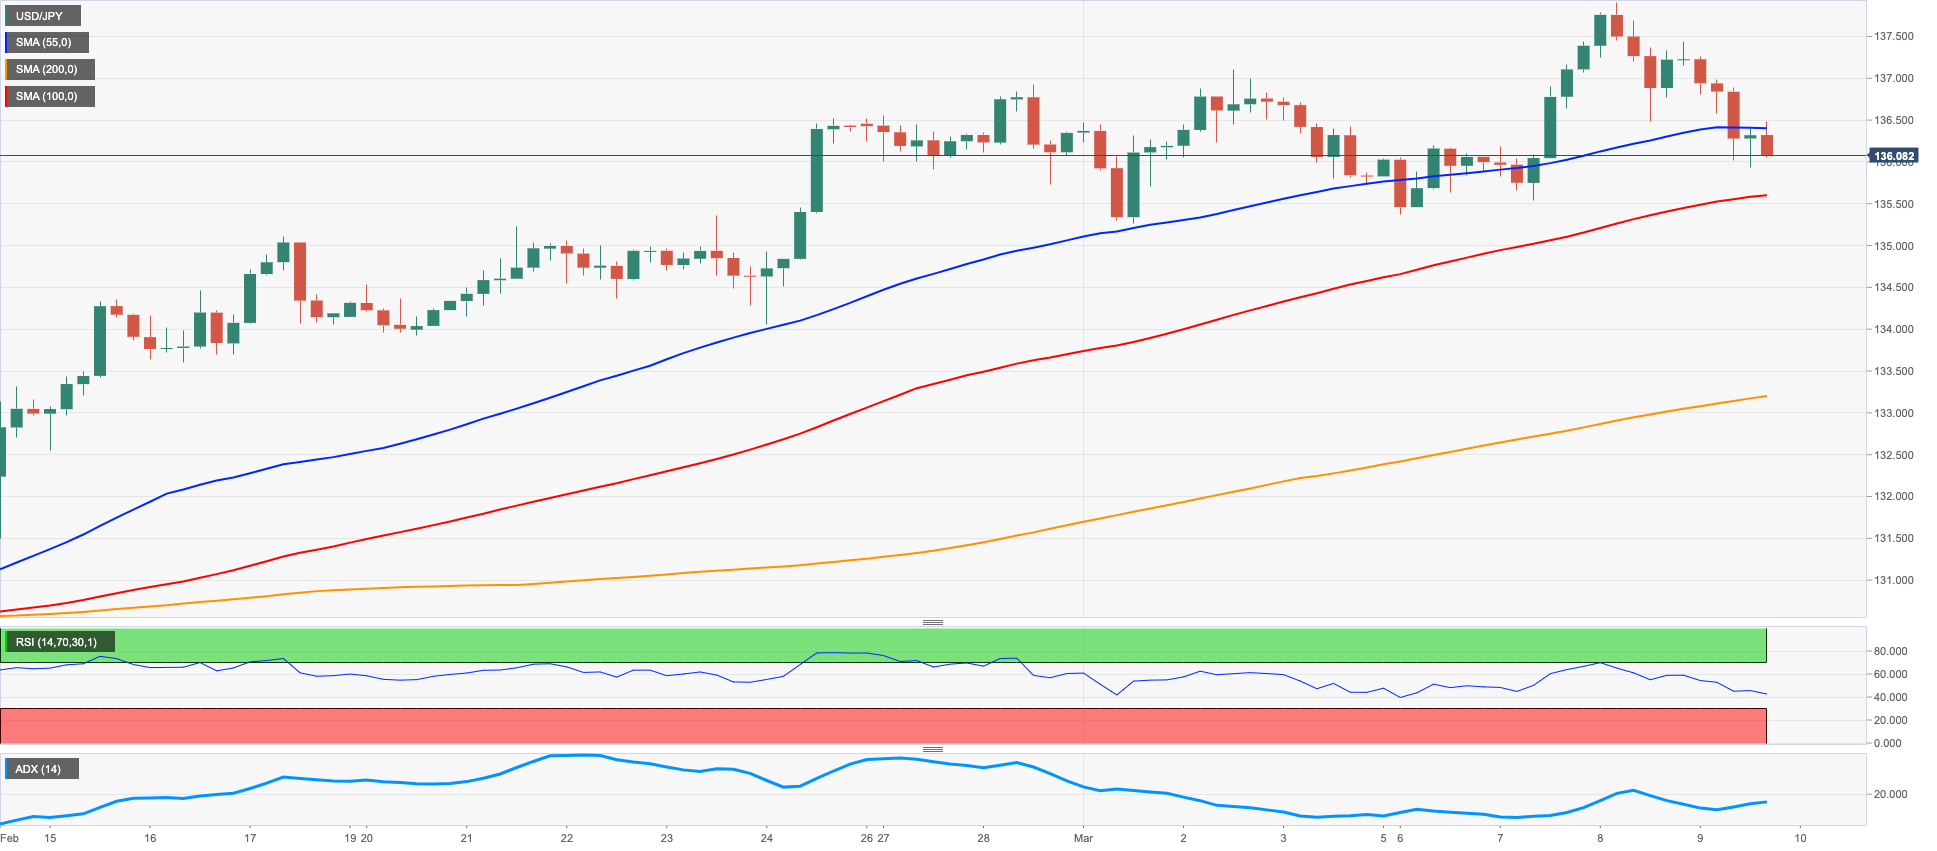
Following three straight sessions with gains, including Wednesday’s 2023 high in levels just shy of 138.00 the figure, USD/JPY met some moderate correction and briefly visited the sub-136.00 zone on Thursday.
The downtick in spot followed the equally marked decline in the greenback – which forced the USD Index (DXY) to abandon the area of recent 2023 highs near 106.00 – as investors seem to have cashed up part of the recent advance ahead of the release of the key US jobs report on Friday.
Collaborating with the pair’s retracement appeared the pullback in US yields across the curve vs. the protracted consolidative fashion still in place in the Japanese bond market, where JGB 10-year yields kept the trade around the 0.50% mark
In the Japanese docket, final GDP figures showed the economy expanded at an annualized 0.4% in the October-December 2022 period and came in flat vs. the previous quarter. In addition, Foreign Bond Investment contracted ¥168.6B in the week to March 4 and Machine Tool Orders shrank 10.7% in the year to February.
Immediately to the upside for USD/JPY comes the 2023 high at 137.91 (March 8) prior to weekly tops at 138.17 (December 15 2022) and 139.89 (November 30 2022), all preceding the key round level at 140.00 and the weekly peak at 142.25 (November 21 2022). The other way around, there are no contention of note before the 134.05 level (February 24), while the breach of the latter is expected to put the provisional 55-day SMA at 132.39 back on the investors’ radar ahead of the weekly low at 129.79 (February 10) and the February low at 128.08 (February 2). South from here comes the 2023 low at 127.21 (January 16). The daily RSI lost the grip and broke below the 60 yardstick.
Resistance levels: 137.91 138.17 139.89 (4H chart)
Support levels: 135.93 135.25 134.05 (4H chart)
GBPUSD
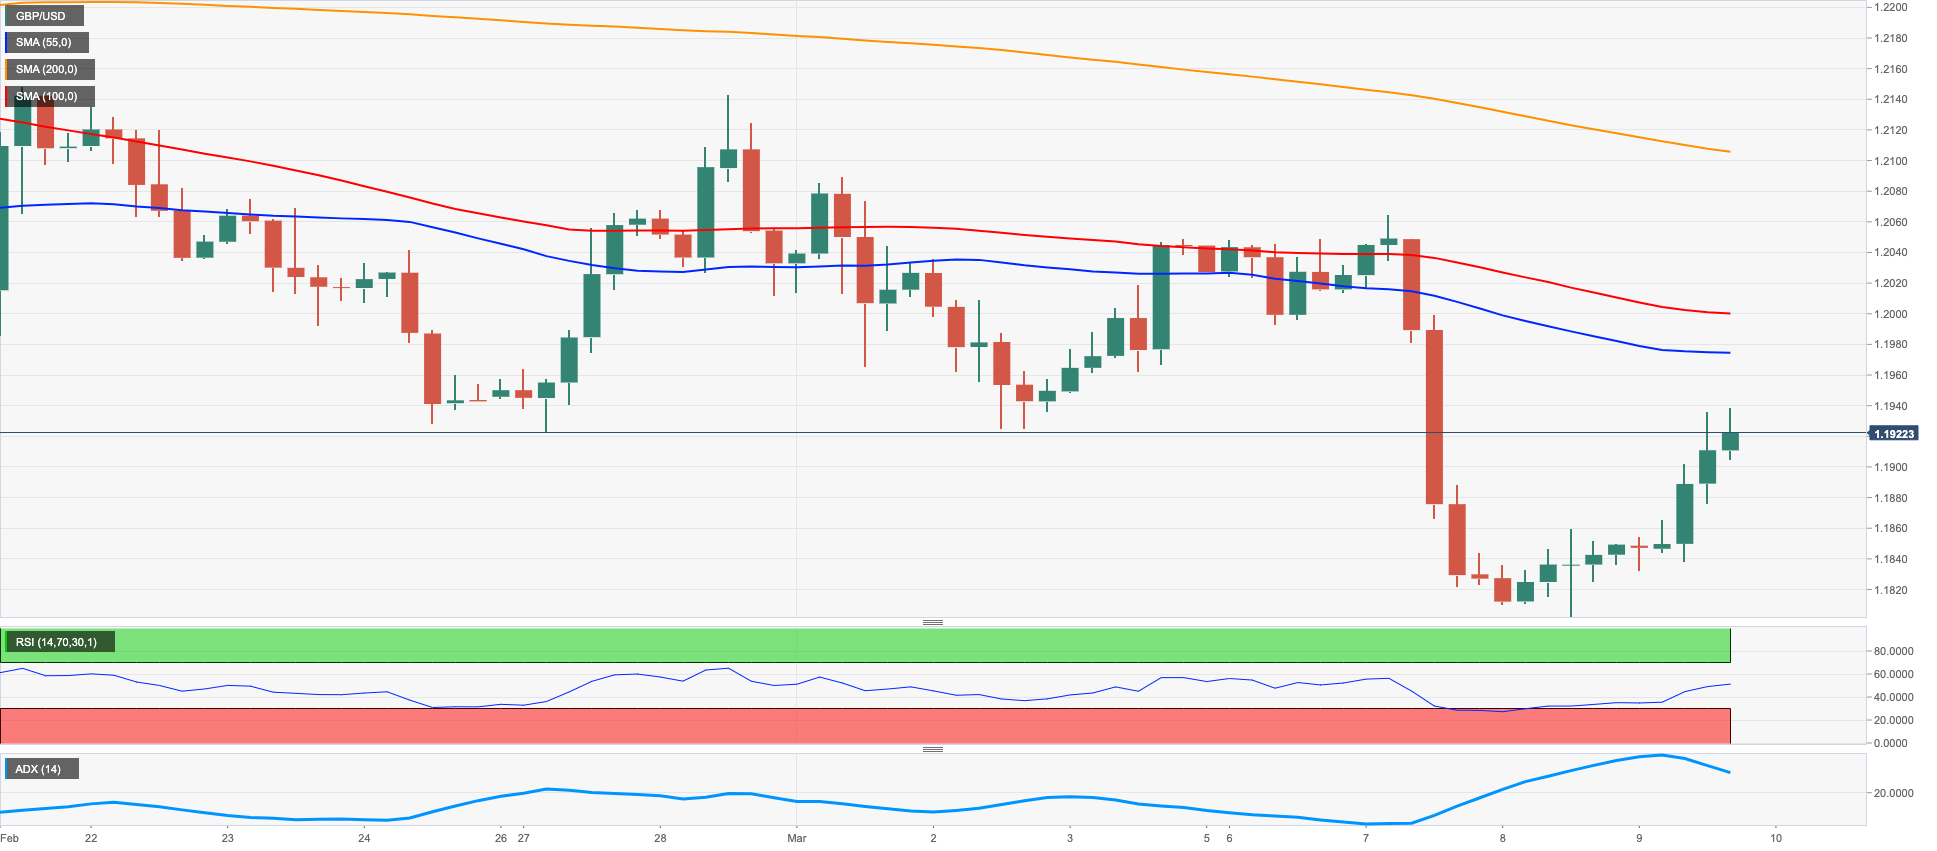
Further correction in the greenback lent some extra wings to the risk complex and lifted GBP/USD to 2-day highs beyond 1.1900 the figure on Thursday.
Indeed, the better sentiment around the quid helped Cable surpass the key 200-day SMA once again, all after bottoming out in the 1.1800 neighbourhood during the previous session.
As a matter of fact, the dollar came under marked pressure following recent yearly highs after investors kept digesting the prospects for the continuation of the hiking cycle by the Federal Reserve amidst persistent elevated inflation and the solid labour market.
In addition, the recovery in the British pound came in tandem with the rebound in the 10-year Gilt yields past the 3.80% region after two consecutive daily pullbacks.
In the UK, the RICS House Price Balance worsened to -48% for the month of February (from -46%).
If GBP/USD breaks below the 2023 low at 1.1802 (March 8) it could spark further downside to the November 2022 low at 1.1142 (November 4). On the contrary, a convincing breakout of the key 200-day SMA at 1.1900 could pave the way for a test of the interim 100-day SMA at 1.2007 prior to the temporary 55-day SMA at 1.2118. Up from here emerges the weekly peak at 1.2147 (February 21) ahead of another weekly high at 1.2269 (February 14) and the 2023 top at 1.2447 (January 23). The daily RSI improved past the 43 hurdle.
Resistance levels: 1.1938 1.2005 1.2065 (4H chart)
Support levels: 1.1802 1.1762 1.1333 (4H chart)
AUDUSD
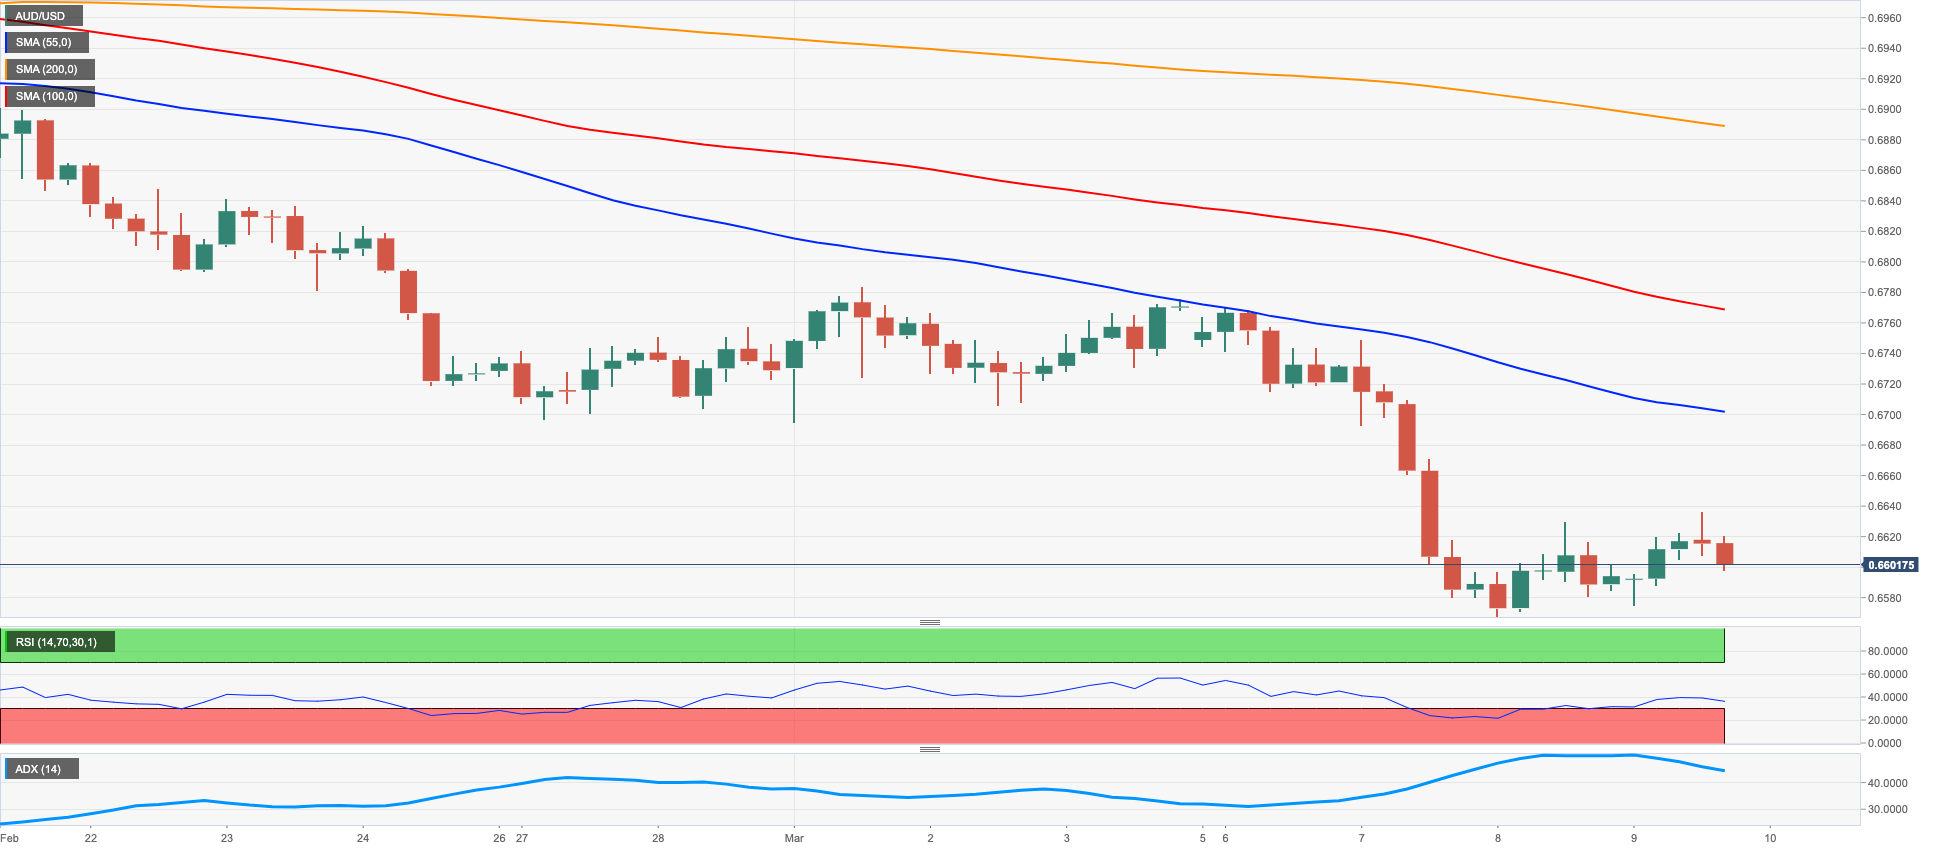
AUD/USD added to Wednesday’s small uptick and advanced modestly north of the 0.6600 barrier on Thursday.
The corrective decline in the greenback was accompanied by a similar move in US yields and this helped the Aussie dollar reclaim further ground lost earlier in the week and particularly in the wake of Powell’s testimony and the dovish hike by the RBA (both on Tuesday).
In addition, the mixed tone in the commodity galaxy saw copper prices receding humbly and the iron ore advancing marginally, all limiting the upside potential in AUD.
Data wise Down Under, final figures saw Building Permits contracting 27.6% in January vs. a month earlier and 8.4% over the last twelve months. Furthermore, Private House Approvals contracted at a monthly 13.8% also during the first month of the year.
Next on the downside for AUD/USD comes the 2023 low at 0.6567 (March 8). The breach of this level could prompt the weekly low at 0.6386 (November 10 2022) to emerge on the horizon prior to the November 2022 low at 0.6272 (November 3). On the opposite side, the breakout of the key 200-day SMA at 0.6778 exposes a rapid visit to the weekly high at 0.6783 (March 1) and the temporary 55-day SMA at 0.6873. North from here aligns the weekly top at 0.6920 (February 20) just ahead of the key round level at 0.7000 and another weekly peak at 0.7029 (February 14). The daily RSI rebounded and approached the 32 mark.
Resistance levels: 0.6636 0.6702 0.6774 (4H chart)
Support levels: 0.6567 0.6386 0.6271 (4H chart)
GOLD
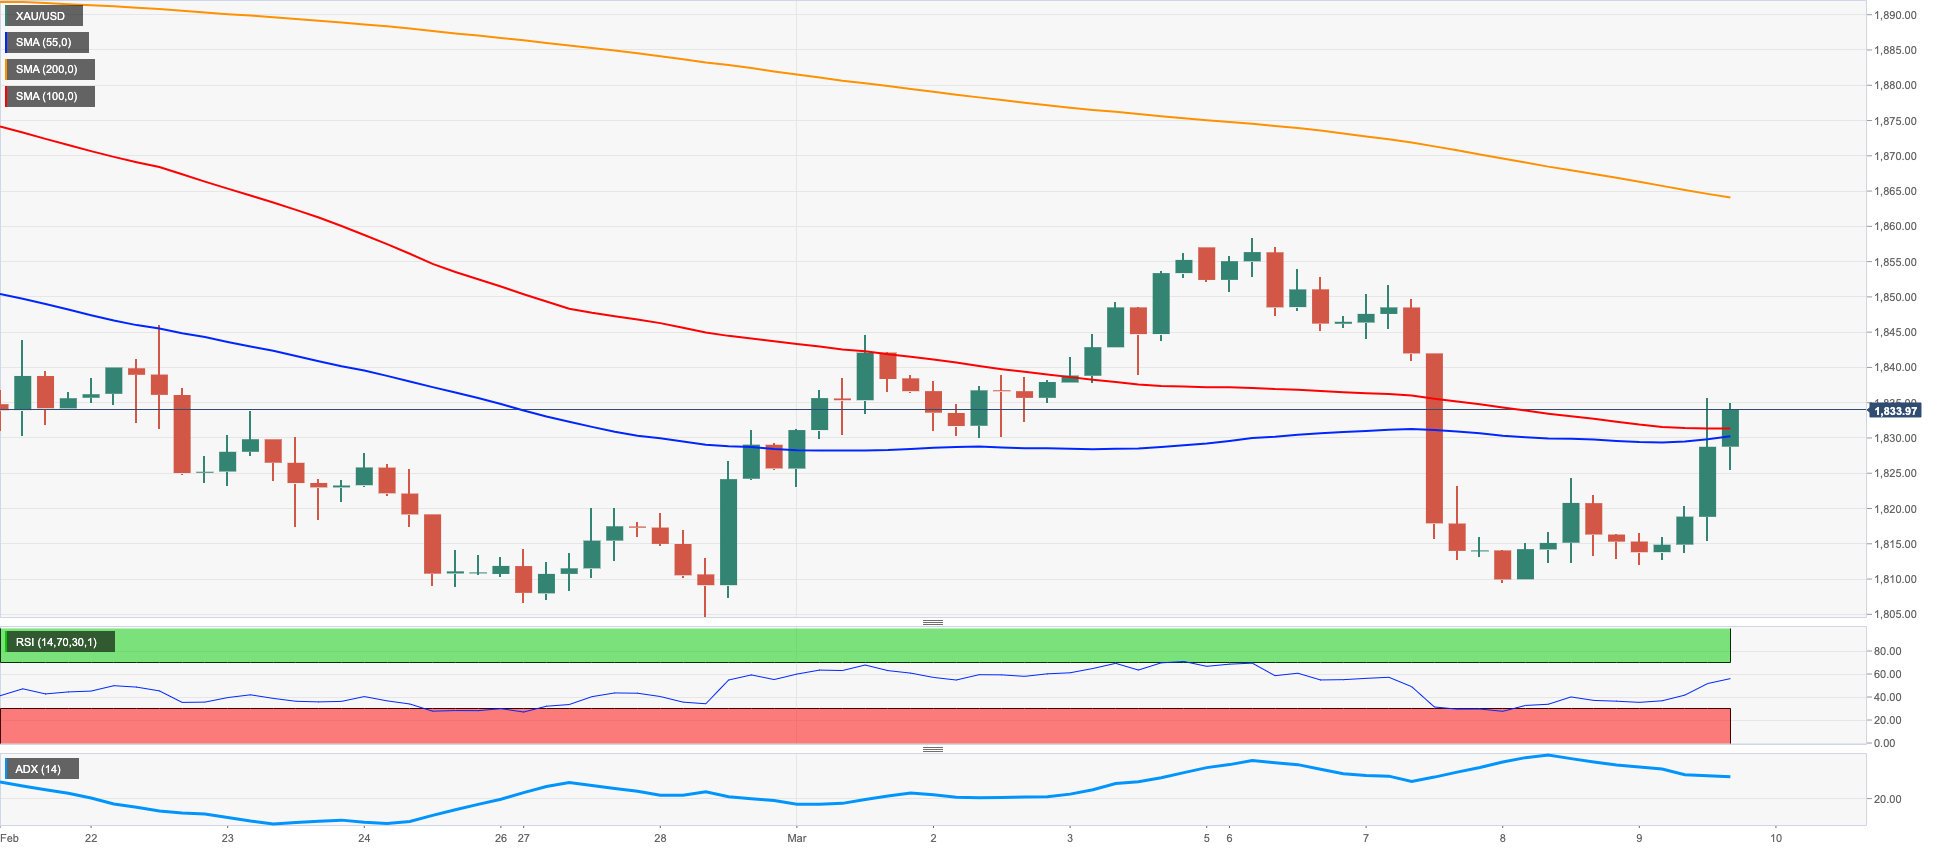
Prices of the ounce troy of the yellow metal extended the recovery from Wednesday’s weekly lows and managed to advance past the $1830 mark on Thursday.
The move to 2-day peaks in bullion was this time underpinned by the marked retracement in the greenback, which was in turn accompanied by a corrective pullback in US yields across the curve.
Moving forward, the next risk event for the yellow metal is expected to be the release of the US jobs report on Friday against the backdrop of rising conviction of a 50 bps interest rate hike by the Fed at the March event.
The continuation of the recovery in gold now targets the March high at $1858 (March 6) prior to the interim 55-day SMA at $1863 and the weekly top at $1890 (February 9). The surpass of this level could prompt the metal to confront the 2023 peak at $1959 (February 2) seconded by the April 2022 high at $1998 (April 18) and the psychological $2000 level. For all that, initial contention remains at the 2023 low at $1804 (February 28), an area coincident with the provisional 100-day SMA and just before the key $1800 region. The drop below this area could pave the way for a move to the 200-day SMA at $1775 back ahead of the weekly low at $1727 (November 23) and the November 2022 low at $1616 (November 3).
Resistance levels: $1835 $1858 $1870 (4H chart)
Support levels: $1804 $1784 $1765 (4H chart)
CRUDE WTI
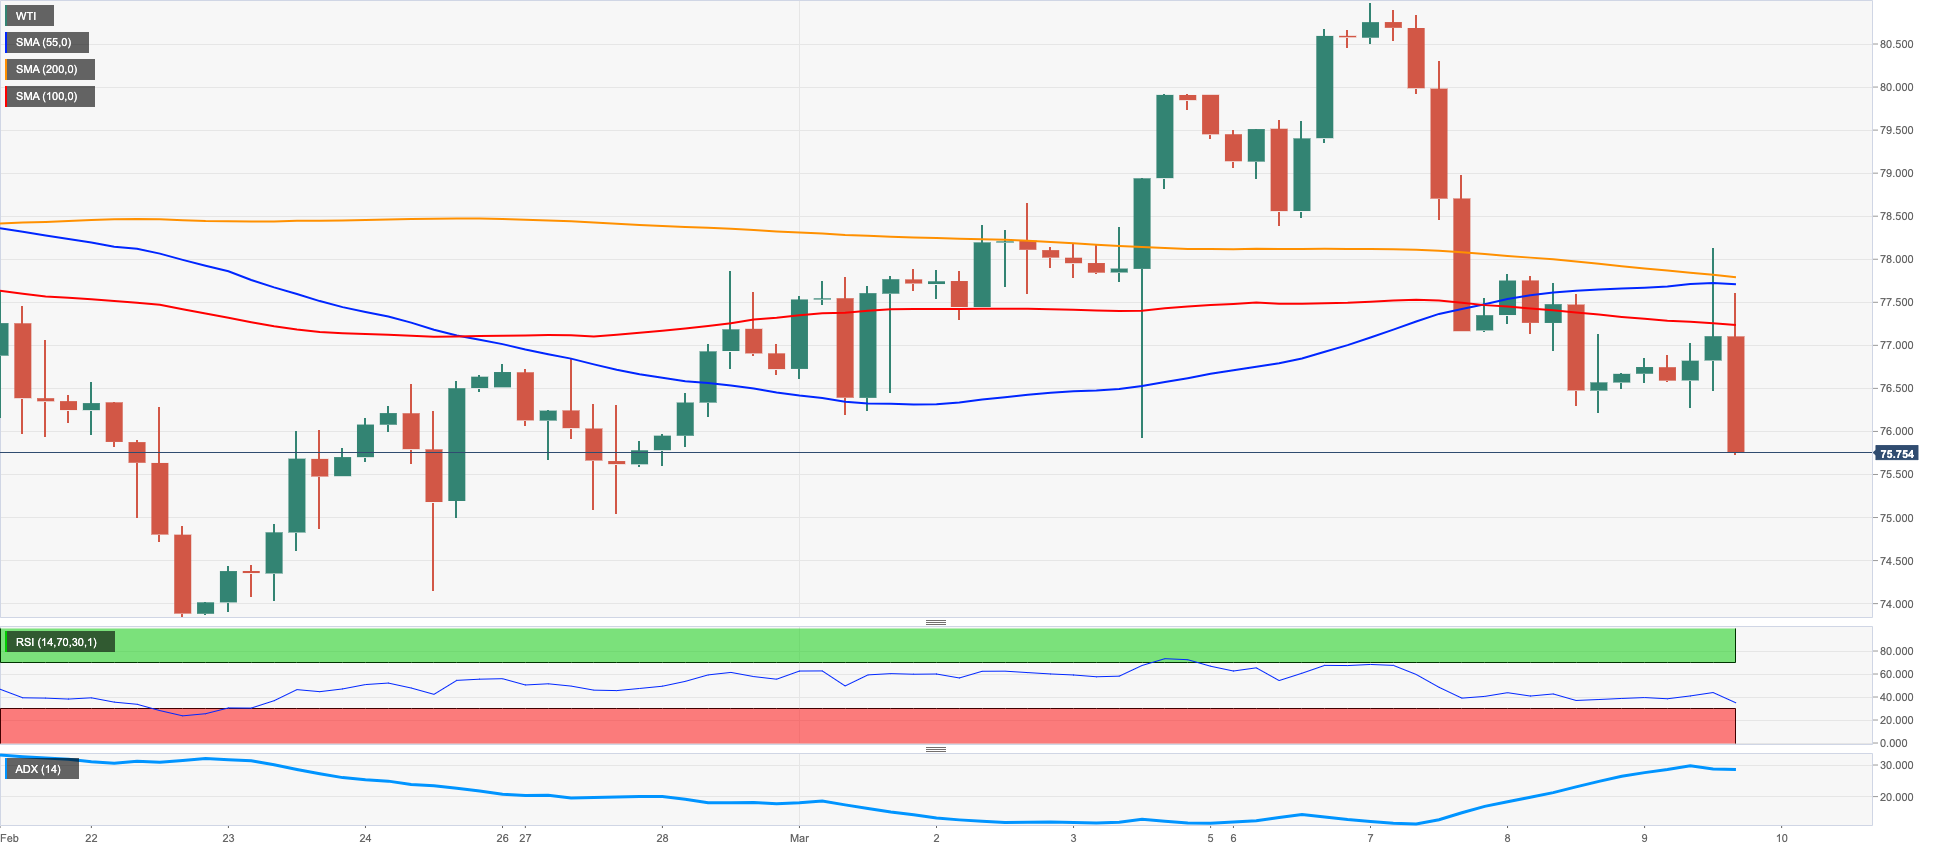
Prices of the barrel of the American reference for the sweet light crude oil added to the weekly pullback and revisited weekly lows in the vicinity of the $76.00 mark on Thursday.
Recession concerns were once again doing the rounds among traders, always on the back of the recent shift in sentiment regarding the potential next steps of the Fed’s hiking cycle, which was particularly exacerbated in response to the unexpected hawkish tilt at Powell’s testimonies earlier in the week.
Somewhat offering some support for the commodity appeared the renewed selling bias in the greenback in combination with lower yields, all of which rendered some support to the risk complex.
In light of the ongoing price action, WTI risks a potential decline to, initially, the weekly low at $73.83 (February 22) ahead of the 2023 low at $72.30 (February 6). The breakdown of this level could leave the commodity vulnerable to a deeper correction to the 2022 low at $70.10 (December 9) prior to the key round level at $70.00. On the other hand, the next up-barrier is expected at the March top at $80.90 (March 7) ahead of the 2023 peak at $82.60 (January 23) and the December 2022 high at $83.32 (December 1). If the WTI leaves this level behind, it could then confront the $90.08 level (November 11 2022) before the November 2022 top at $93.73 (November 7).
Resistance levels: $78.01 $80.90 $82.60 (4H chart)
Support levels: $76.08 $75.80 $73.77 (4H chart)
GER40
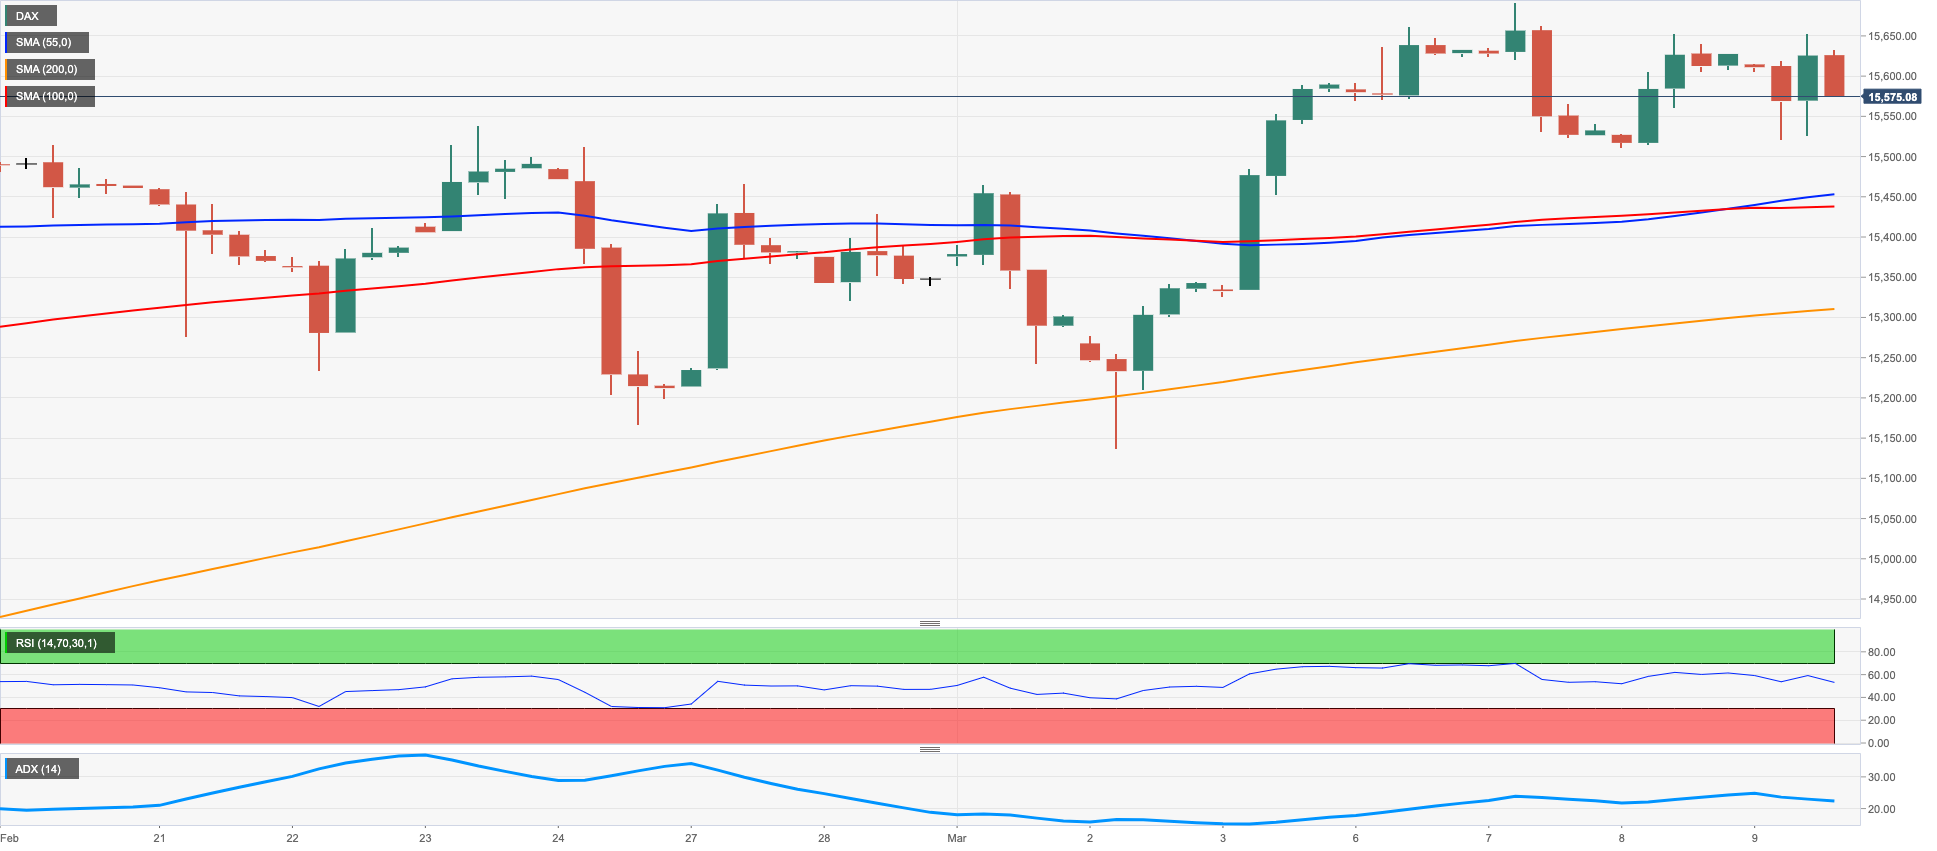
The German reference stock index DAX40 ended Thursday’s session around the previous day’s closing levels near the 15600 region.
The marginal advance in German equities followed the broad-based prudence among market participants ahead of the release of the always-relevant US Non-farm Payrolls figures on Friday.
In addition, concerns surrounding the likelihood of a Fed’s tighter-for-longer stance also weighed on traders’ sentiment following Chair Powell’s hawkish remarks on Tuesday and Wednesday.
On top of it all, Chinese lower-than-expected inflation results also poured cold water over expectations of a strong recovery in the Asian economy, while jitters surrounding the Swiss lender Credit Suisse also collaborated with the inconclusive performance of the index on Thursday.
There were no data releases in Germany, whereas the 10-year Bund yields followed their US peers and added to the weekly leg lower, this time revisiting the 2.60% zone.
Bouts of strength in the DAX40 should meet the immediate hurdle at the 2023 high at 15706 (March 6) closely followed by the February 2022 top at 15736 (February 2 2022). Once the index clears the latter it could attempt a test of the round level at 16000 ahead of the 2022 top at 16285 (January 5). By contrast, there is an initial contention at the March low at 15150 (March 2) seconded by the temporary 55-day SMA at 15059 and the weekly low at 14906 (January 19). Further losses could see the interim 100-day SMA at 14559 revisited prior to the more significant 200-day SMA at 13818. The daily RSI remained close to the 61 level.
Best Performers: Adidas, Sartorius AG VZO, Siemens Energy AG
Worst Performers: Vonovia, Hannover Rueck SE, Zalando SE
Resistance levels: 15706 15736 15912 (4H chart)
Support levels: 15524 15150 14906 (4H chart)
NASDAQ
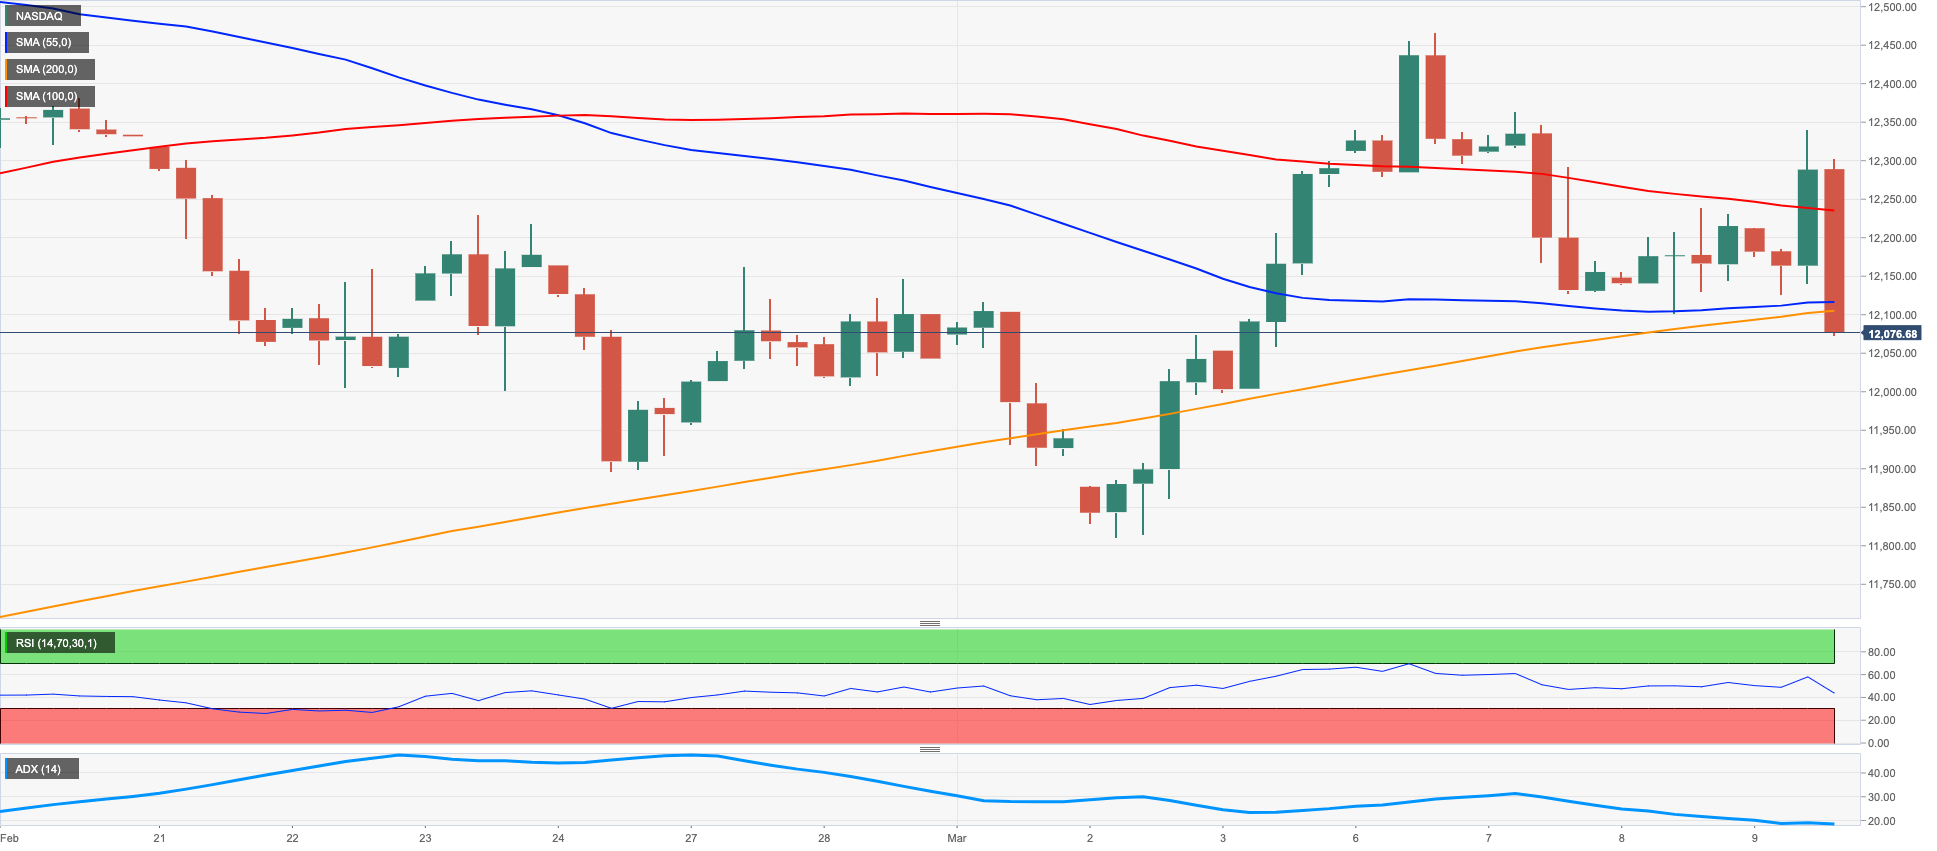
The Nasdaq 100 fell in line with the rest of its US peers and dropped markedly on Thursday, revisiting at the same time the proximity of the 12000 mark.
The corrective decline in the dollar and US yields did nothing to prevent the tech sector from trading with losses on Thursday, as concerns over further tightening by the Federal Reserve remained firm ahead of the publication of the US jobs report on Friday.
A deeper retracement in the Nasdaq 100 should meet the key 200-day SMA at 11905 just ahead of the March low at 11830 (March 2). The latter appears supported by the temporary 55-day SMA at 11796 ahead of the provisional 100-day SMA at 11643. Further down emerges weekly lows at 11550 (January 25) and 11251 (January 19) before the 2023 low at 10696 (January 6) and the December 2022 low at 10671 (December 22). On the flip side, bulls need to clear the March top at 12466 (March 6) in a convincing fashion to allow for a probable visit to the weekly peak at 12689 (February 15) seconded by the 2023 high at 12880 (February 2). Further north comes the round level at 13000 ahead of the weekly top at 13175 (August 26 2022). The daily RSI broke below the 50 yardstick.
Top Gainers: Intel, Constellation Energy, PayPal Holdings Inc
Top Losers: JD.com. Inc Adr, PDD Holdings DRC, Netflix
Resistance levels: 12466 12689 12880 (4H chart)
Support levels: 12102 11830 11613 (4H chart)
DOW JONES
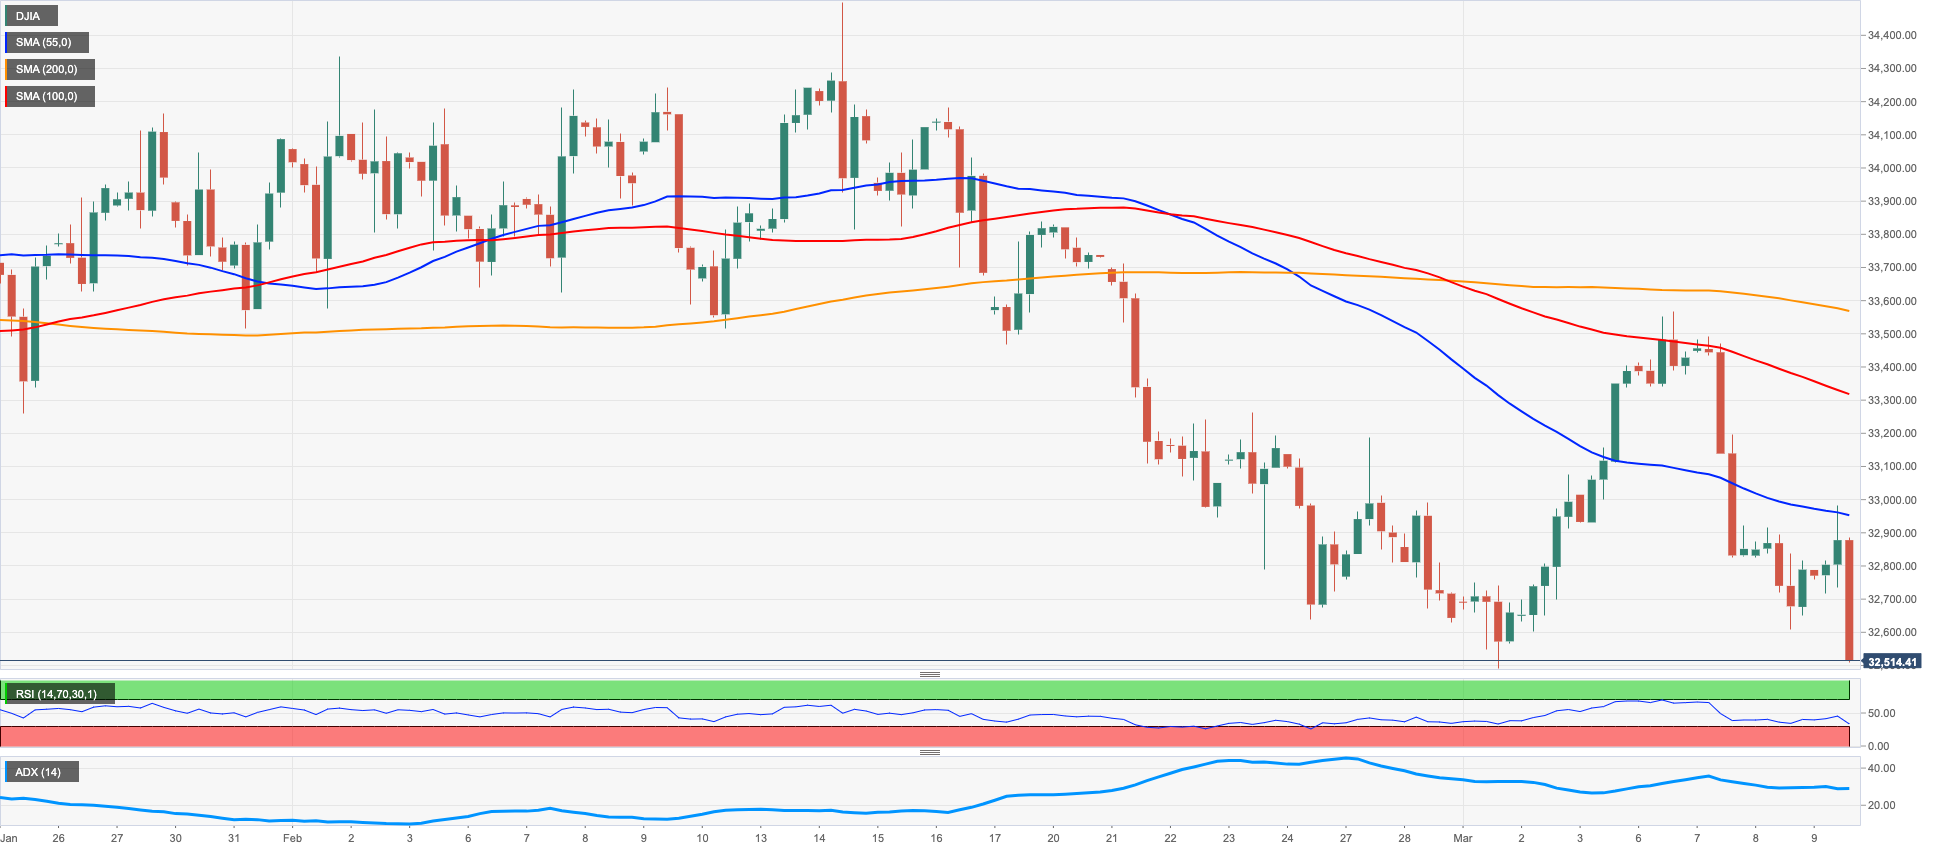
US equities tracked by the Dow Jones grinded lower for the third session in a row and traded at shouting distance from the weekly lows near the 32600 region on Thursday.
In the meantime, there were no changes in investors’ mood on Thursday, as concerns over the continuation of the Fed’s hiking cycle remained on the rise amidst increasing bets of a larger rate hike at the March event.
On the latter, the probability of such a raise is nearly 80% according to CME Group’s FedWatch Tool.
All in all, the Dow Jones dropped 0.59% to 32606 the S&P500 deflated 0.76% to 3961 and the tech-reference Nasdaq Composite retreated 0.87% to 11475.
Further south for the Dow now emerges the 2023 low at 32500 (March 1) prior to the key 200-day SMA at 32393. The breach of this area could open the door to a test of the November 2022 low at 31727 (November 3) ahead of the 2022 low at 28660 (October 13). Having said that, temporary resistance levels emerge at the 100- and 55-day SMAs at 33230 and 33470, respectively, before the March high at 33572 (March 6) and the 2023 top at 34342 (January 13). Extra gains from here should lead up to a probable visit to the December 2022 peak at 34712 (December 13) seconded by the April 2022 high at 35492 (April 21) and the February 2022 top at 35824 (February 9). The daily RSI lost ground and breached 40.
Top Performers: Intel, Procter&Gamble, Microsoft
Worst Performers: JPMorgan, Boeing, Walt Disney
Resistance levels: 33195 33572 34331 (4H chart)
Support levels: 32500 31727 28660 (4H chart)
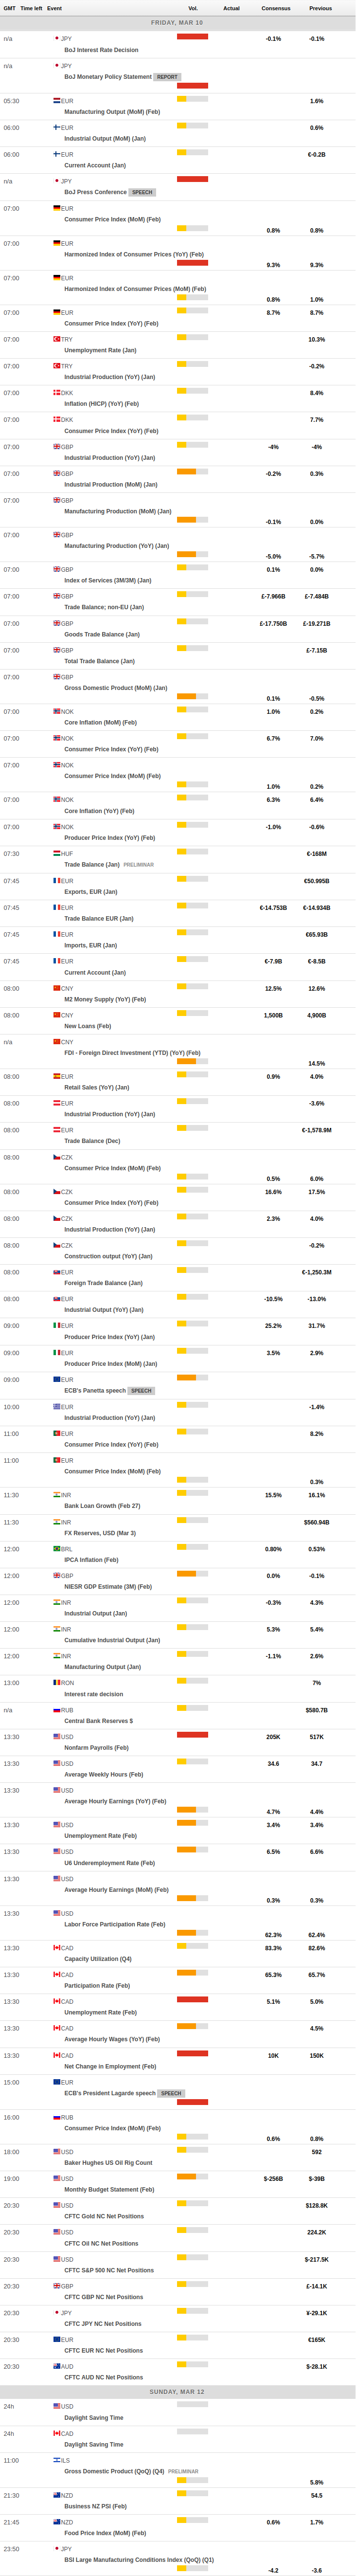
MACROECONOMIC EVENTS
All Information & Updates provided by:

All information relating to the financial markets available on this page has been prepared and issued by FXStreet (Forexstreet SL, Spain, Reg: B62498233) on the basis of publicly available information and all information believed to be reliable and does not conflict with Kuwaiti local laws, and all necessary care has been taken to before the company to ensure that the facts mentioned are correct from the source.
NCM Investment nor any of its directors or employees shall in any way be held responsible for the contents of this news, and the information contained on this page is intended only to provide clients with publicly available information and should not be construed as investment advice, report or analysis and/or constitute an offer or invitation to buy or sell financial instruments of any kind.
RISK WARNING: Forex and CFDs are highly risky leveraged products, as losses can exceed deposits. Please ensure you understand all the risks and take independent advice if necessary. NCM will segregate the clients based on the criteria of the regulator and its bylaws. NCM does not provide any advisory service; the material published does not constitute advice or a recommendation for a transaction in any financial instrument. NCM accepts no responsibility for any use of the content presented and any consequences of that use. Anyone acting on the information provided does so at their own risk.